
Web Insight dashboard
Note:
Starting from 14.1-51.x release, Web Insight analytics are visible for virtual servers that are configured with an IPv6 address.
The improved Web Insight feature is augmented and provides visibility into detailed metrics for web applications, clients, and NetScaler instances. This improved Web Insight enables you to evaluate and visualize the complete application from the perspectives of performance and usage together. As an administrator, you can view Web Insight for:
-
An application. Navigate to Applications > Dashboard, click an application, and select Web Insight tab to view the detailed metrics. For more information, see Application Usage Analytics.
-
All applications. Navigate to Applications > Web Insight and click each tab (Applications, Clients, Instances) to view the following metrics:
Applications Clients URLs Instances Application with Response Time Anomalies Clients URLs Instance Metrics Applications Geo Locations Applications Servers HTTP Request Methods Domains Domains HTTP Response Status URLs Geo Locations URLs HTTP Request Methods URLs Operating System HTTP Response Status HTTP Request Methods Browsers Clients HTTP Response Status SSL Errors Servers SSL Errors SSL Usage Operating System SSL Usage Browsers 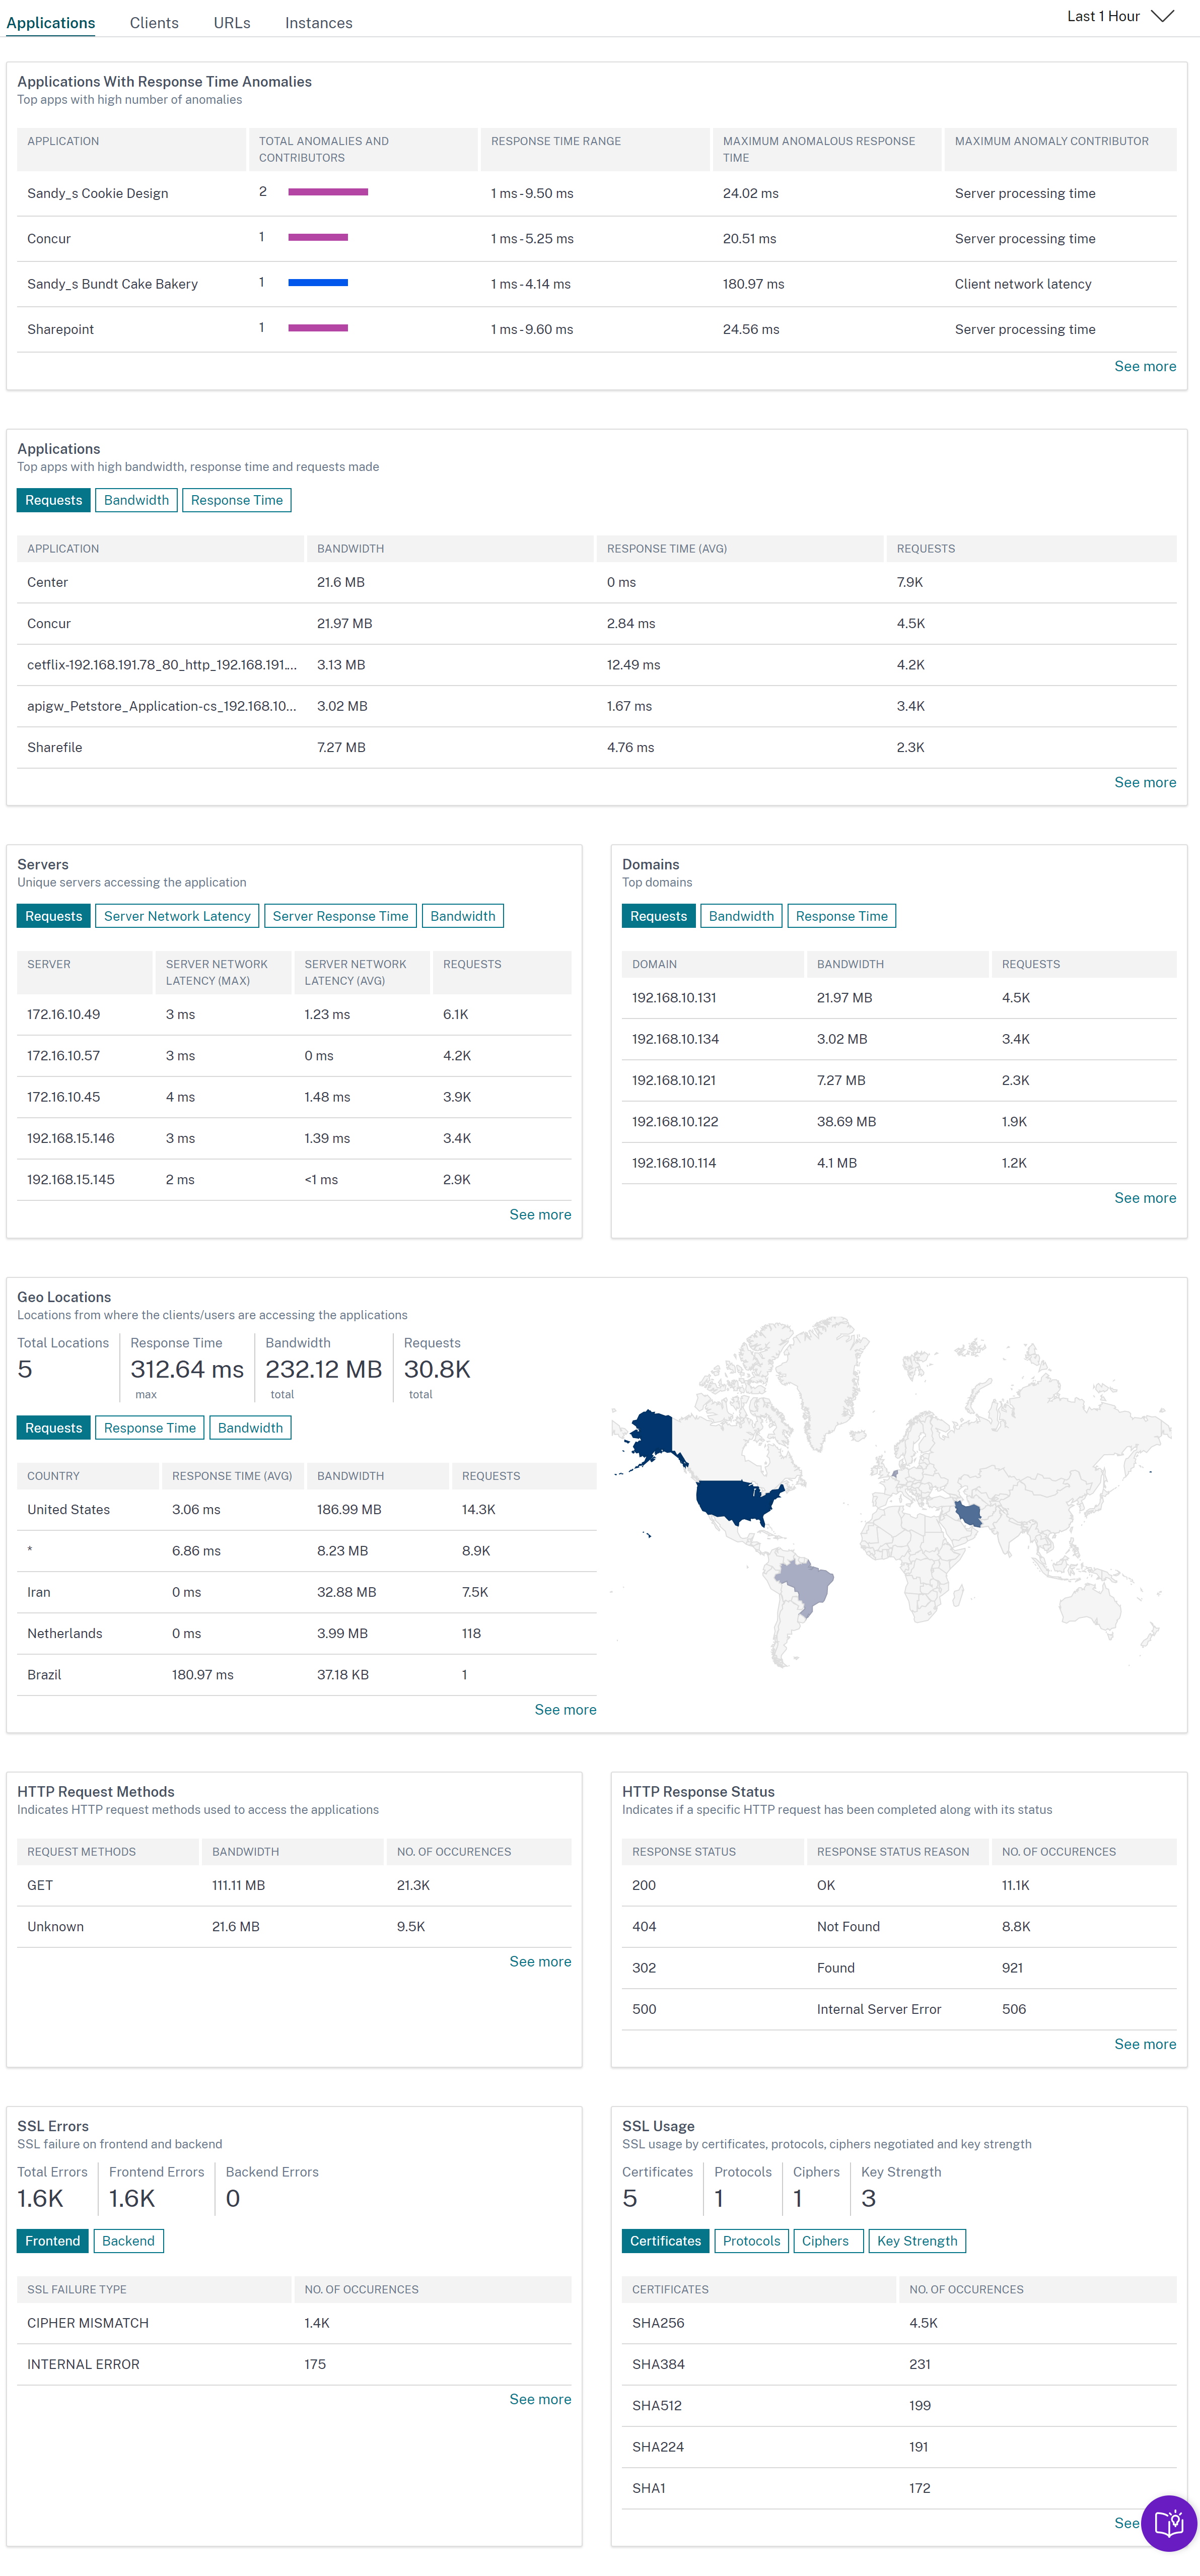
In each metric, you can view the top 5 results. You can click to drill down further to analyze the issue and take troubleshooting actions faster.
Note
-
Starting from 14.1-1.16 or later release, when you drill down a metric, the analytics view in the time series graph displays nil values (for example, 0 ms and 0 request) for the selected duration. Earlier, if there was no traffic or transaction received for the selected duration, the analytics view displayed the graphs by skipping those nil values.
-
In some scenarios, NetScaler might not be able to calculate the RTT values for some transactions. For such transactions, NetScaler Console displays the RTT values as:
-
NA – Displays when the NetScaler instance cannot calculate the RTT.
-
< 1ms – Displays when the NetScaler instance calculates the RTT in decimals between 0 ms and 1 ms. For example, 0.22 ms.
-
Related information
View details for cipher related issues
Under SSL Errors, you can view details for the following SSL parameters:
-
Cipher mismatch
-
Unsupported Ciphers
Under SSL errors, click an SSL parameter (Cipher Mismatch or Unsupported Ciphers) to view details such as the SSL cipher name, the recommended actions, and the details of the affected applications and clients.
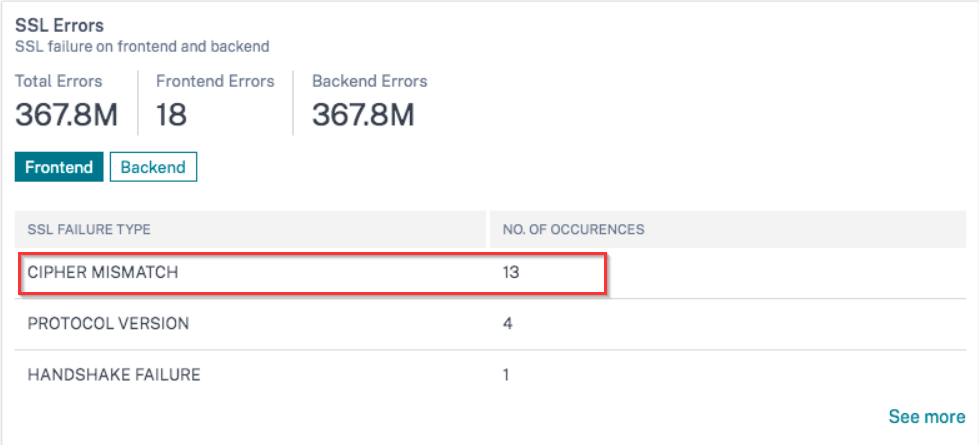
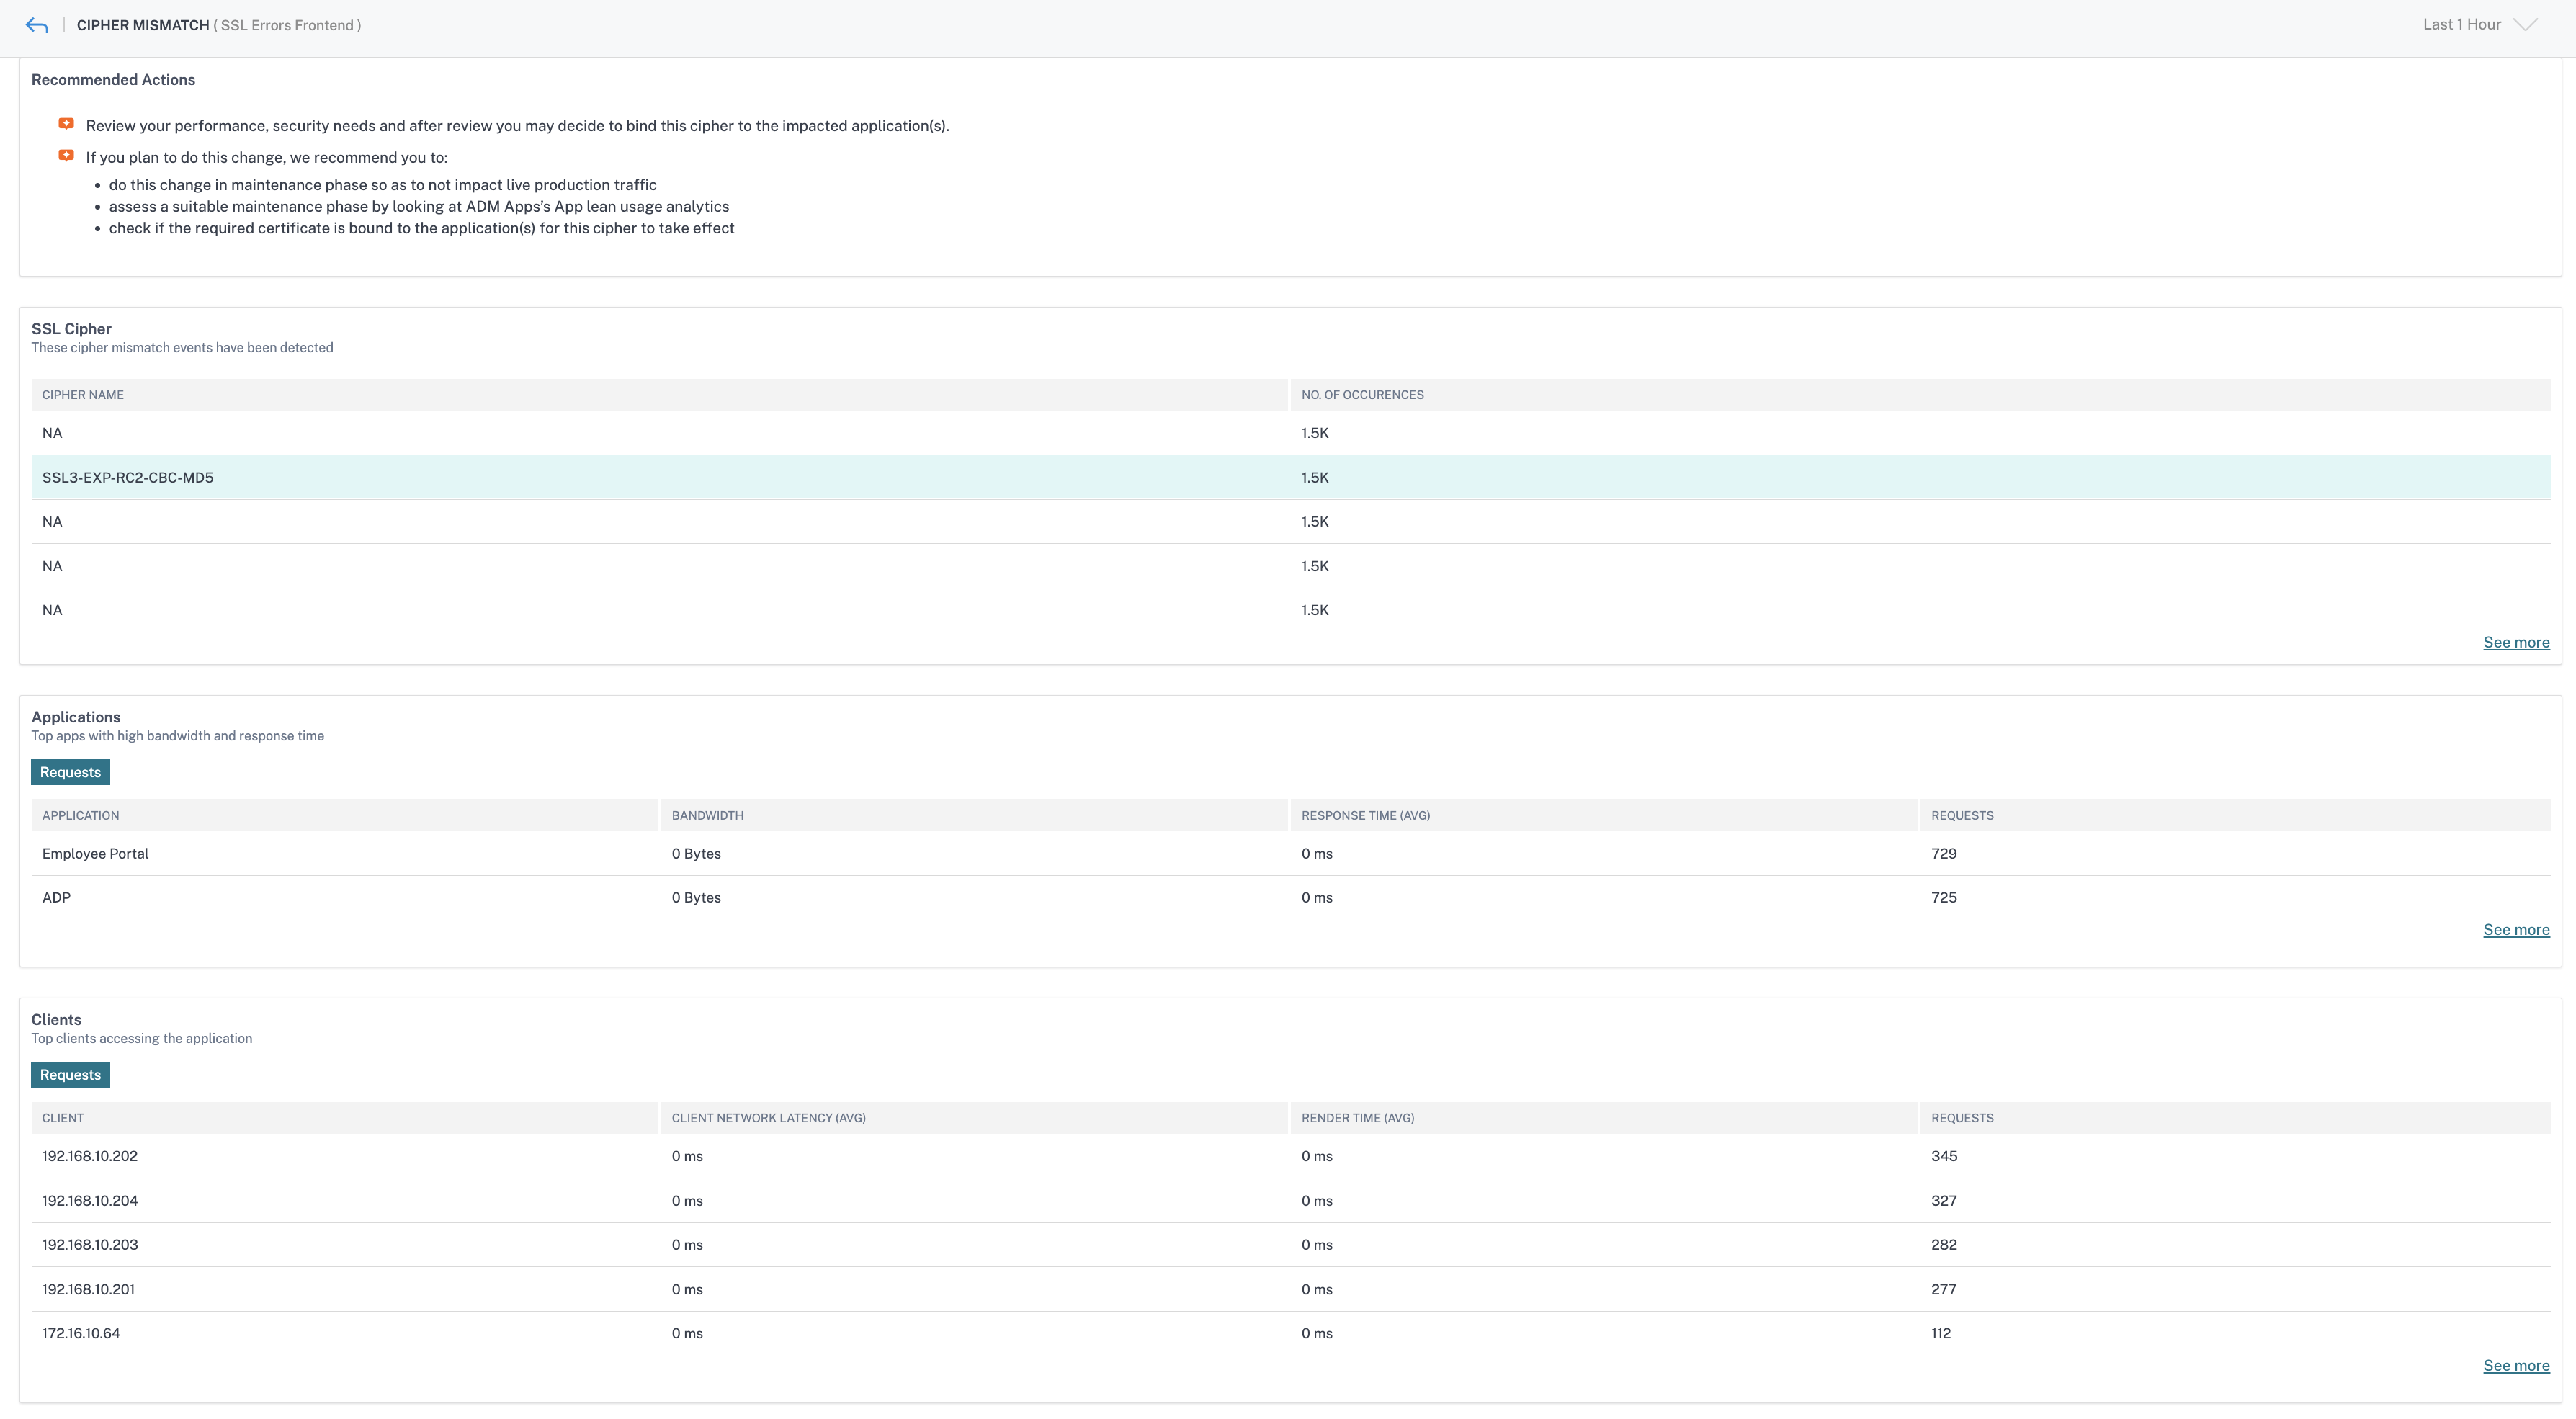
The details page appears for the selected SSL parameter. You can:
-
Review the suggestions provided in the Recommended Actions.
-
View the cipher names and number of occurrences under SSL Cipher.
-
View the total applications and clients affected.
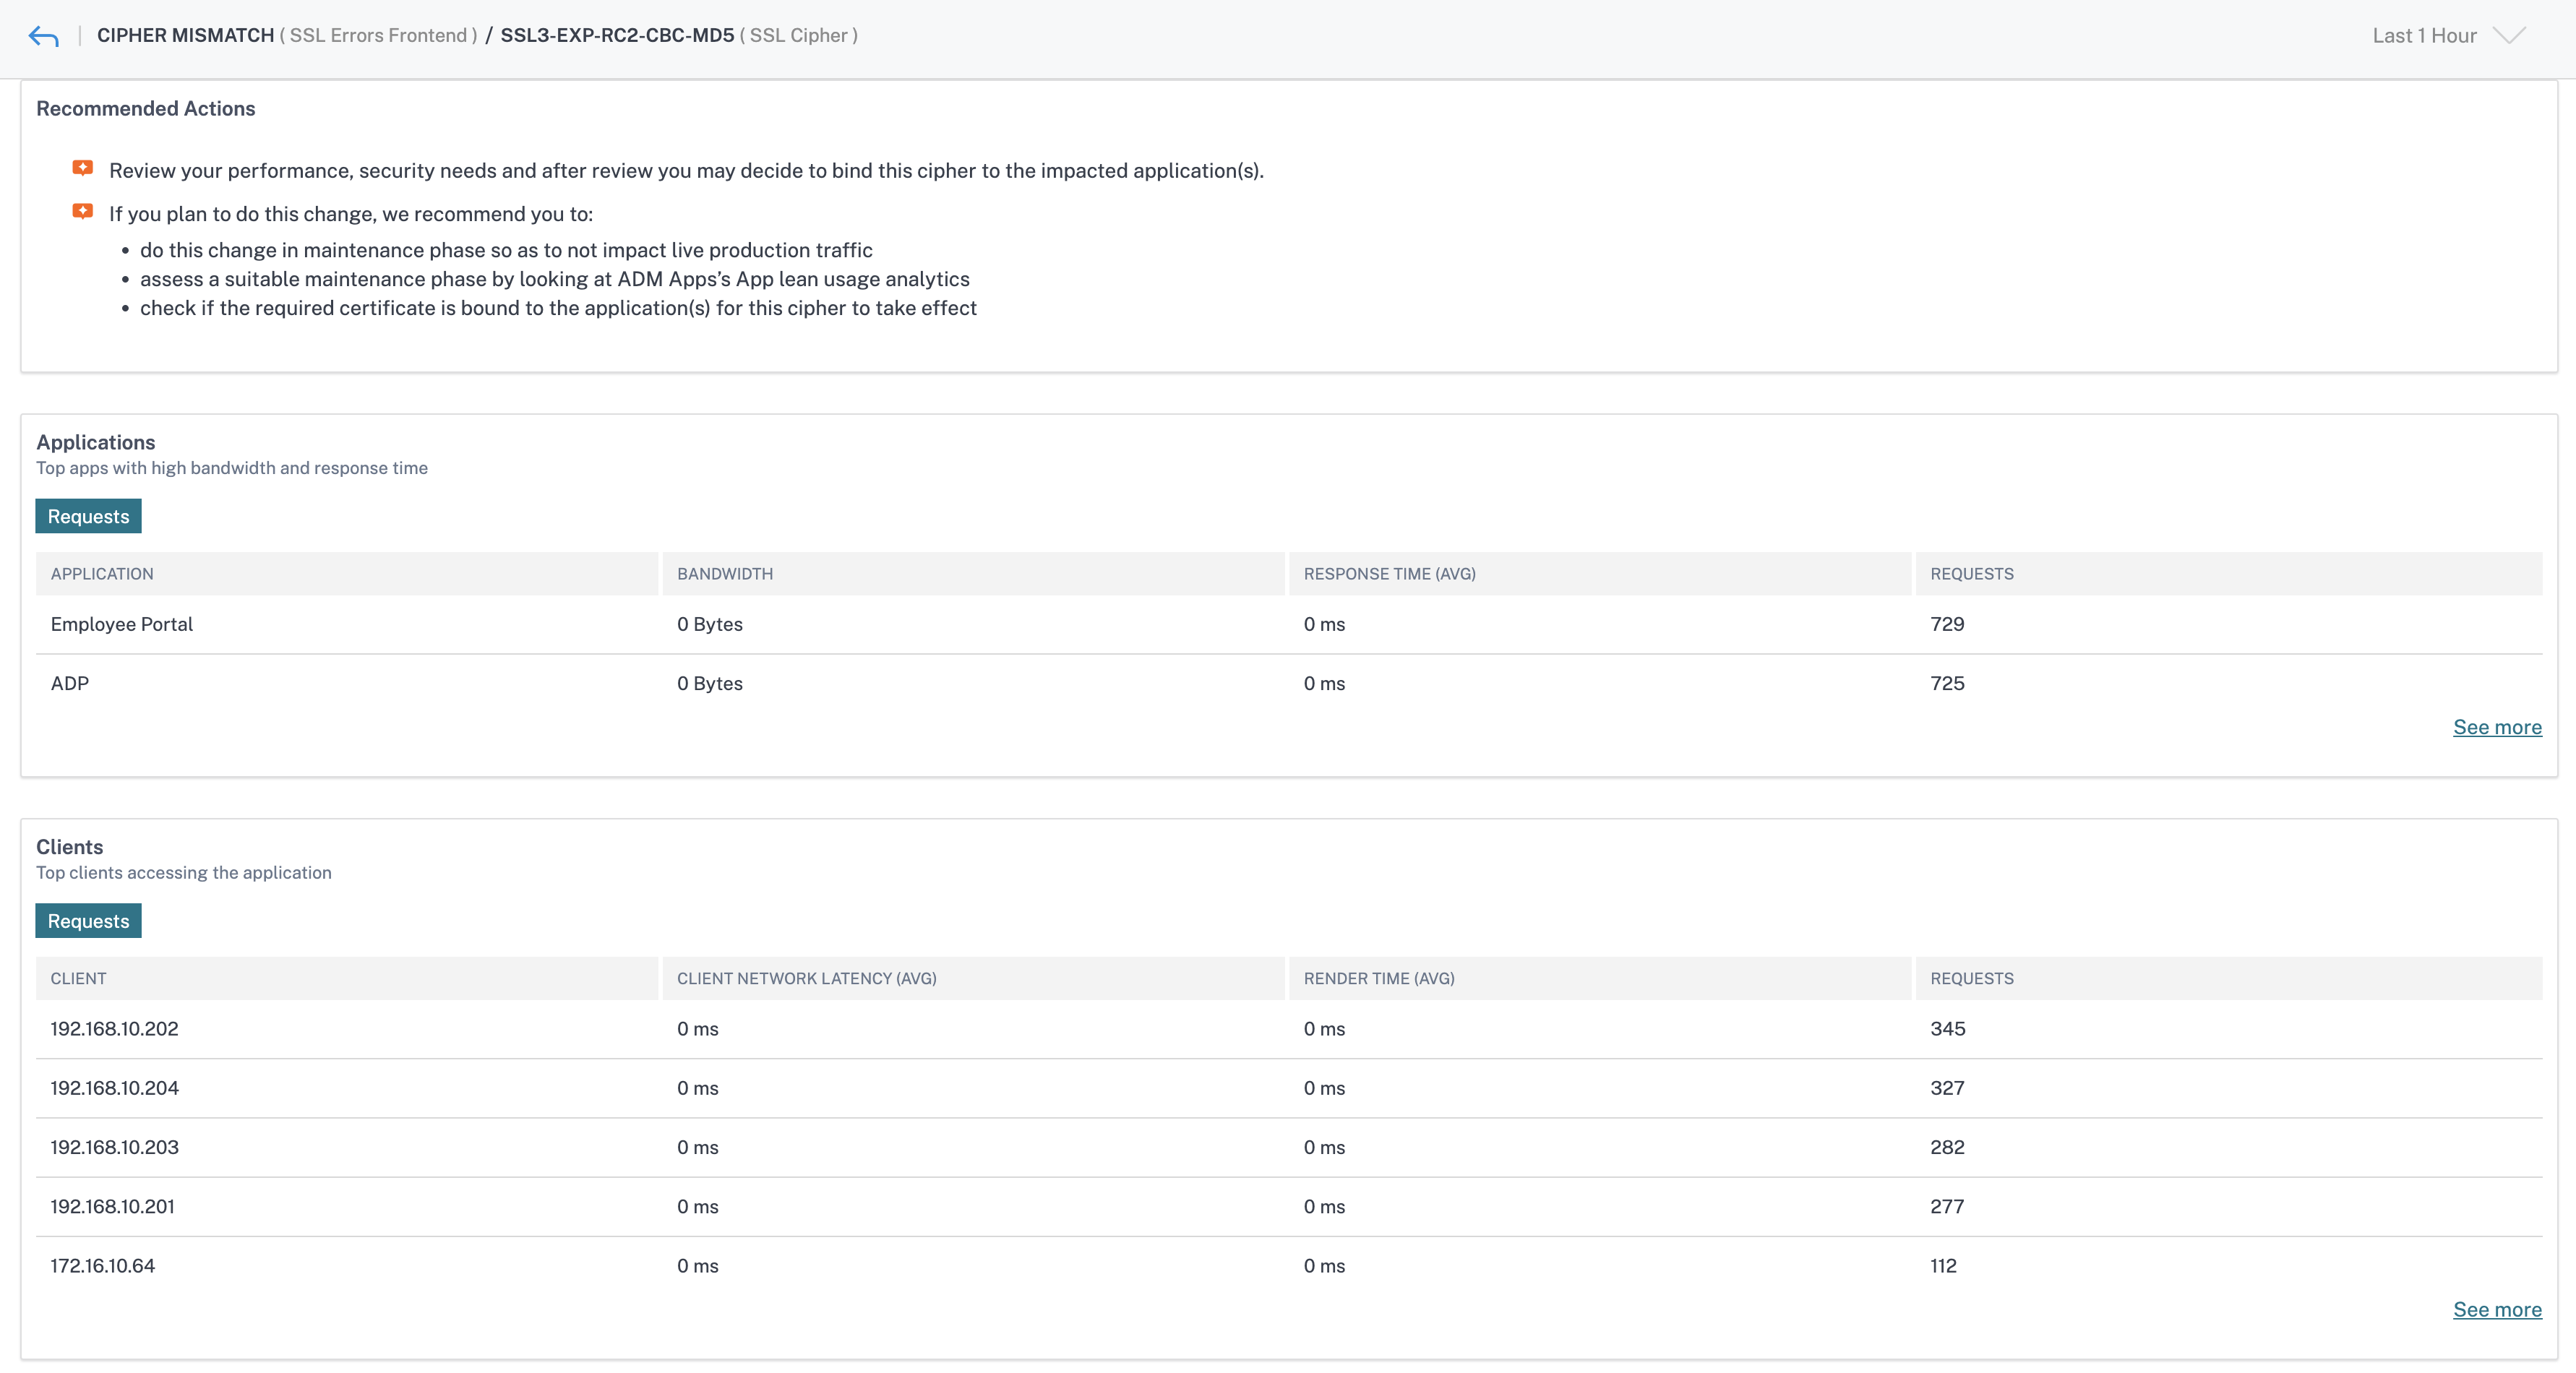
Click the SSL Cipher name to see the applications and clients that are affected with the selected SSL Cipher.
Integrated cache requests
The integrated cache provides in-memory storage on the NetScaler appliance and serves Web content to users without requiring a round trip to an origin server.
The integration cache requests are currently visible under Servers with an IC notification next to the NetScaler virtual server IP address. All other requests are visible with the origin server IP address.
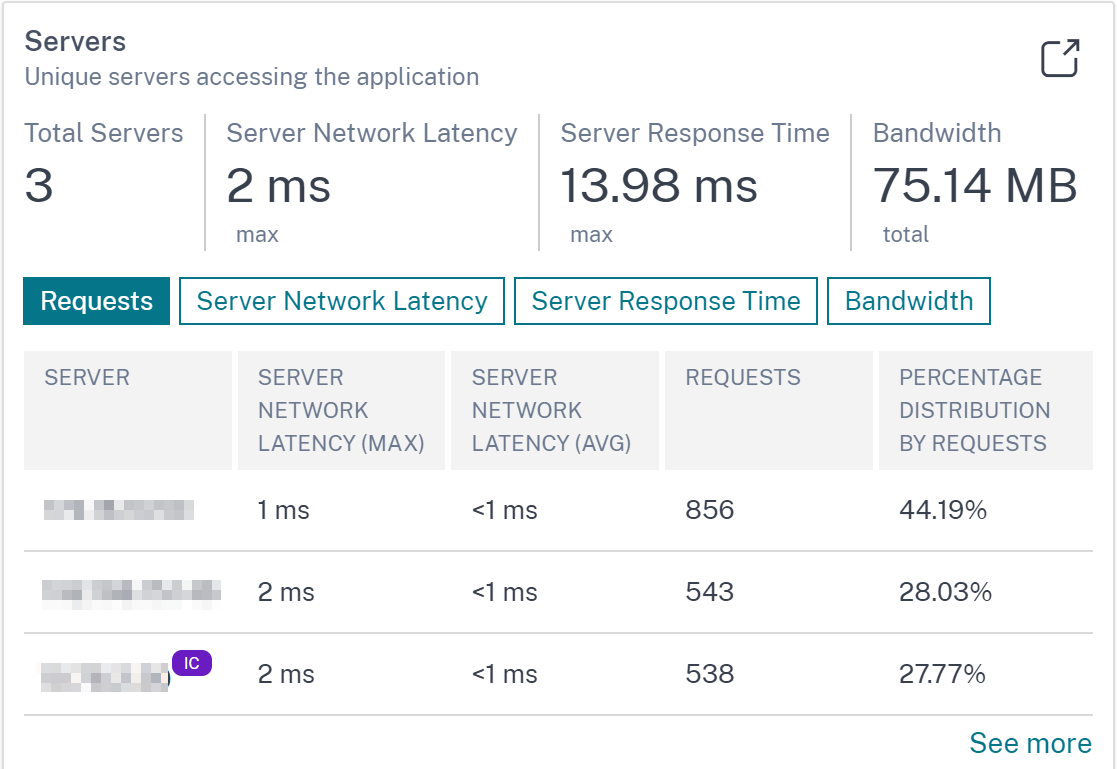
When you drill down a server to view more details, the Server Metrics display integrated cache hits and misses tabs.
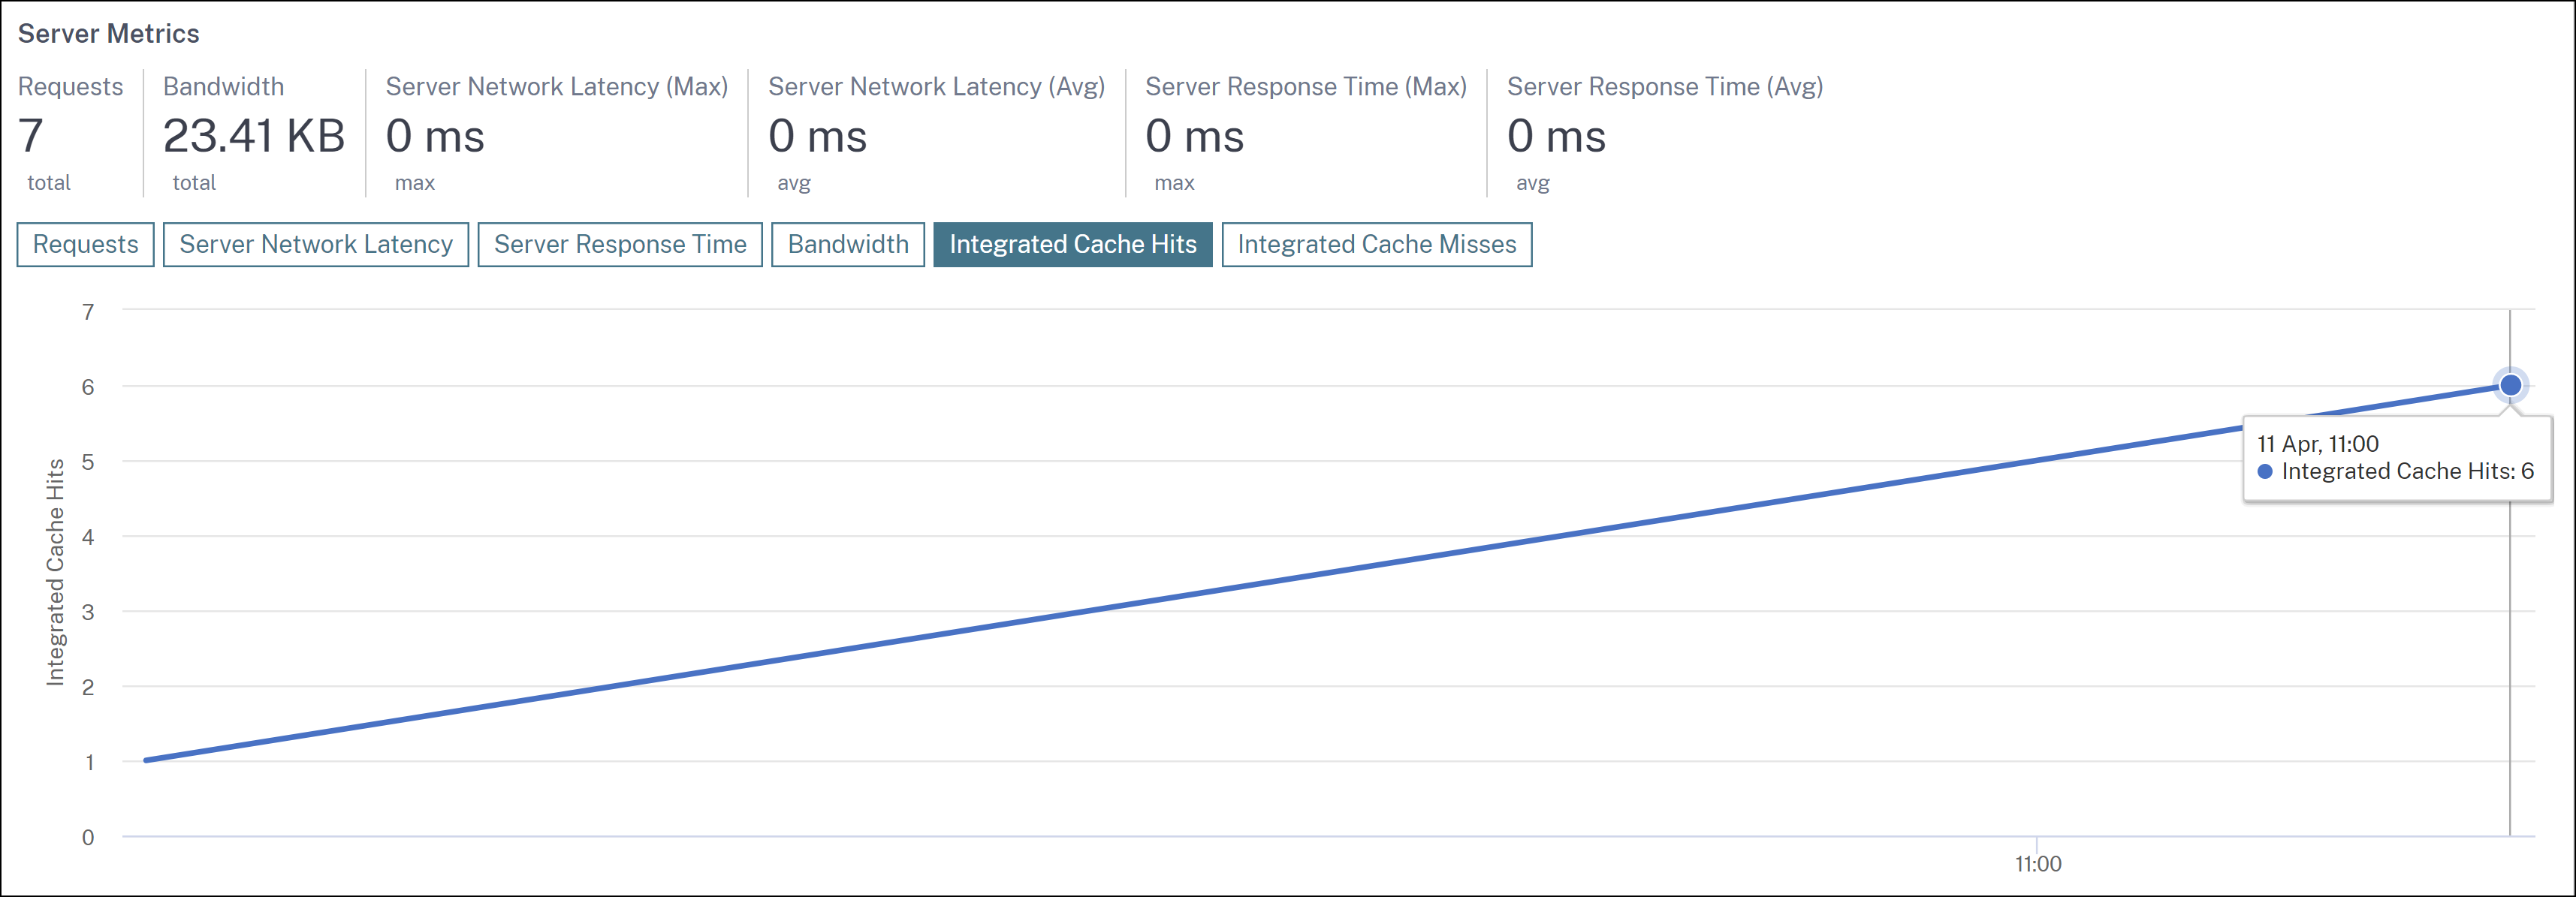
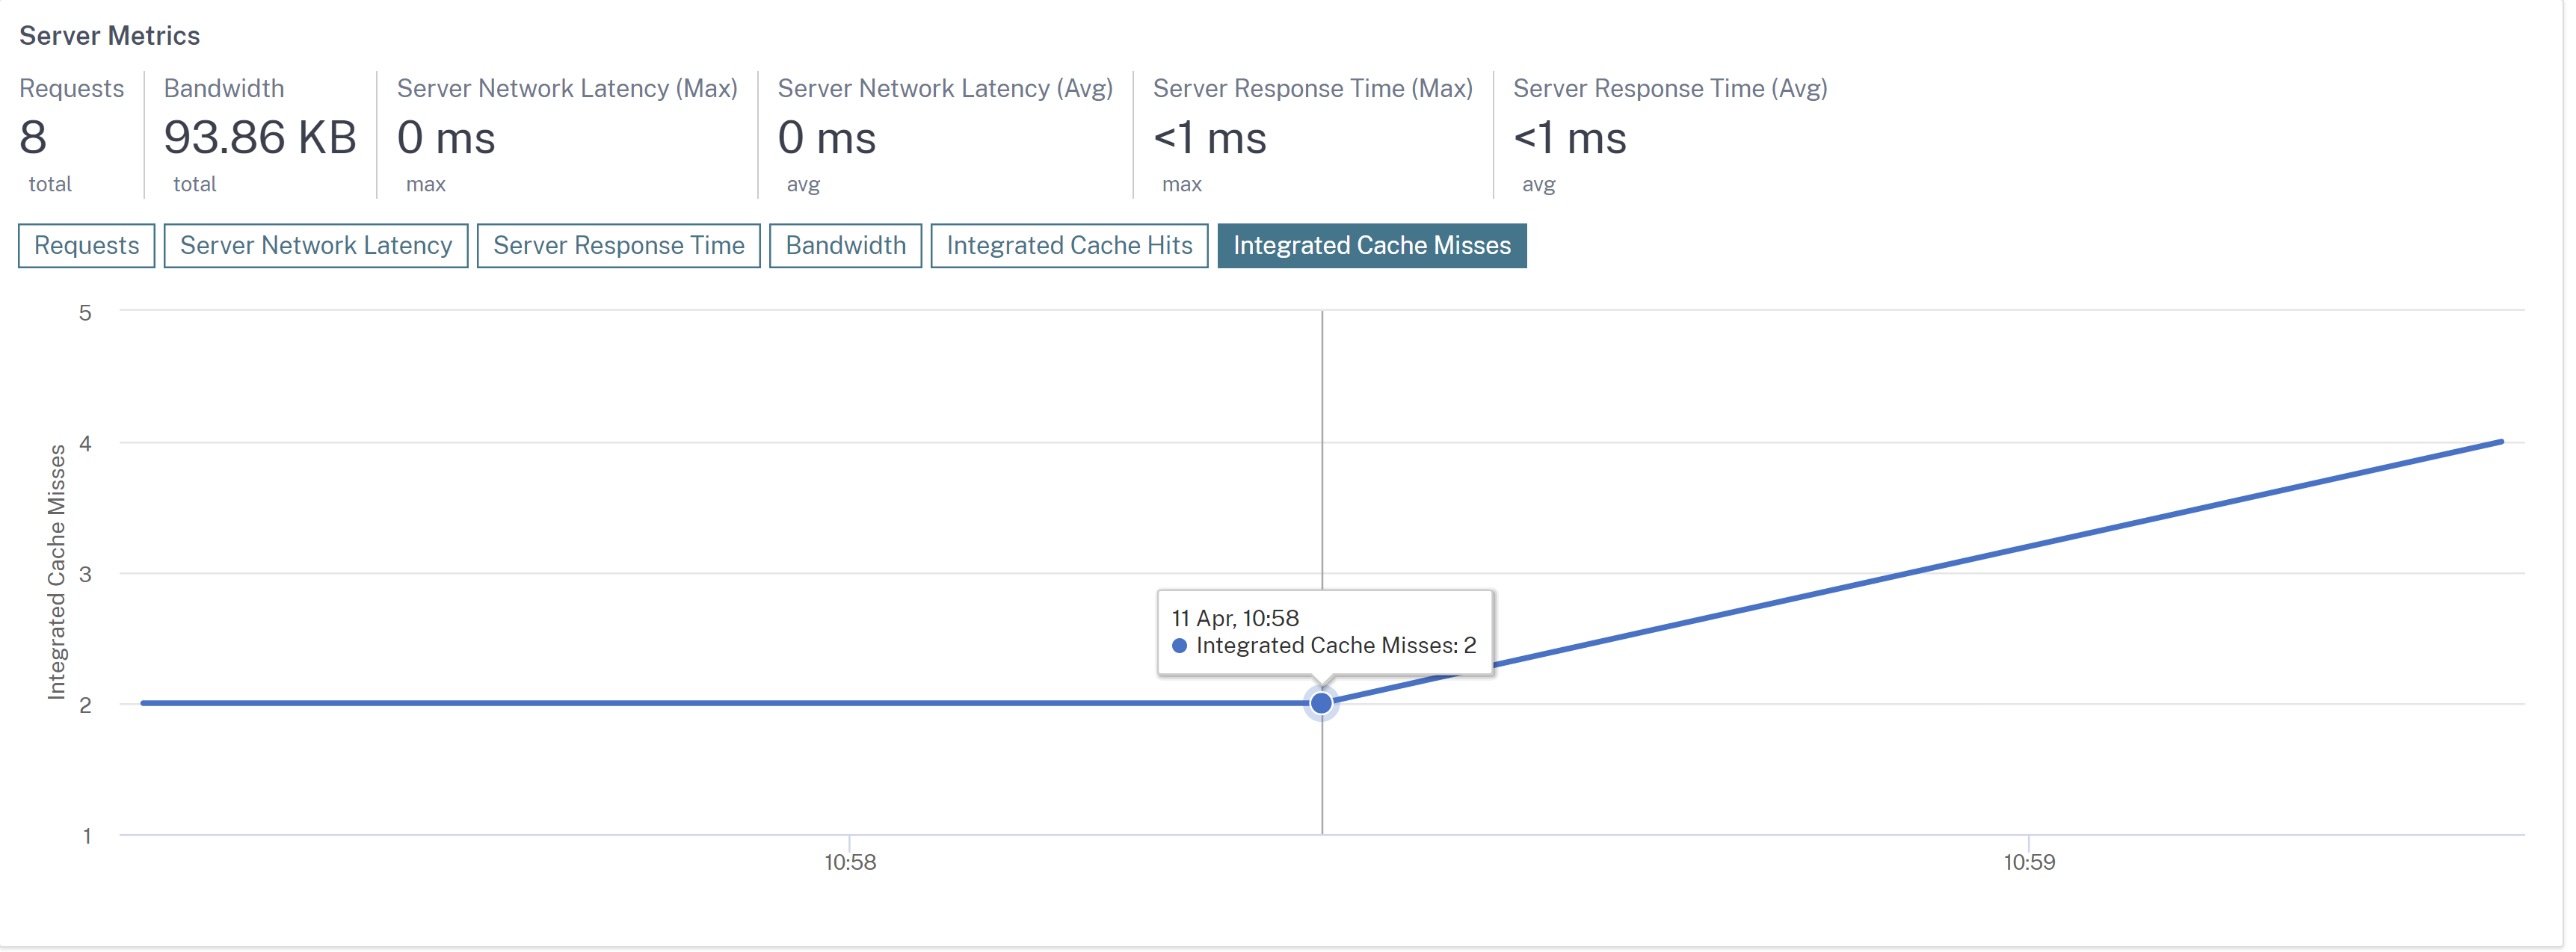
The graph view in:
-
The Integrated Cache Hits tab enables you to view the total responses that the NetScaler appliance serves from the cache.
-
The Integrated Cache Misses tab enables you to view the total responses that the NetScaler appliance serves from the origin server.
Other use case
Consider that you want to analyze the server network latency for 1-month time duration and take a decision whether to scale up or scale down the production environment. To analyze this:
-
Select Last 1 Month from the list and from the Applications tab, scroll down to Servers, and click a server.
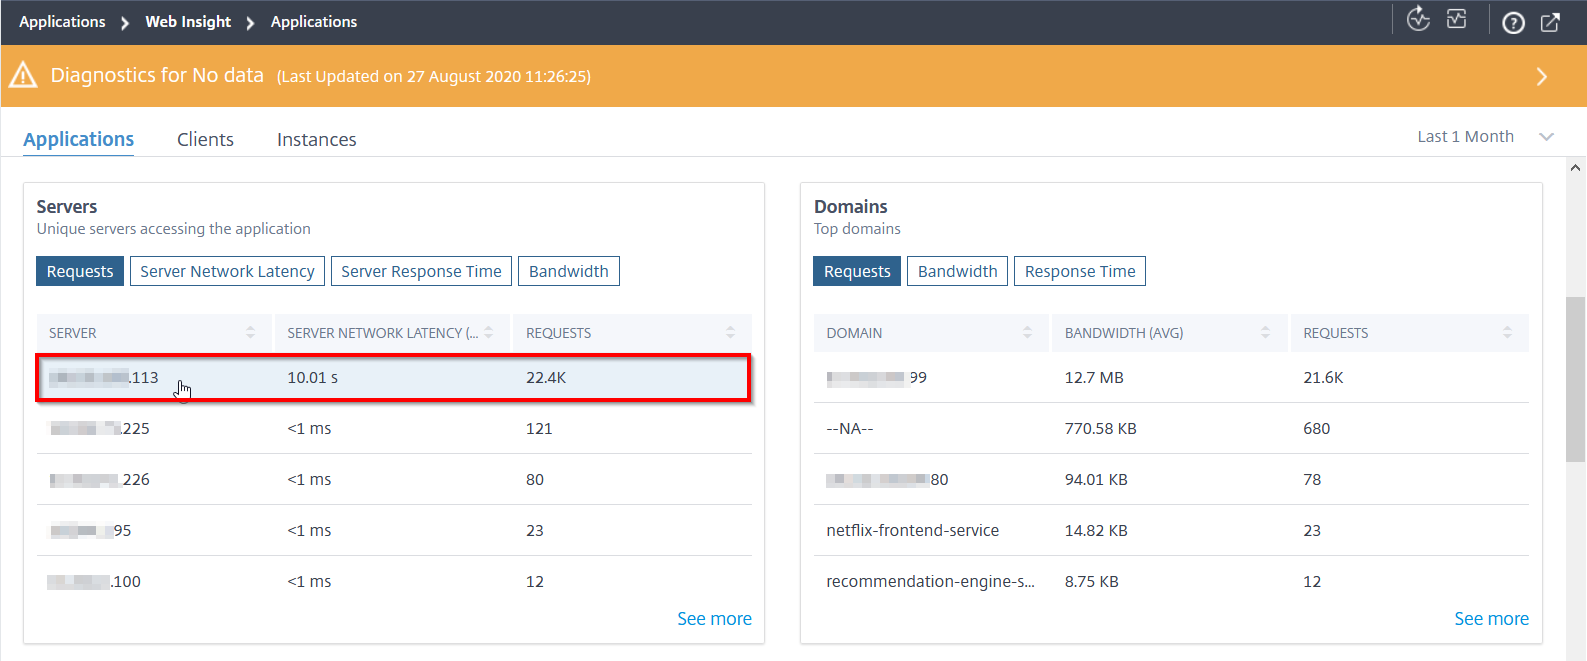 The metrics details for the selected server are displayed.
 -
Select the Server Network Latency tab to analyze the latency.
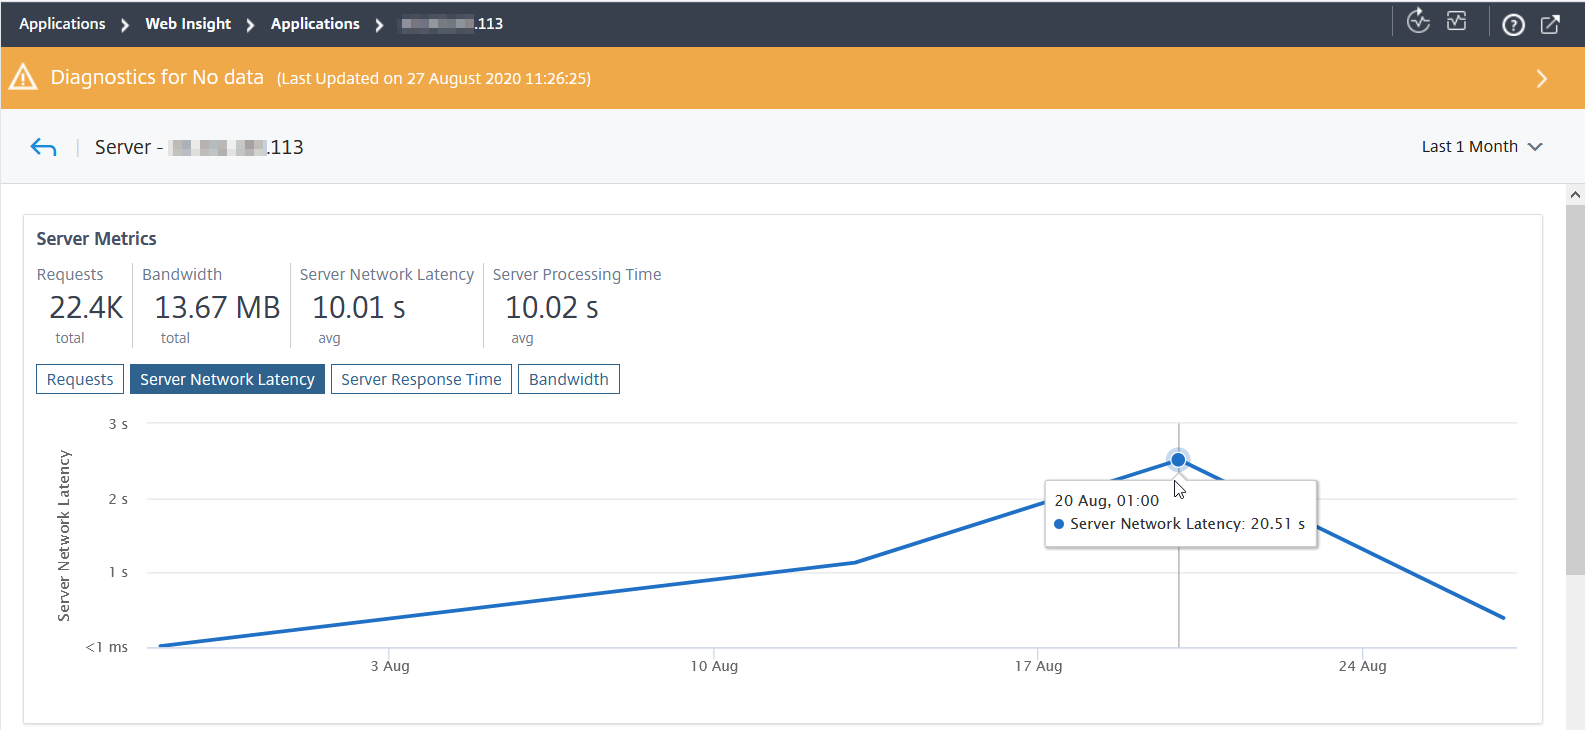 The average latency indicates 10.01 s and from the graph, you can analyze that the server network latency for the last 1 month seems to be high. As an administrator, you can take a decision to scale up the production environment.