
View service details
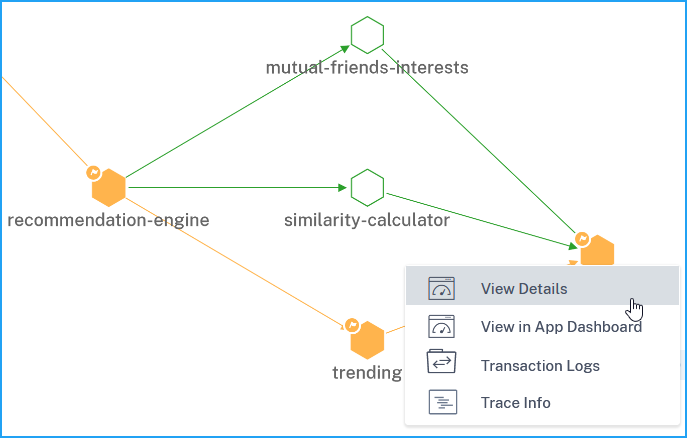
Click a service and select View Details.
The service details page enables you to view:
-
The cluster name where the service is hosted (1)
-
The namespace and service labels of the service (2) (4)
-
All associated incoming and outgoing services connected with the selected service (3)
-
Service key metrics in a graph format such as Hits, Response time, Errors, Data volume, SSL frontend errors, and TCP frontend errors. The Metrics with Anomalies tab enables you to view the anomalies for a specific duration (5).For more information, see Monitor services using the golden signal metrics.
-
The backend pods associated with the service (6).
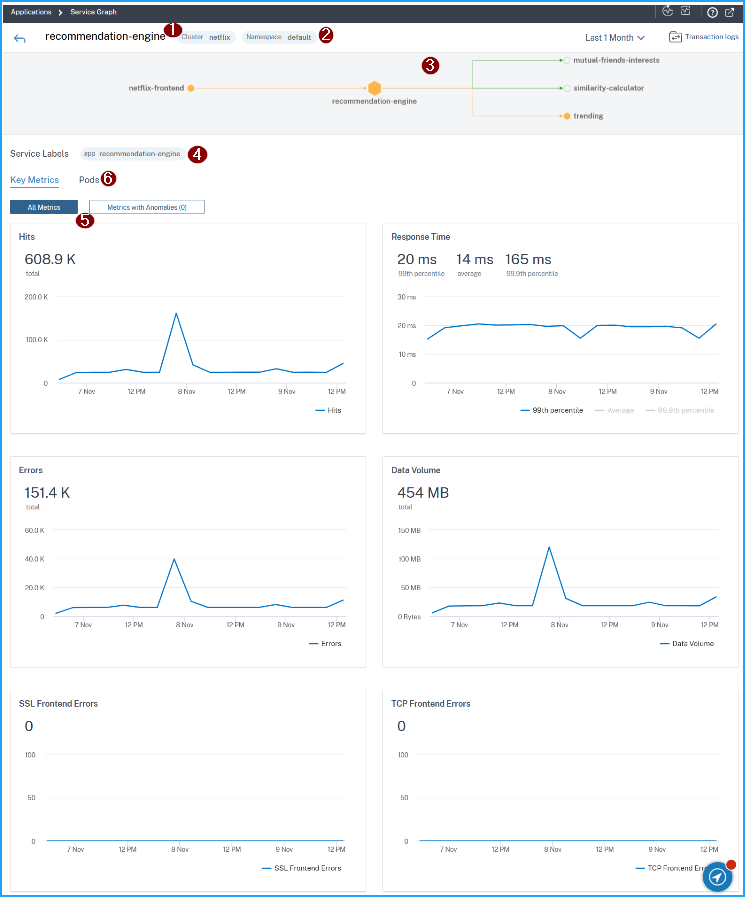
Using these key metrics trends, you can analyze how the service is performing for a specific time duration.
For example, consider that a service indicates Service Response Time > 700 ms for all requests. As an administrator, you can:
-
Analyze the Service Response Time metric trend for a specific duration
-
Troubleshoot the issue
-
Check the Service Response Time metric again to analyze if the response time has improved
Related information
Metrics details
| Metrics | Description |
|---|---|
| Hits | The total number of requests received by the service |
| Errors | The total HTTP errors from the service |
| Service Response Time | The average response time taken from the service to respond for Time To First Byte (TTFB). |
| Data Volume | The total data volume processed by the service |
| SSL front-end errors | The total SSL front-end errors from the service. For example: SSL CLIENTAUTH FAILURE |
| SSL back-end errors | The total SSL back-end errors from the service. For example: SSL Client Errors |
| TCP back-end errors | The total TCP back-end errors from the service. For example: TCP Server Reset |
| TCP front-end errors | The total TCP front-end errors from the service. For example: TCP Client Reset |
View backend pod details
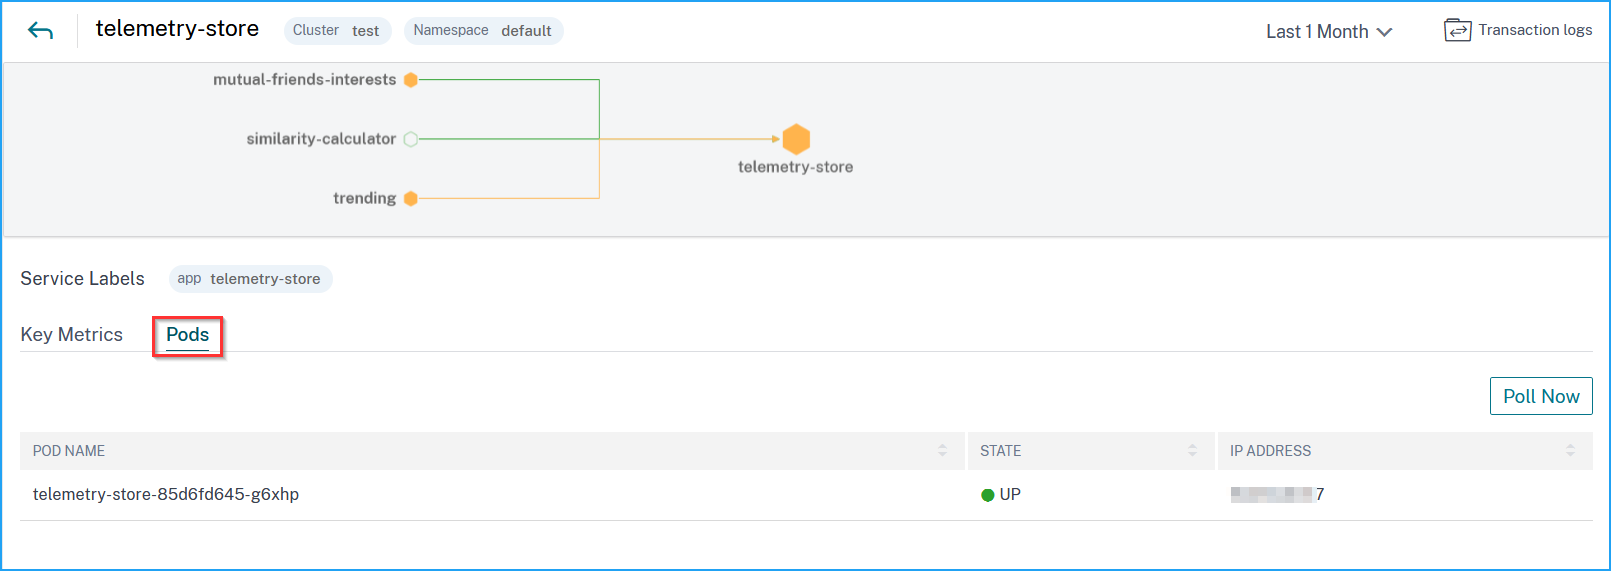
Click the Pods tab to view the backend pods associated with the service.
-
Pod name – Denotes the pod name
-
Status – Denotes if the pod is running (UP) or not (DOWN).
-
IP address – Denotes the pod IP address
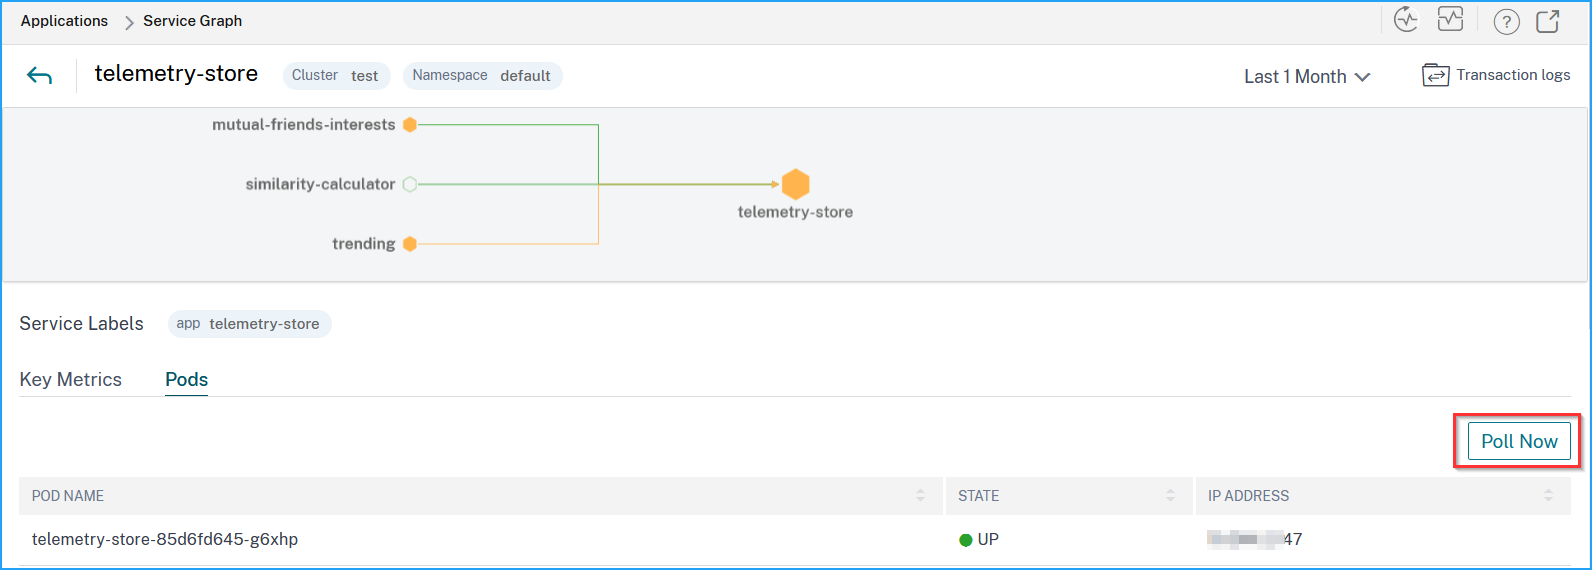
Use the Poll Now option to get the pod status
The Poll Now option fetches the latest pod status from the cluster.
Monitor services using the golden signal metrics
The golden signal metrics in services running in Kubernetes cluster refer to a set of metrics that enable you to detect potential anomalies for a specific duration. When you have 100 s of microservices in the Kubernetes cluster, identifying a service that has frequent issues might be difficult. The following three key metrics are the golden signal metrics that NetScaler Console graph can help you identify potential anomalies for a Kubernetes service:
-
Hits
-
Response Time (Avg) and Response Time (P99)
-
Errors
As an administrator, using these metrics, you can:
-
Identify the service status
-
Critical – Service has anomalies or threshold breach in multiple metrics
-
Review – Service has anomalies or threshold breach in any one of the metrics
-
Good – Service with no anomalies or no threshold breach
-
-
Analyze how many anomalies are identified in each metric
-
Troubleshoot the issue and avoid any major impact
Identify anomalies
When you click a service and select View Details, the service details page displays the overview of all metrics. Click Metrics with Anomalies tab to view the anomaly details.
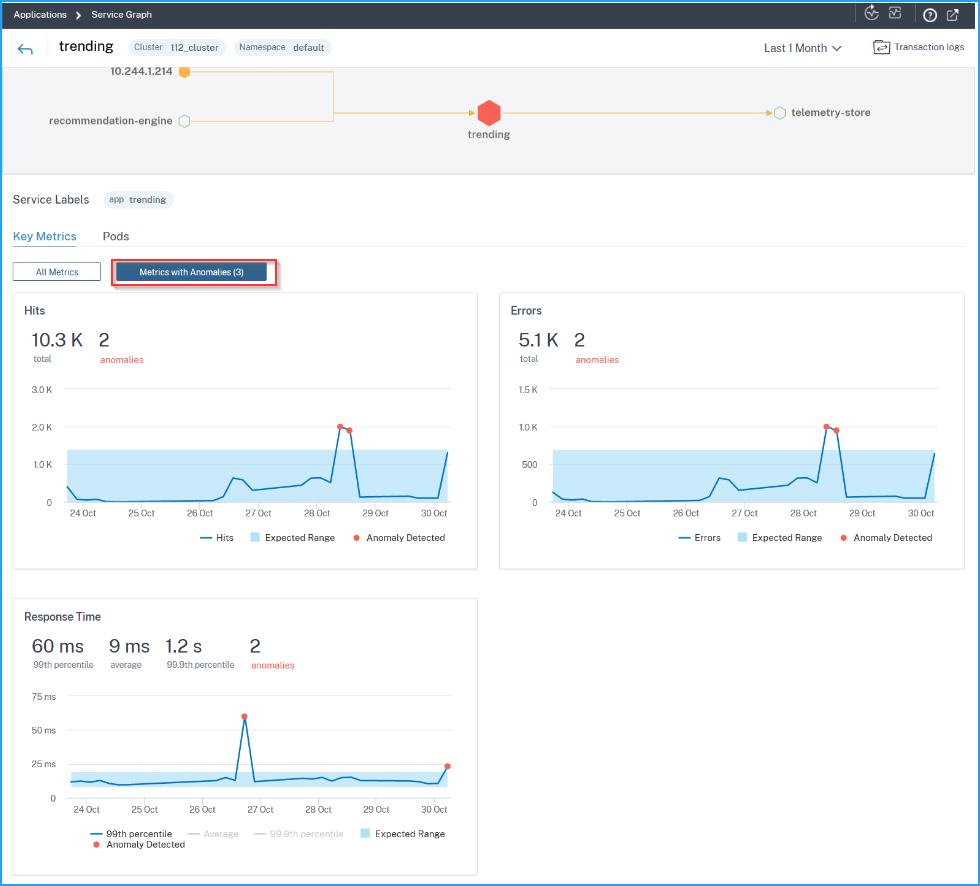
For each metric, the graph enables you to view the anomalies detected whenever the expected range exceeds. You can click the options to filter the views in the graph.
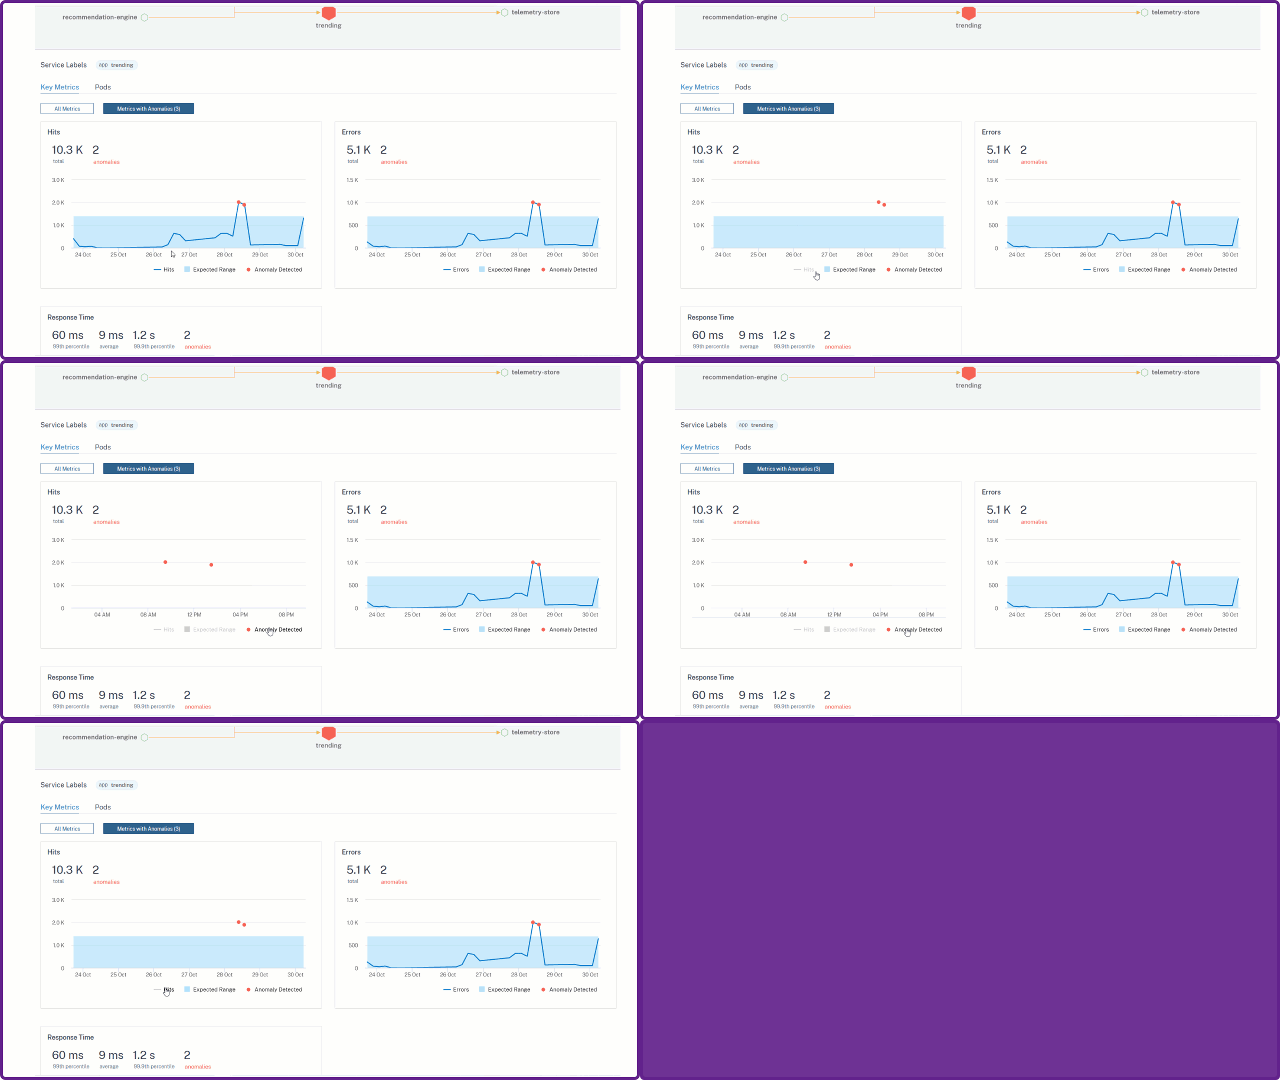
Consider that you want to analyze the anomalies for the service Response Time (P99).
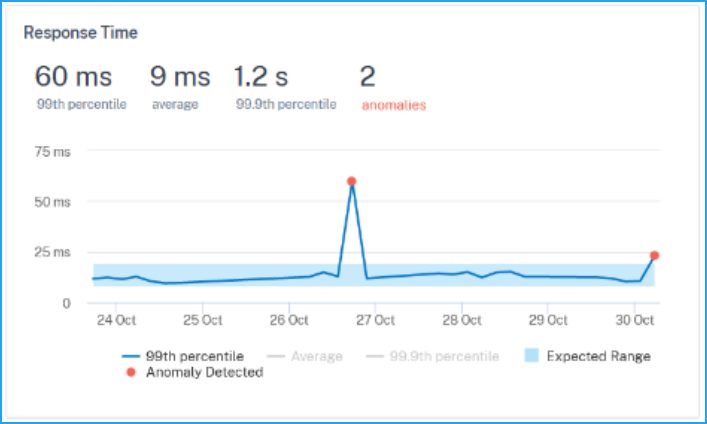
Under Response Time, you can view the following details for the selected time duration:
-
99th percentile – Indicates that the 99% of the requests for the selected duration is less than 60 ms
-
Average – Indicates the average response time from the service
-
99.9th percentile – Indicates the highest response time from the service
-
Anomalies – Indicates the total anomalies detected
The graph also enables you to view the expected range for the selected time duration. According to the example, you can view:
-
The response time expected range is between 1 ms and 9 ms.
-
Two anomalies detected for the service (one for 60 ms and another for 25 ms), because the service response time has exceeded more than the expected range (between 1 ms and 9 ms).