View API analytics
API analytics enables visibility into API traffic. This analytics allows IT administrators to monitor API instances and endpoints served by an API gateway. It provides integrated periodic monitoring of API requests.
Before you monitor API analytics, ensure to complete the following:
In API Analytics, you can monitor the response time of API instances and endpoints that are added as part of API definitions. It also displays the bandwidth consumed by API instances and endpoints.

By default, the dashboard displays API analytics for the last one hour. You can select a duration to view API analytics for that interval. Click See more on each tile to view the entire list. In this view, you can search API instances and endpoints by their partial names except the Geo Locations tile.
Related information
API endpoint distribution
This graph displays the distribution of application and server response time for API endpoints. You can identify an API endpoint that has a huge response time and take the necessary actions.
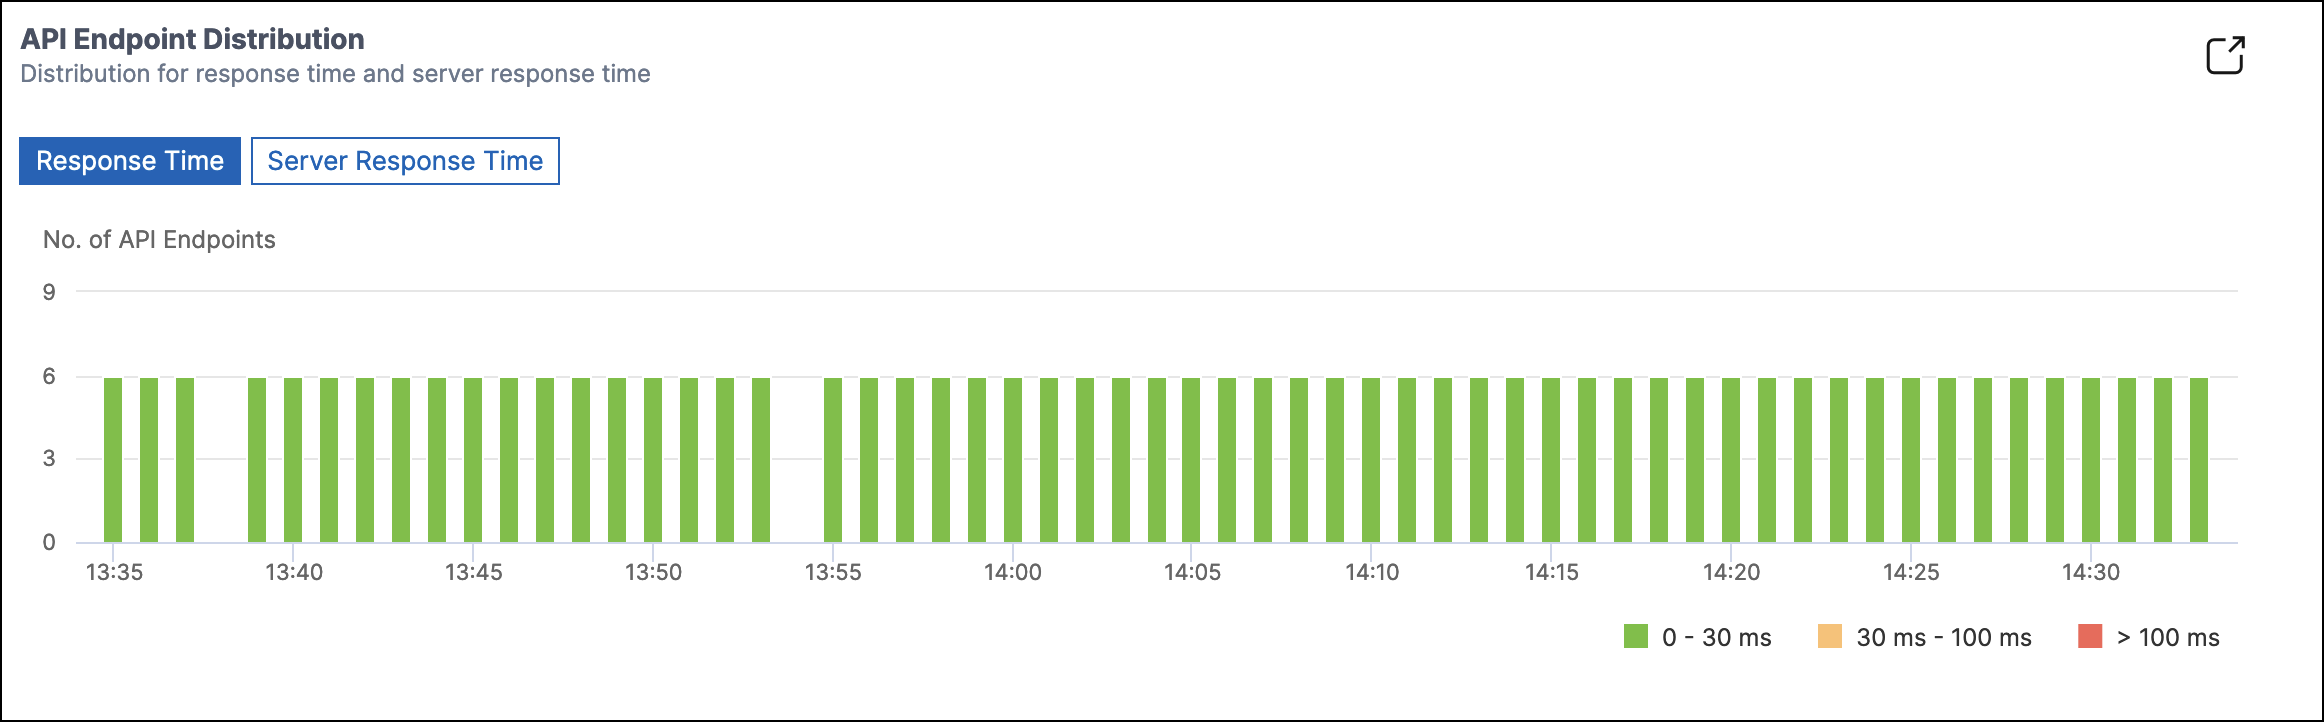
The API endpoints appear in one of the following colors depending on their response time limits:
-
Green – If the response time is less than 30 milliseconds.
-
Orange – If the response time is between 30–100 milliseconds.
-
Red – If the response time is more than 100 milliseconds.
API instances
The API Instances tile displays the top API instances with high application and server response time.
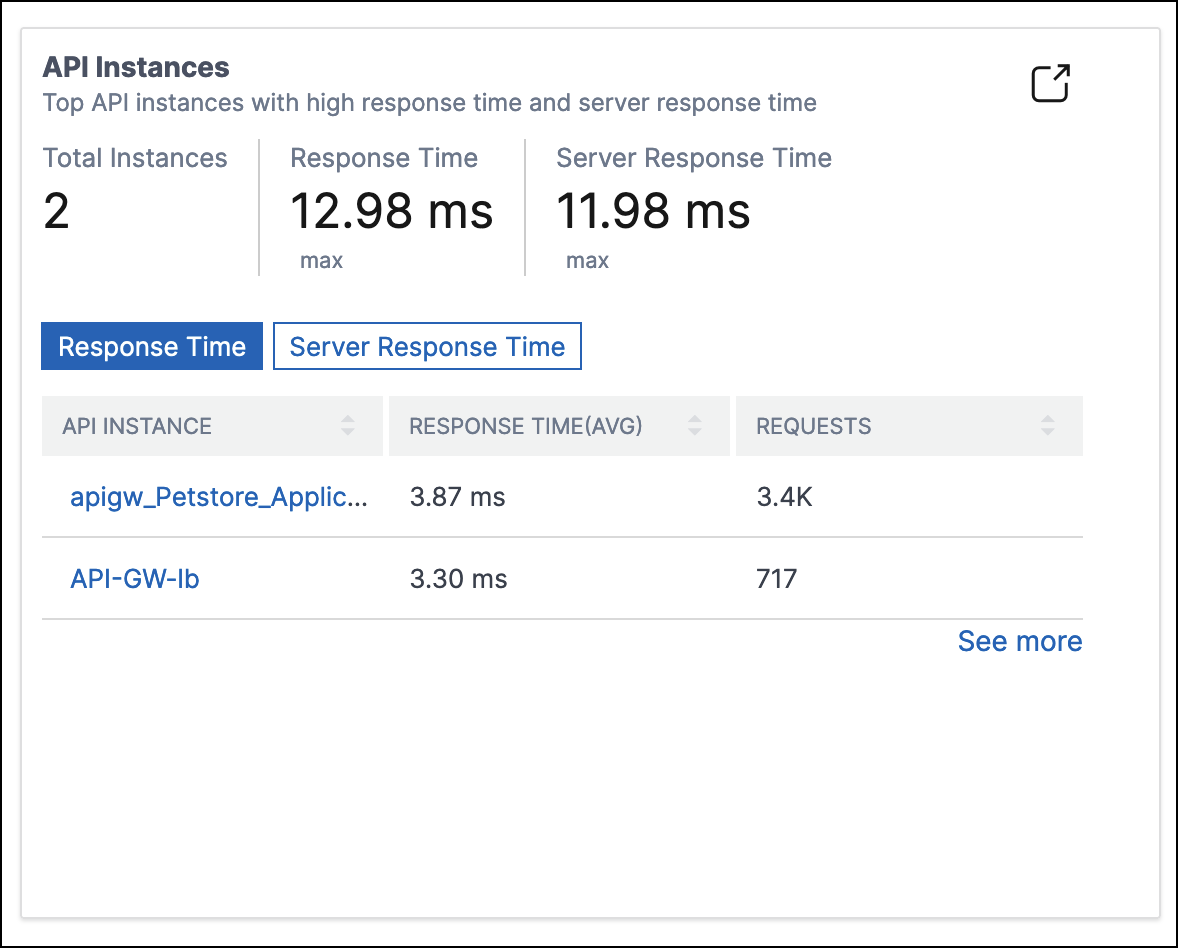
Select an API instance to view its performance, usage, and security details. The selected API instance displays the following information:
-
API endpoints count
-
Requests count
-
Application and server response time
-
Consumed bandwidth
-
Authentication failures

API endpoints
The API Endpoints tile displays the top endpoints with high application and server response time.
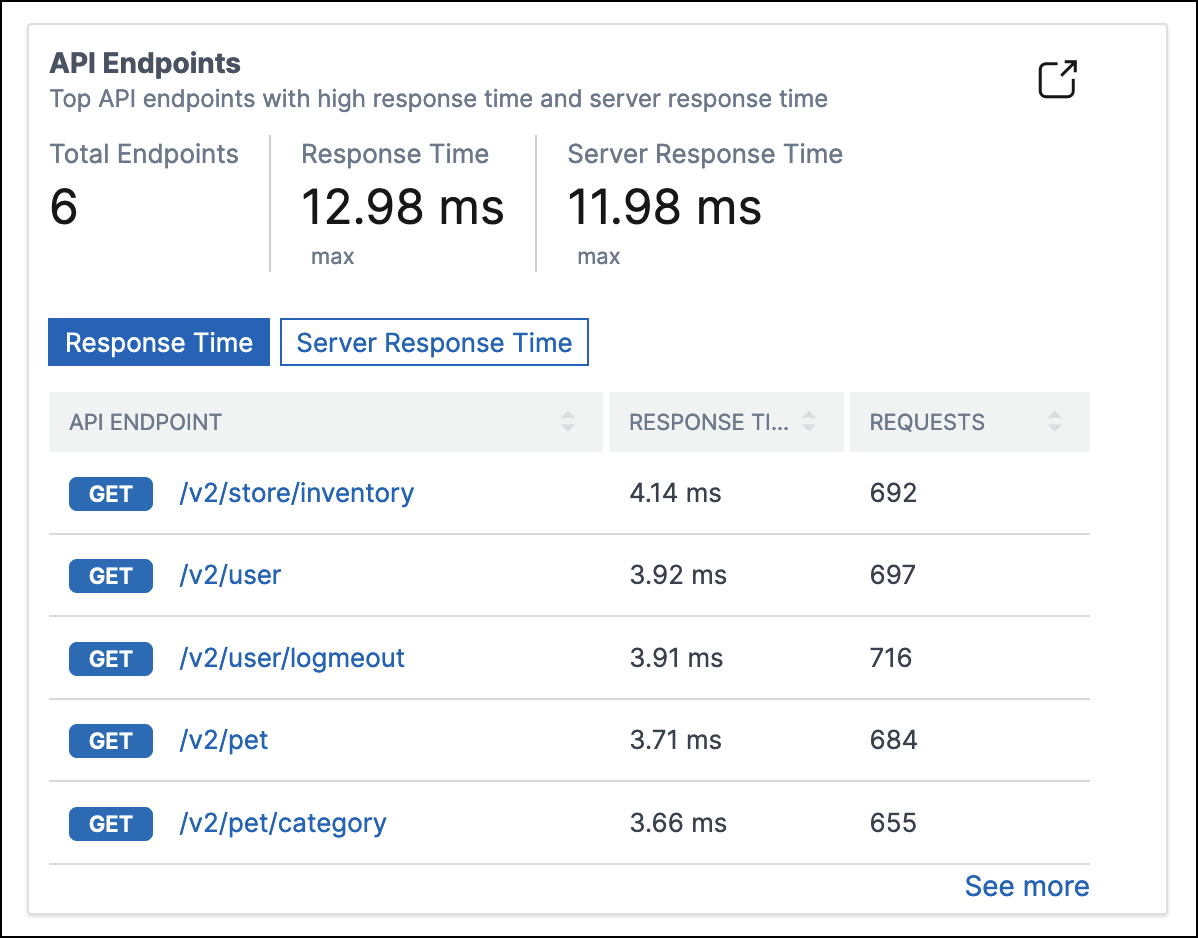
Select an API endpoint to view performance, usage, and security details.
Authentication failures
The Auth Failures tile displays top API endpoints that have more authentication failures. The authentication failure or success happens based on the policy added to an API definition.
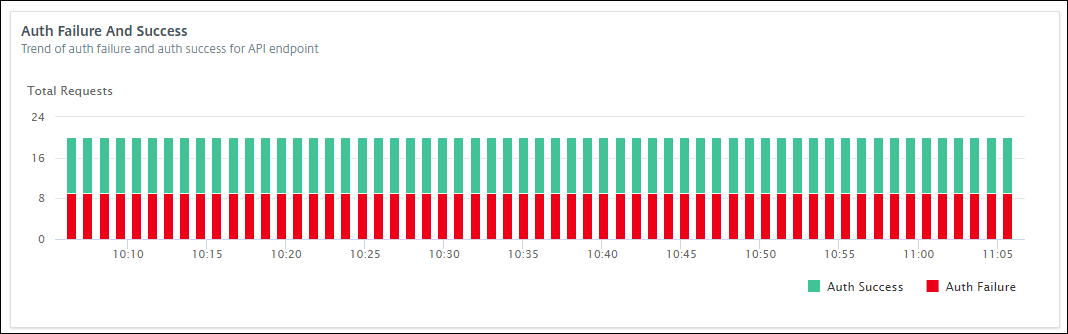
If you want to view authentication failure and success rate in an API endpoint, do the following:
-
Select an endpoint from API Endpoints.
-
Select the Security tab. This tab displays the authentication failures and successes in the selected endpoint.
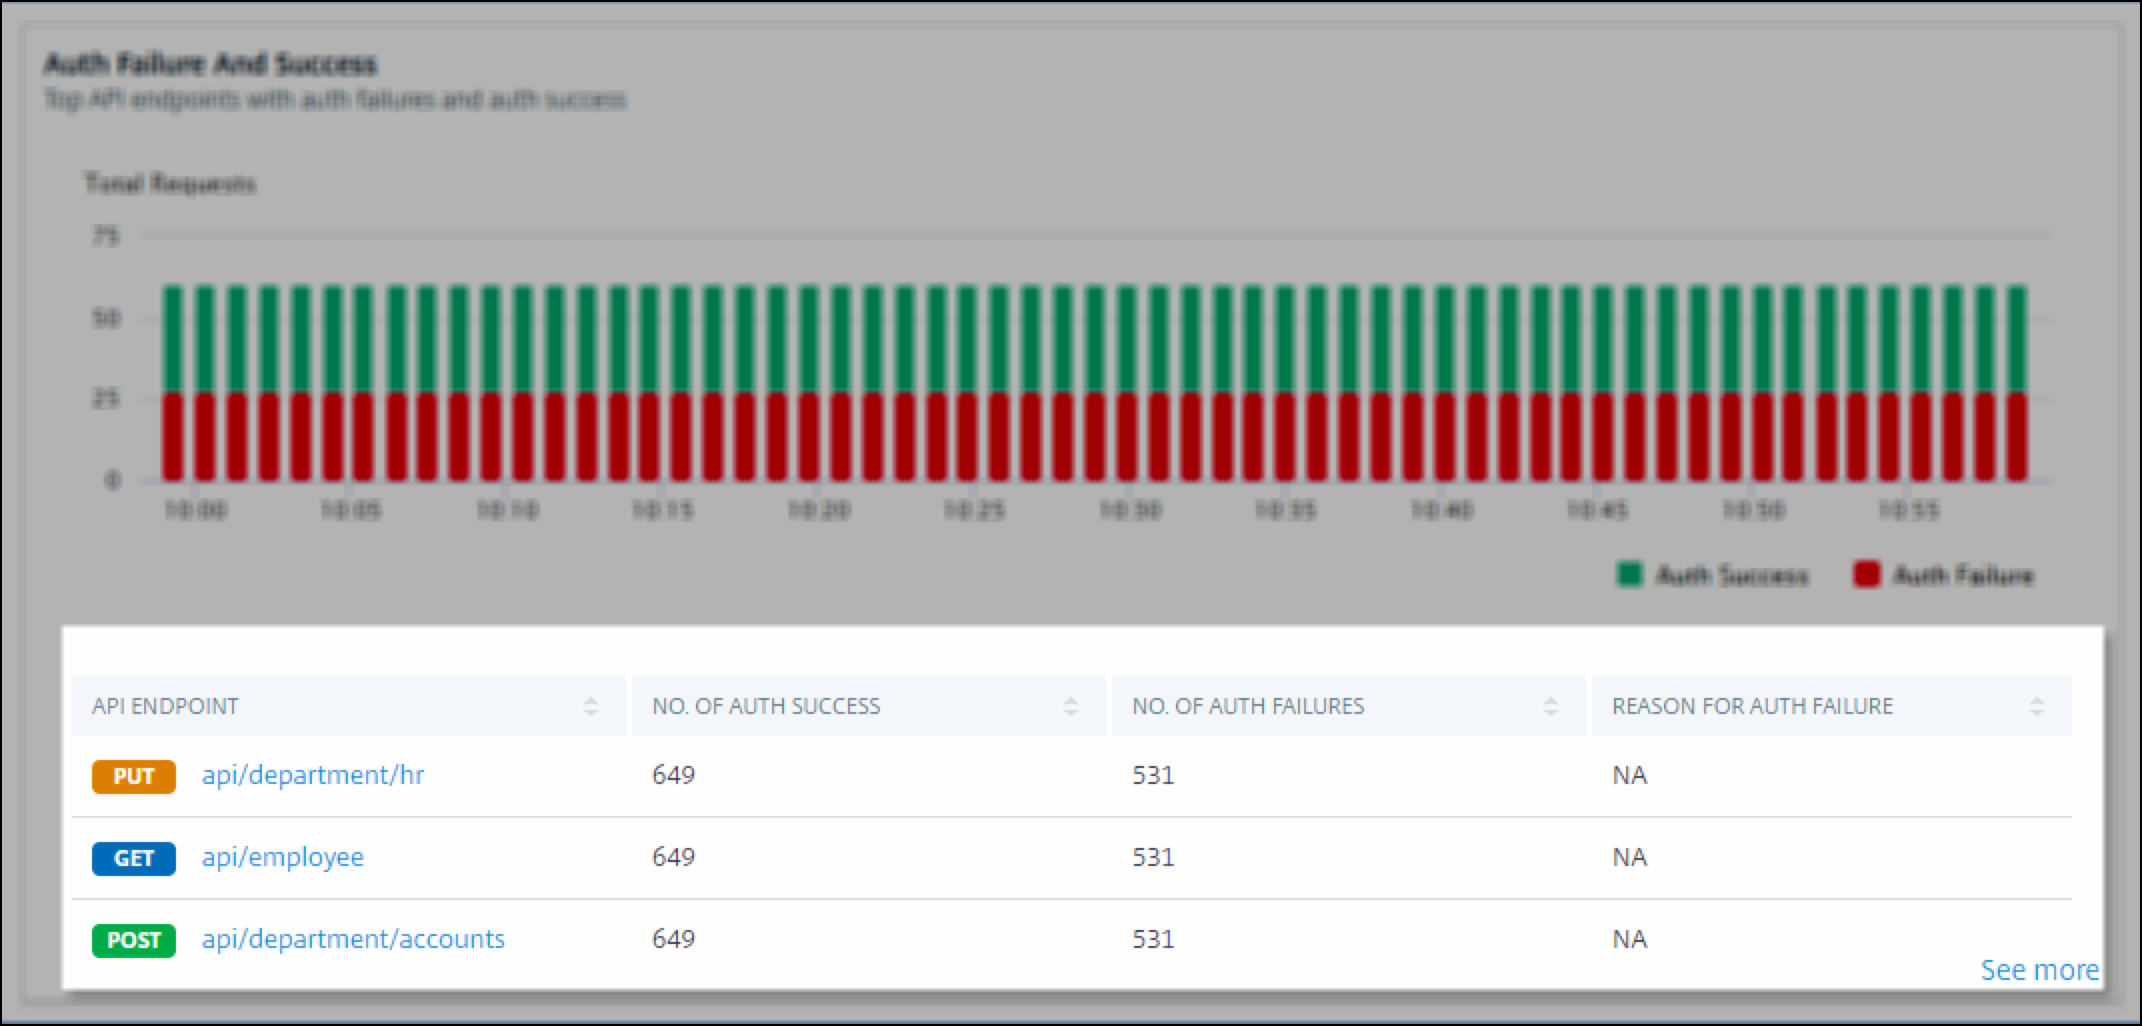
If you want to view the authentication failure and success rate in the API endpoints of an instance, do the following:
-
Select an instance from API Instance.
-
Select the Security tab. This tab displays the authentication failures and successes in the endpoints of the selected instance.
View different API insights
Navigate across API Analytics to view a specific information on the following:
View top API endpoints in an instance
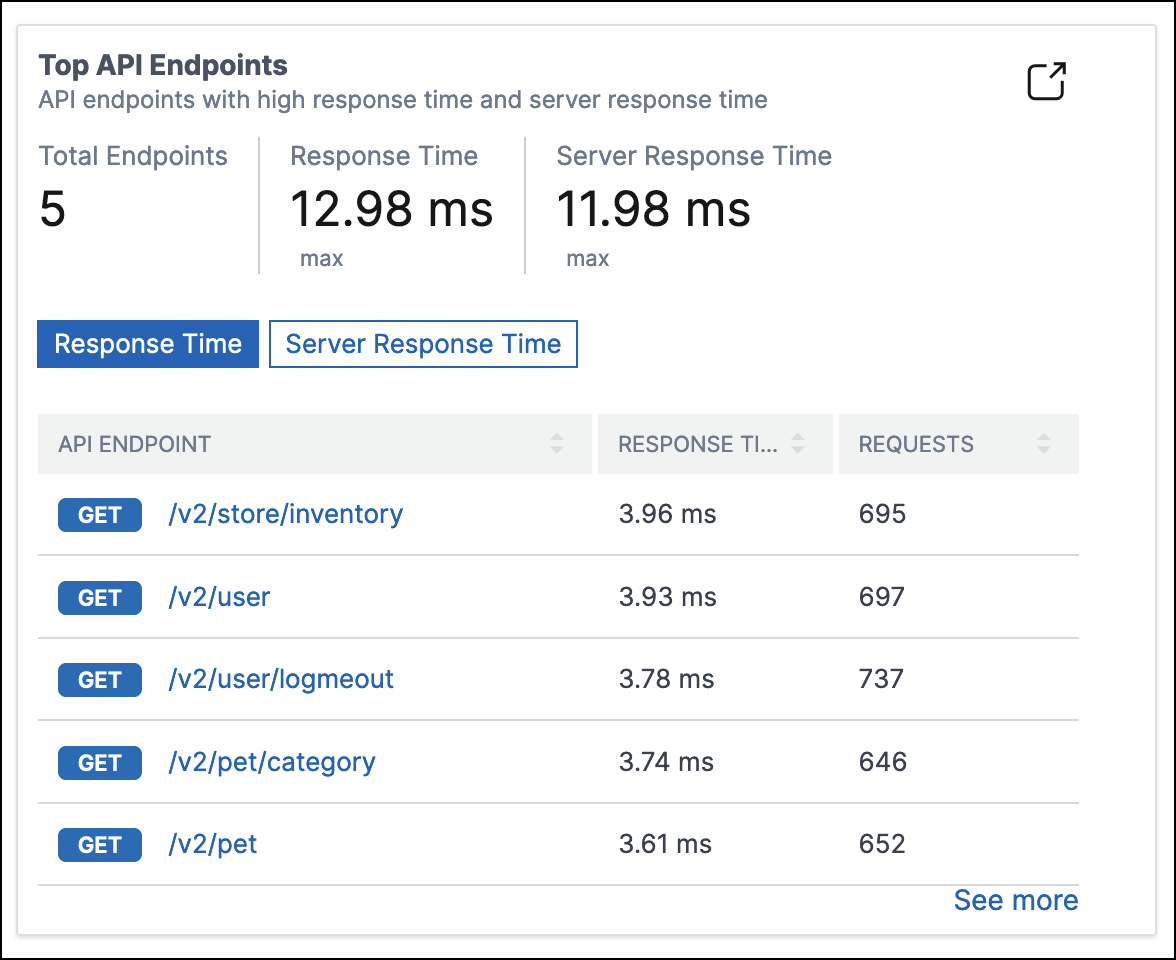
The API Analytics page displays the top endpoints that have high response time. If you want to view similar endpoints of an instance, select an instance from API Instances.
The Top API Endpoints tile displays the endpoints that have high application and server response time.
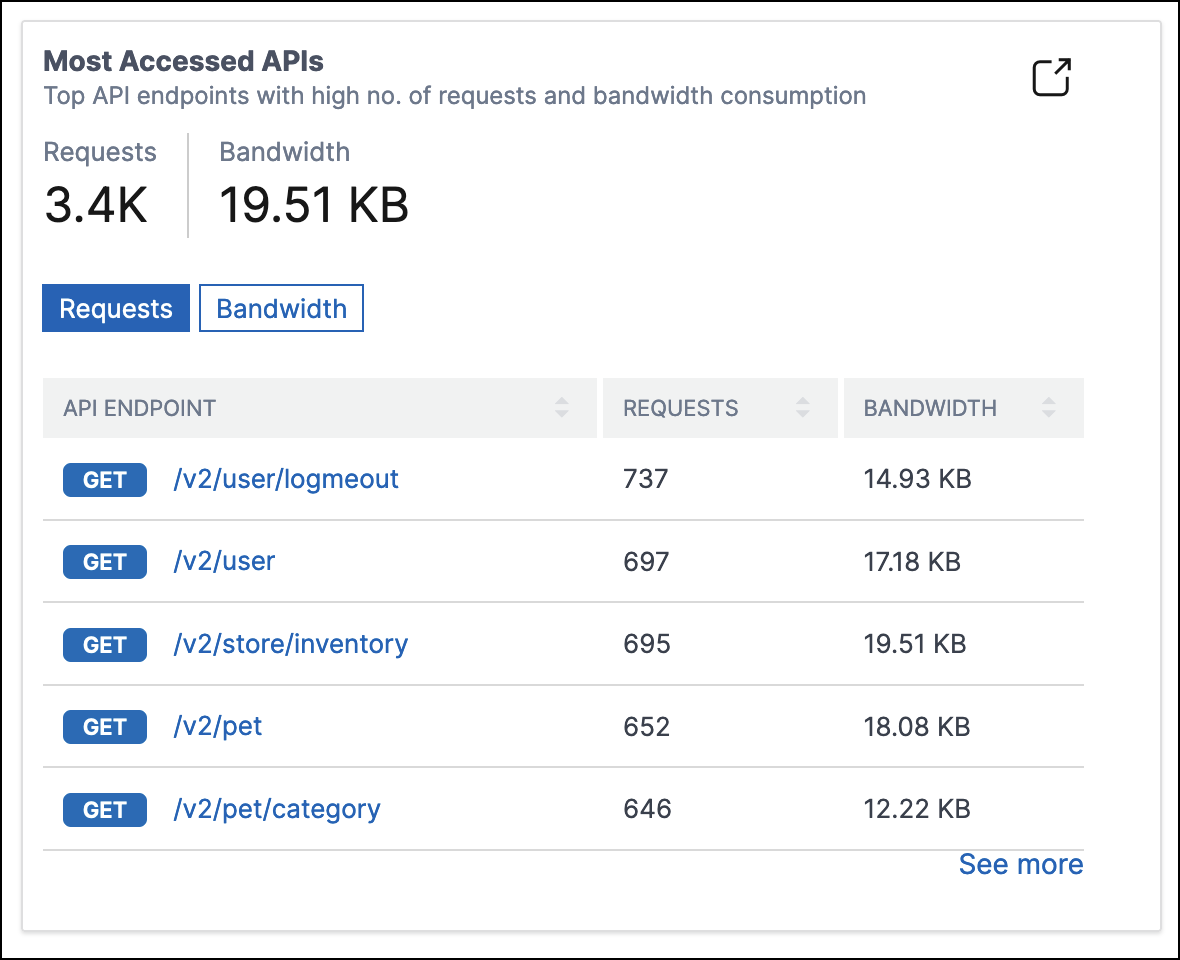
View most accessed APIs
In API Analytics, select an API instance from API instances. The Most Accessed APIs tile displays the top endpoints that have more requests and bandwidth.
View geo-location of an endpoint
-
In API Analytics, select any of the following:
-
Select an instance from API Instances to view the locations from where the endpoints of the selected instance received requests.
-
Select an endpoint from API Endpoints to view locations from where the endpoint received requests.
-
-
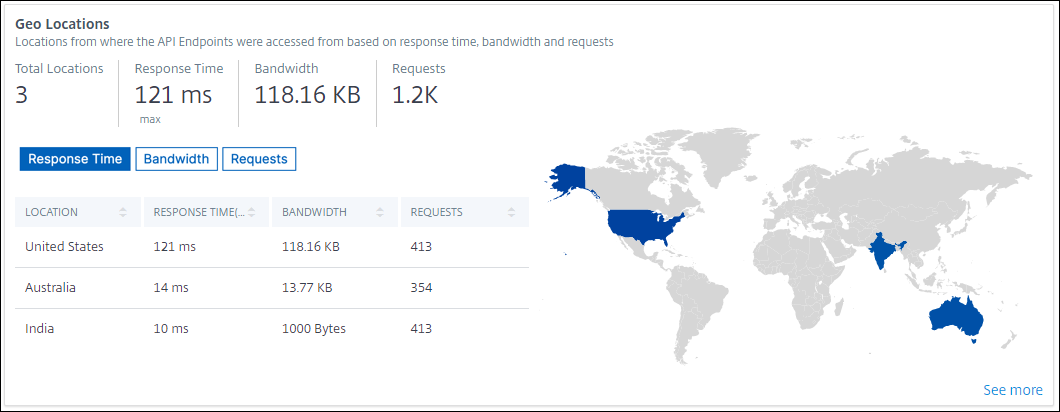
In Performance and Usage, the Geo Locations tile appears.You can sort locations based on response time, bandwidth, and requests.
View HTTPS response status
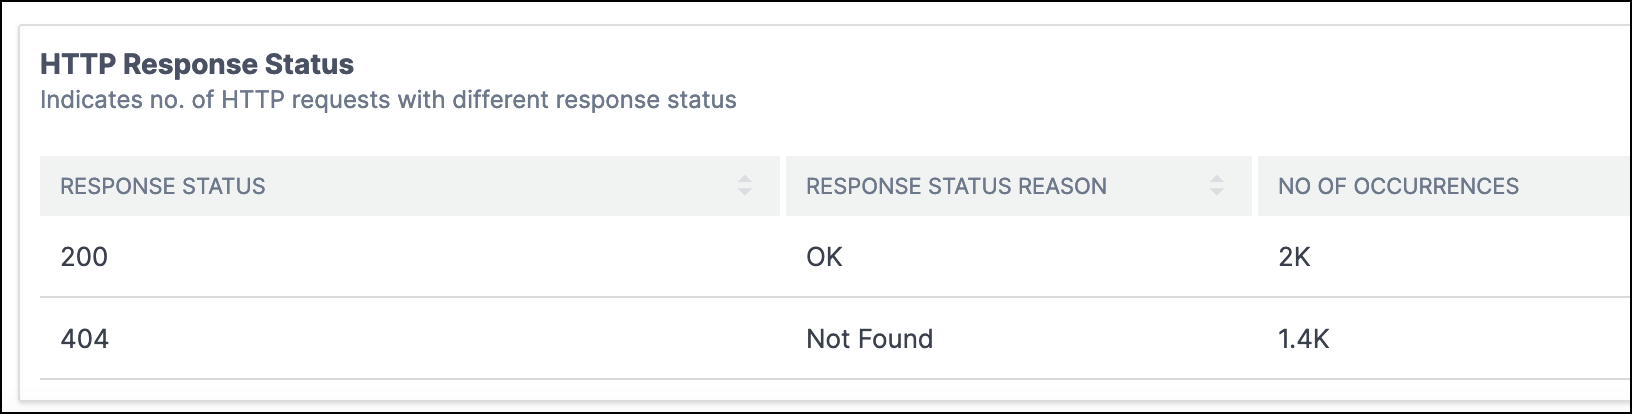
The HTTPS Response Status tile displays the response status with its reasons and occurrences. You can view HTTPS response status in one of the following ways:
-
Select an instance from API Instances.
-
Select an endpoint from API Endpoints.
This tile appears in the Performance and Usage tab.
View API requests trend
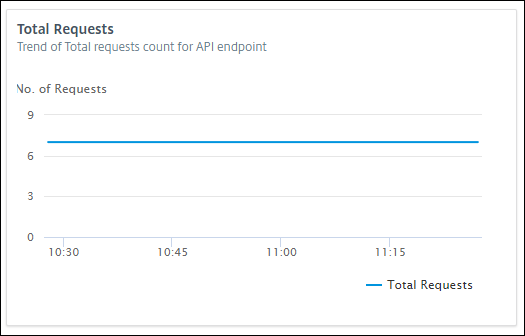
Select an endpoint from API Endpoints. In Performance and Usage, the Total Requests tile displays the trend of total requests count received by an endpoint.
If you want to view the trend of dropped requests because of a rate limit, select an instance from API Instances. In Security, the Rate Limit tile displays the trend of dropped requests. It also displays the trend of total requests received by an endpoint.
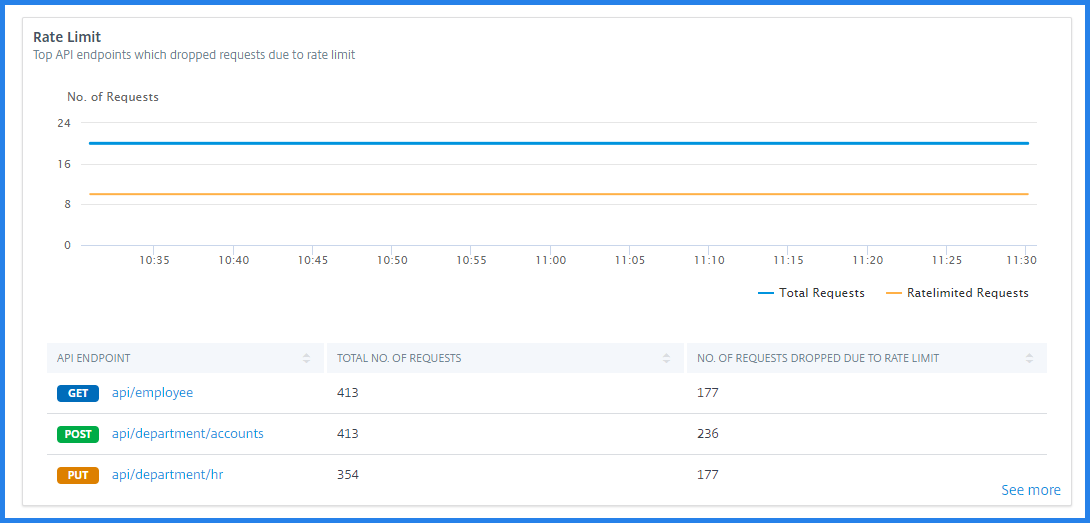
With this comparison, you can determine how many requests are dropped because of a rate limit among total requests.
View bandwidth consumption of an endpoint
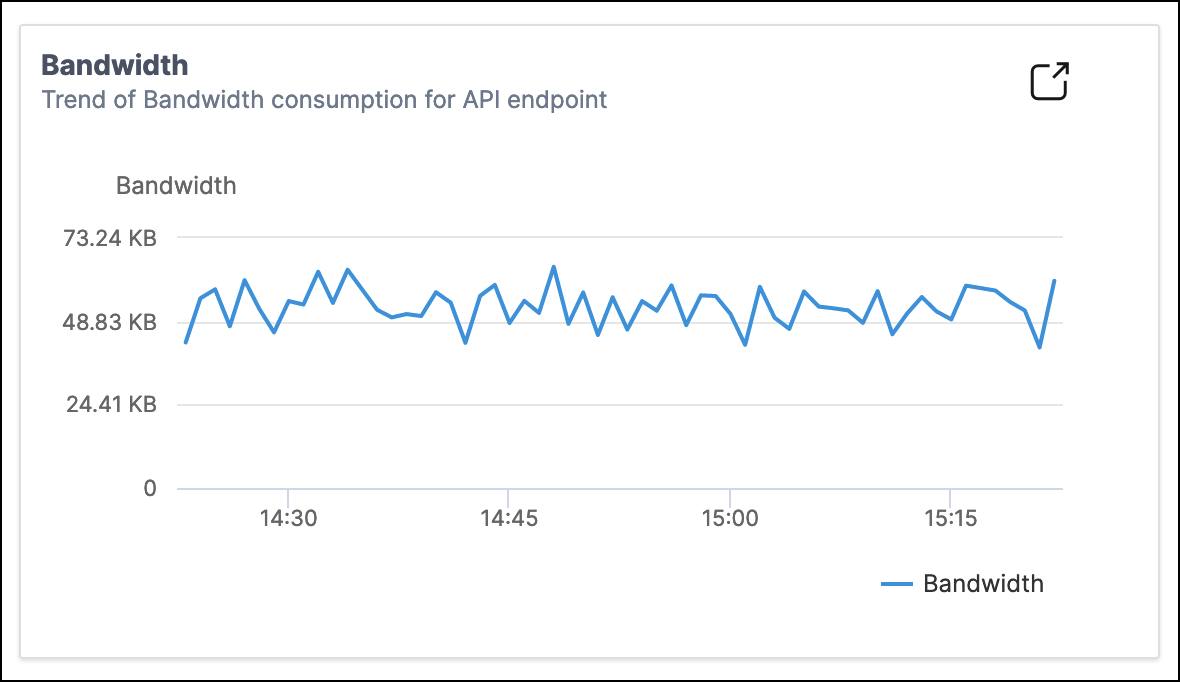
To view the bandwidth consumption trend by an endpoint, select an endpoint from the API endpoints. The Bandwidth tile displays a bandwidth consumption graph.
View SSL errors and usage
Select an instance from API Instances. In Security, the following tiles appear:
-
SSL Errors – Displays SSL failures occurred on clients and applications servers.
-
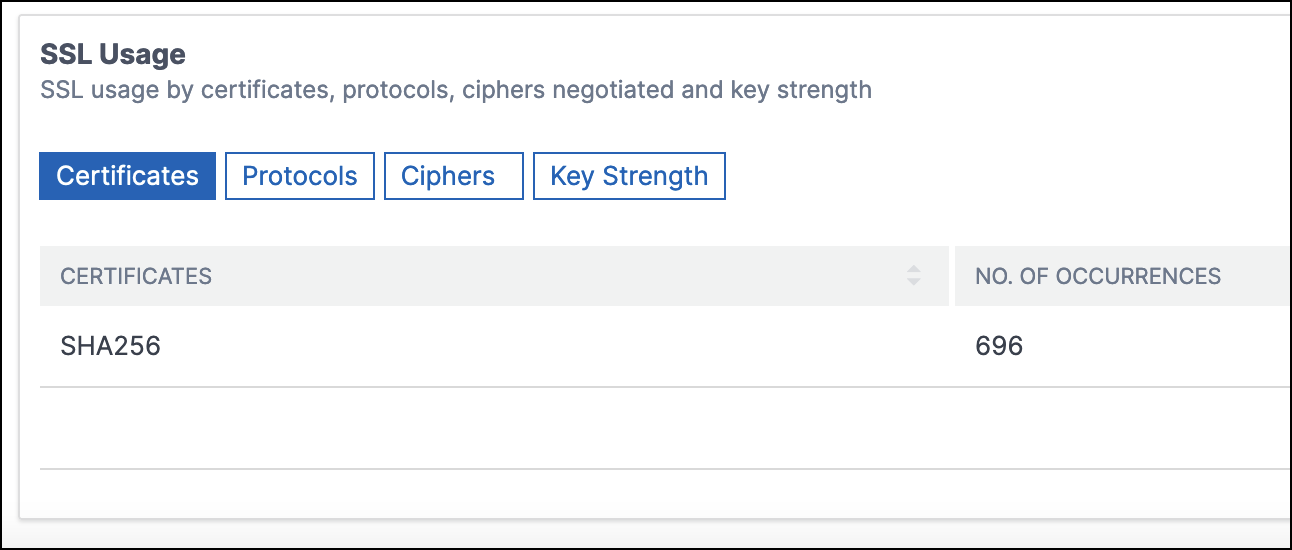
SSL Usage – Displays SSL certificates, protocols, cipher, and key strengths with their occurrences.
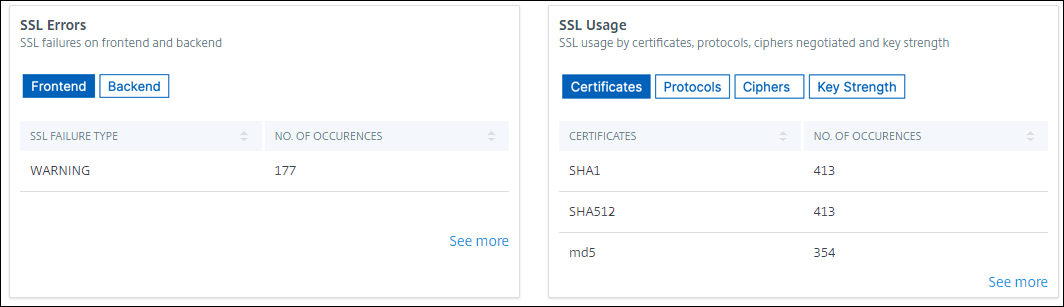
To view the SSL usage in an endpoint, select an endpoint from the API endpoints. The SSL Usage tile appears in the Security tab.