Gateway Insight
In a NetScaler Gateway deployment, visibility into a user access detail is essential for troubleshooting access failure issues. As the network administrator, you want to know when a user is not able to log on to NetScaler Gateway, and you want to know the user activity and the reasons for logon failure, but that information is typically not available unless the user sends a request for resolution.
Gateway Insight provides visibility into the failures encountered by all users, regardless of the access mode, at the time of logging on to NetScaler Gateway. You can view a list of all available users, number of active users, number of active sessions, and bytes and licenses used by all users at any given time. You can view the end-point analysis (EPA), authentication, single sign-on (SSO), and application launch failures for a user. You can also view the details of active and terminated sessions for a user.
Gateway Insight also provides visibility into the reasons for application launch failure for virtual applications. This enhances your ability to troubleshoot any kind of logon or application launch failure issues. You can view the number of applications launched, number of total and active sessions, the number of total bytes and bandwidth consumed by the applications. You can view details of the users, sessions, bandwidth, and launch errors for an application.
You can view the number of gateways, number of active sessions, total bytes, and bandwidth used by all gateways associated with an NetScaler Gateway appliance at any given time. You can view the EPA, authentication, single sign-on, and application launch failures for a gateway. You can also view the details of all users associated with a gateway and their logon activity.
All log messages are stored in the NetScaler Console database, so you can view error details for any time period. You can also view a summary of the logon failures and determine at what stage of the logon process a failure has occurred.
Points to Note:
-
Gateway Insight is supported on the following deployments:
-
Access Gateway
-
Unified Gateway
-
-
The NetScaler Console release and build must be same or later than that of the NetScaler Gateway appliance.
-
One hour of Gateway Insight reports can be viewed for NetScaler instances with Advanced license. A Premium license is required to view Gateway Insight reports beyond one hour.
Limitations:
-
NetScaler Gateway does not support Gateway Insight when the authentication method is configured as certificate-based authentication.
-
Successful user logons, latency, and application-level details for virtual ICA applications and desktops are visible only on the HDX™ Insight Users dashboard.
-
In a double-hop mode, visibility into failures on the NetScaler Gateway appliance in the second DMZ is not available.
-
Remote Desktop Protocol (RDP) desktop access issues are not reported.
-
The Gateway Insight records for the SAML authentication are not reported.
-
Gateway Insight is supported for the following authentication types. If other authentication type is used other than these, you might see some discrepancies in Gateway Insight.
-
Local
-
LDAP
-
RADIUS
-
TACACS
-
SAML
-
Native OTP
-
OAuth
-
Related information
Enable Gateway Insight
To enable Gateway Insight for your NetScaler Gateway appliance, you must first add the NetScaler Gateway appliance to NetScaler Console. You must then enable AppFlow for the virtual server representing the VPN application. For information about adding device to NetScaler Console, see Adding Instances.
Note
To view end-point analysis (EPA) failures in NetScaler Console, you must enable AppFlow authentication, authorization, and access control user name logging on the NetScaler Gateway appliance.
Enable AppFlow for a virtual server in NetScaler Console
-
Navigate to Settings > Licensing & Analytics Configuration.
-
Under Virtual Server Analytics Summary, click Configure Analytics.
-
In the All Virtual Servers page, select the NetScaler Gateway virtual server, and click Enable Security & Analytics.
-
Select Gateway Insight.
-
Click Save.
Enable AppFlow user name logging on an NetScaler Gateway appliance by using the GUI
-
Navigate to Configuration > System > AppFlow® > Settings, and then click Change AppFlow Settings.
-
In the Configure AppFlow Settings screen, select AAA Username, and then click OK.
View Gateway Insight reports
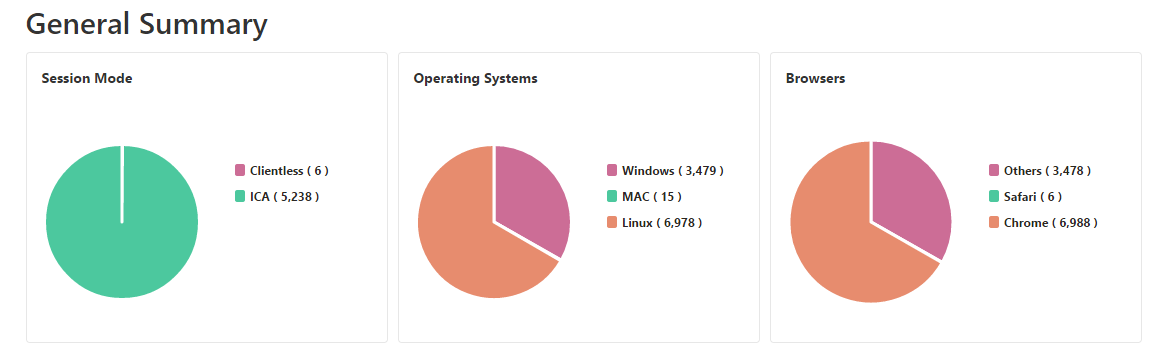
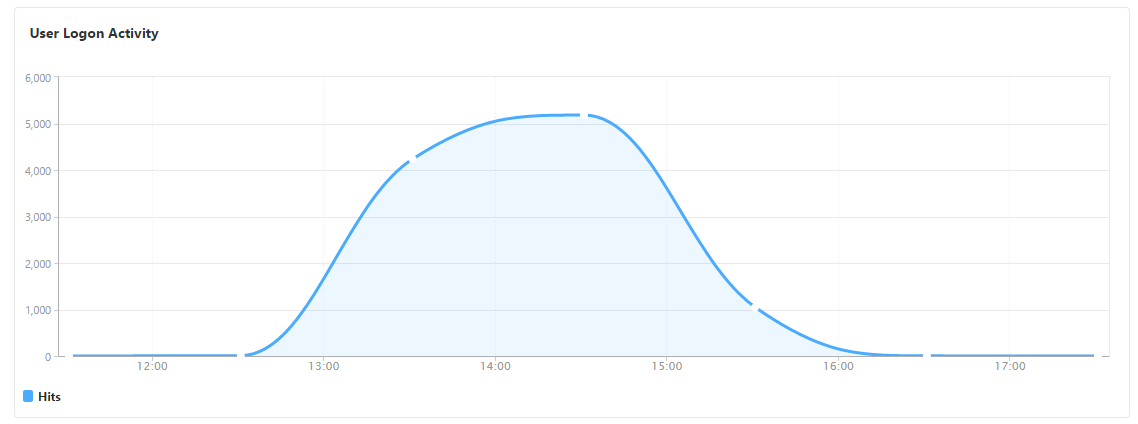
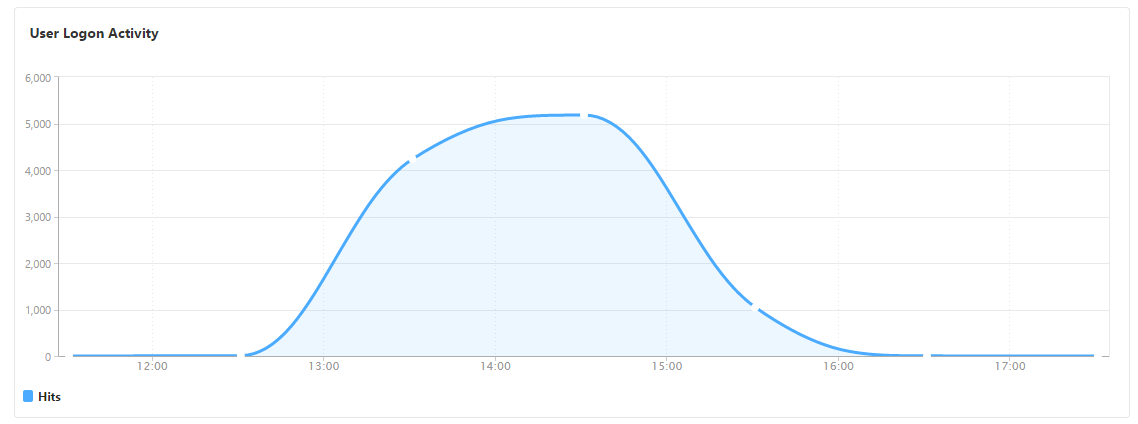
In NetScaler Console, you can view reports for all users, applications, and gateways associated with the NetScaler Gateway appliances, and you can view details for a particular user, application, or gateway. In the Overview section, you can view the EPA, SSO, Authentication, and Application Launch failures. You can also view a summary of the different session modes used by users to log on, the types of clients, and the number of users logged on every hour.
Note:
When you create a group, you can assign roles to the group, provide application-level access to the group, and assign users to the group. NetScaler Console analytics now supports virtual IP address-based authorization. Your users can now see reports for all Insights for only the applications (virtual servers) that they are authorized to. For more information on groups and assigning users to the group, see Configure Groups on NetScaler Console.
View EPA, SSO, authentication, authorization, and application launch failures
-
In NetScaler Console, navigate to Gateway > Gateway Insight.
-
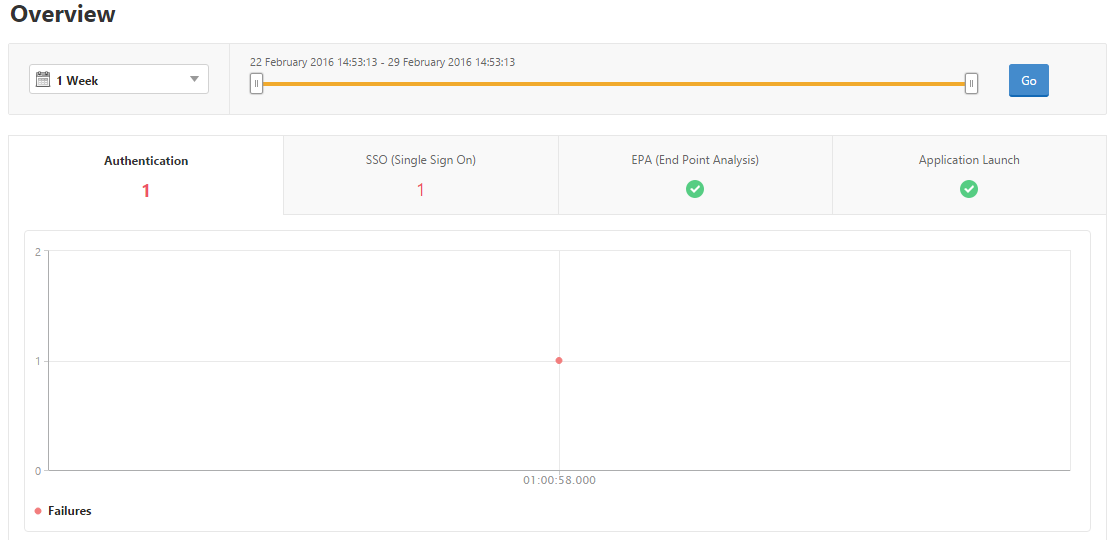
Select the time period for which you want to view the user details. You can use the time slider to further customize the selected period. Click Go.
-
Click the EPA (End Point Analysis), Authentication, Authorization, SSO (Single Sign On), or Application Launch tabs to display the failure details.
View summary of session modes, clients, and the number of users
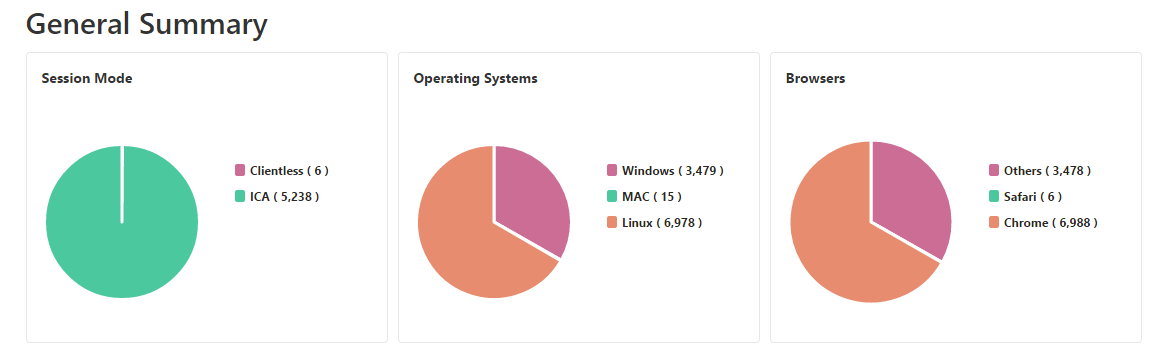
In NetScaler Console, navigate to Gateway > Gateway Insight, scroll down to view the reports.
Users
You can view a complete report for the users associated with the NetScaler Gateway appliances. You can view the EPA, authentication, SSO, application launch failures, and so on for a user.
You can also visualize a consolidated view of all users active and terminated sessions.
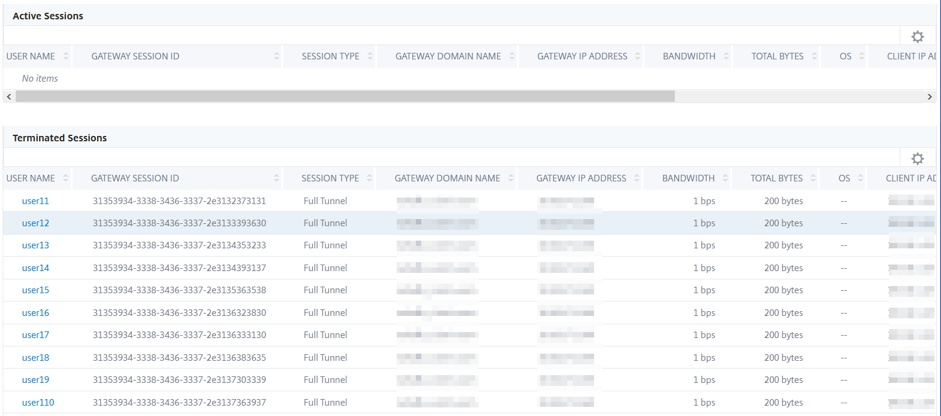
As an administrator, this view enables you to:
-
View all users details in a single-pane visualization
-
Eliminate the complexity in selecting each user and seeing the active and terminated sessions
View user details
-
In NetScaler Console, navigate to Gateway > Gateway Insight > Users.
-
Select the time period for which you want to view the user details. You can use the time slider to further customize the selected period. Click Go.
-
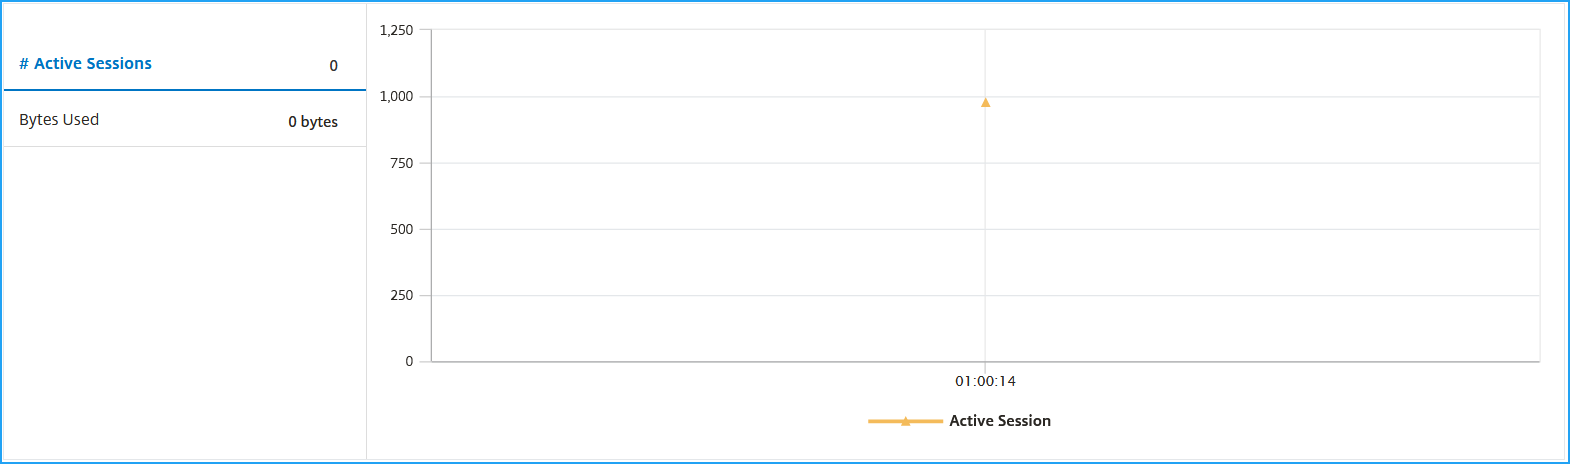
You can view the number of active users, number of active sessions, and bytes by all users during the time period.
Scroll down to view a list of available users and active users.
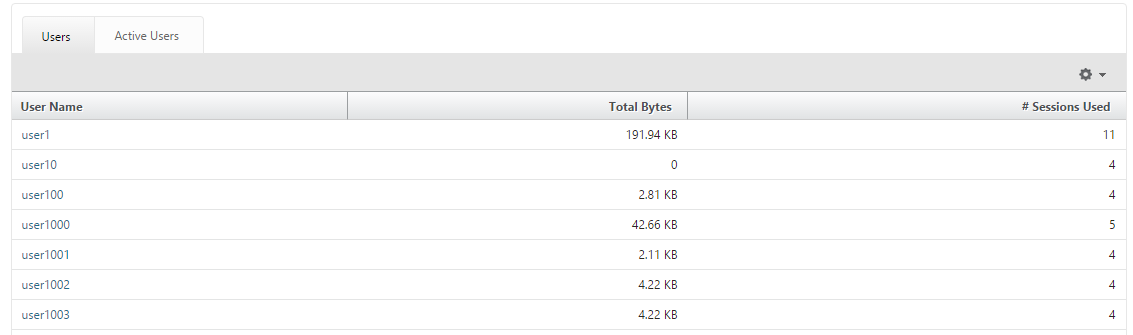
On the Users or Active Users tab, click a user to view the following user details:
-
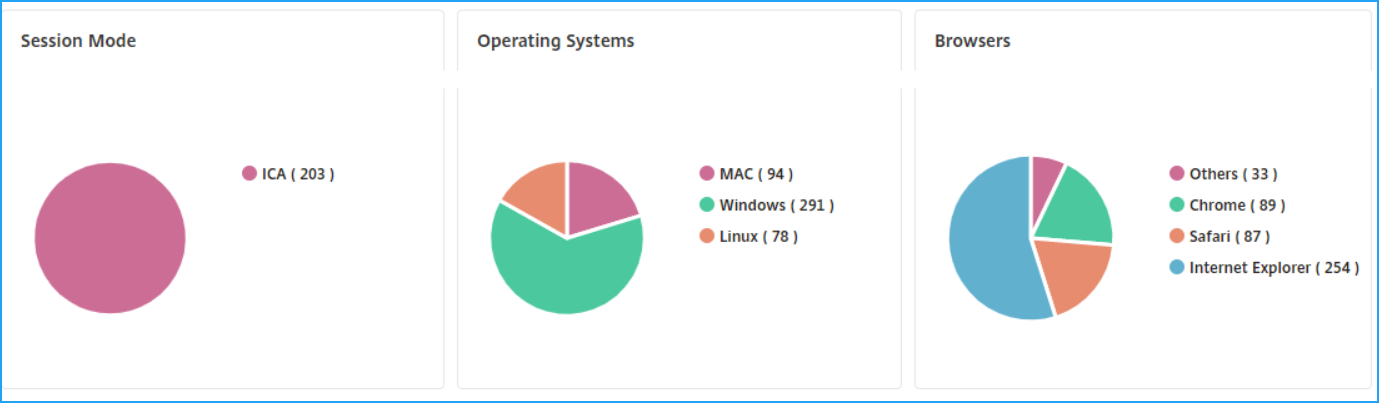
User details - You can view insights for each user associated with the NetScaler Gateway appliances. Navigate to Gateway > Gateway Insight > Users and click a user to view insights for the selected user such as Session Mode, Operating System, and Browsers.
-
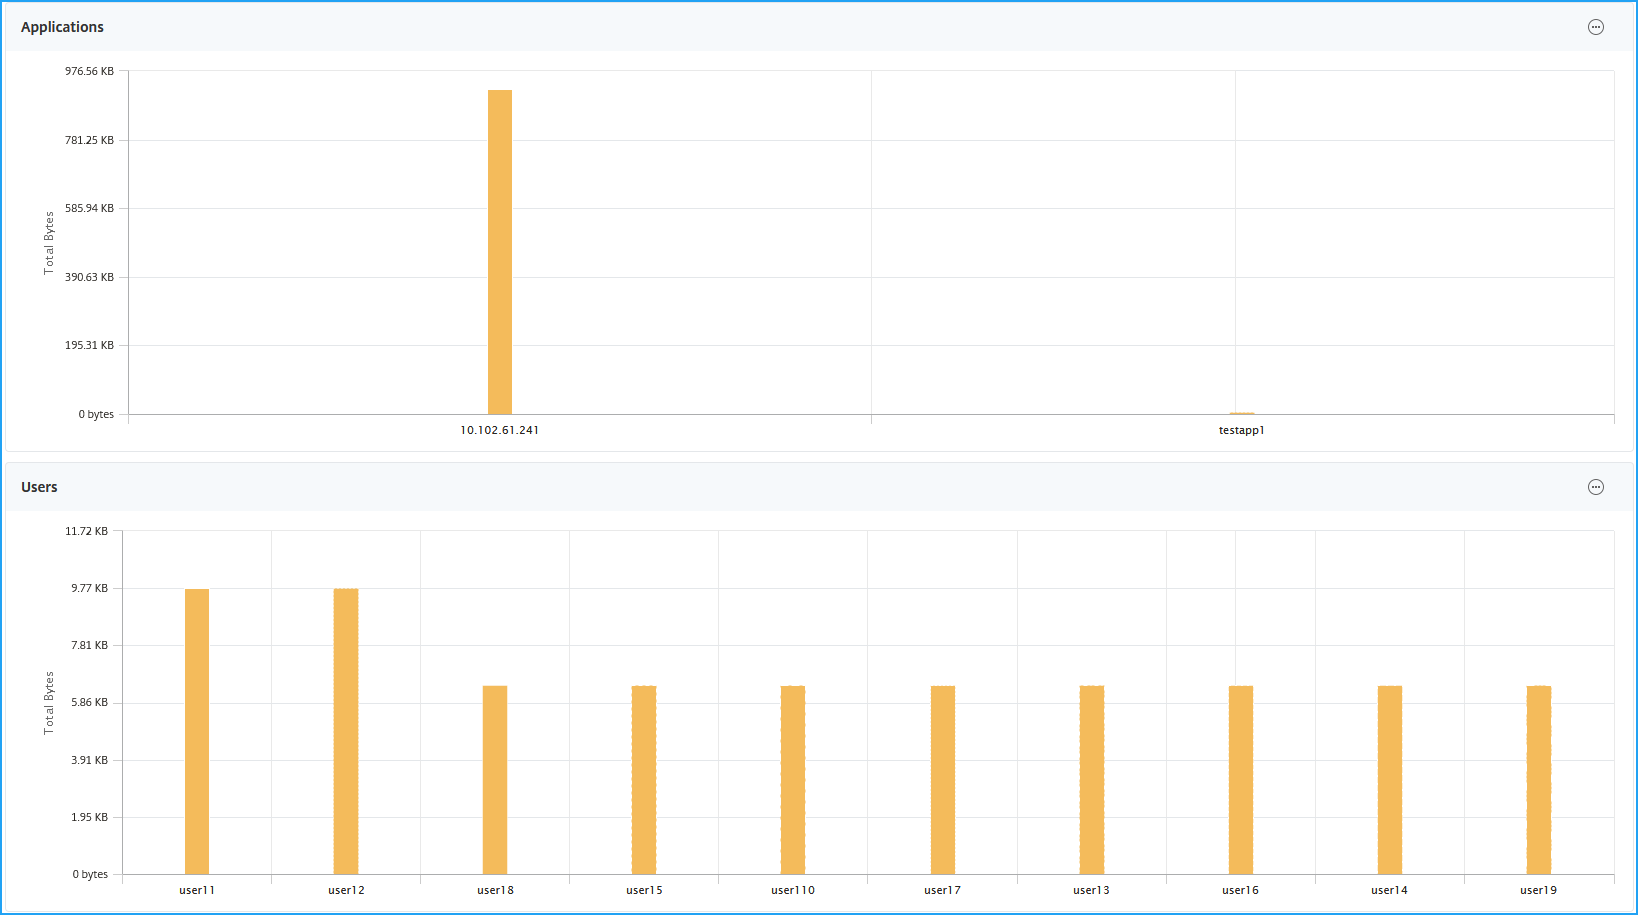
Users and applications for the selected gateway - Navigate to Gateway > Gateway Insight > Gateway and click a gateway domain name to view the top 10 applications and top 10 users that are associated with the selected gateway.
-
View more option for applications and users – For more than 10 applications and users, you can click the more icon in Applications and Users to view all users and applications details that are associated with the selected gateway.
-
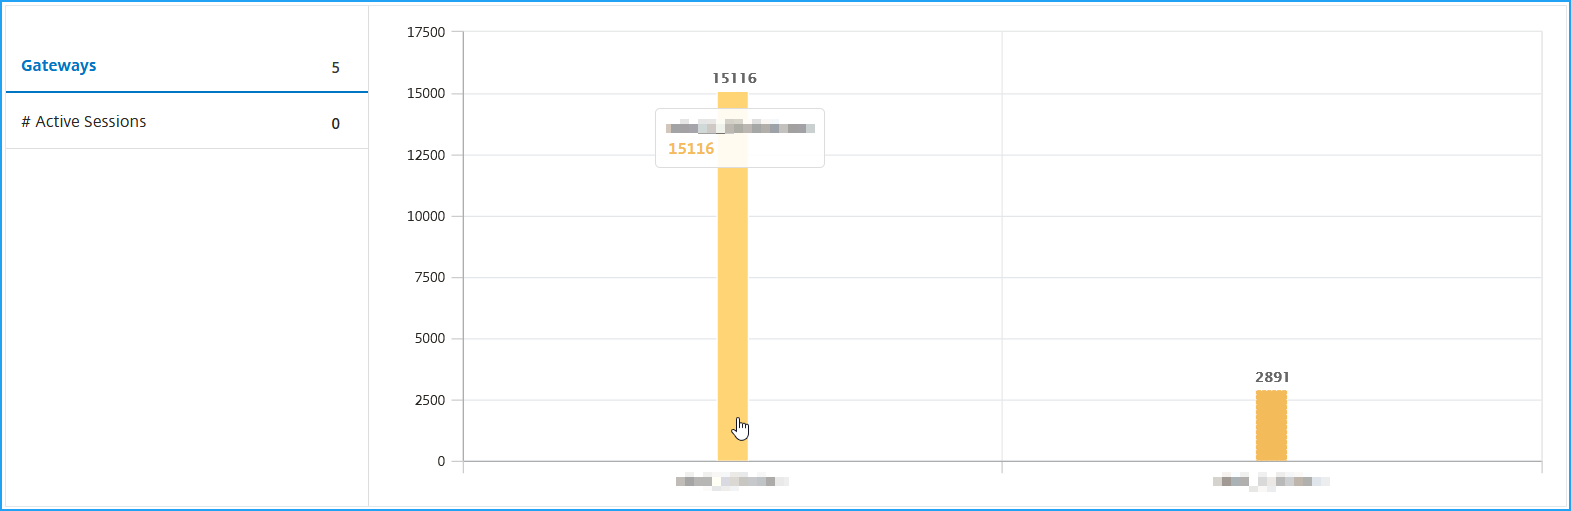
View details by clicking the bar graph – When you click a bar graph, you can view the relevant details. For example, navigate to Gateway > Gateway Insight > Gateway and click the gateway bar graph to view the gateway details.
-
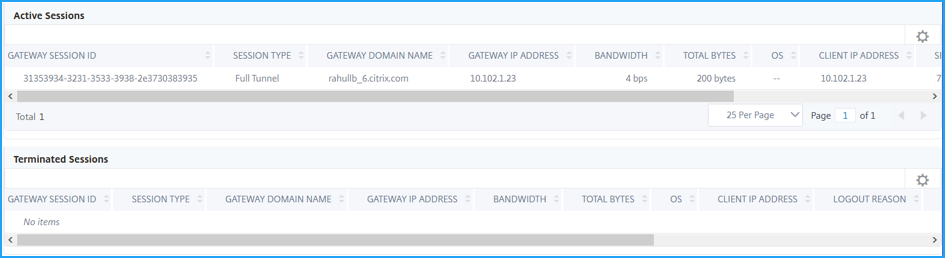
The user Active Sessions and Terminated Sessions.
-
The gateway domain name and gateway IP address in Active Sessions.

-
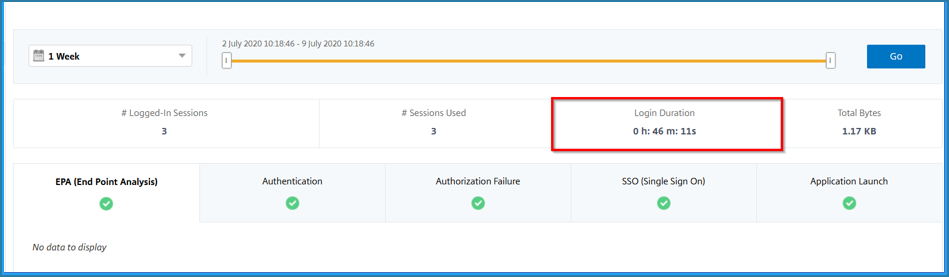
The user login duration.
-
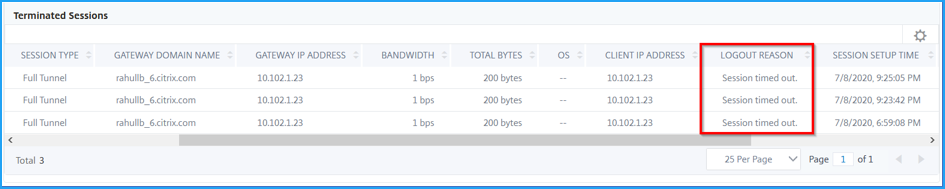
The reason for the user logout session. The logout reasons can be:
-
Session timed out
-
Logged out because of internal error
-
Logged out because of inactive session timed out
-
User has logged out
-
Administrator has stopped the session
-
Search bar and Geo map view
You can view:
-
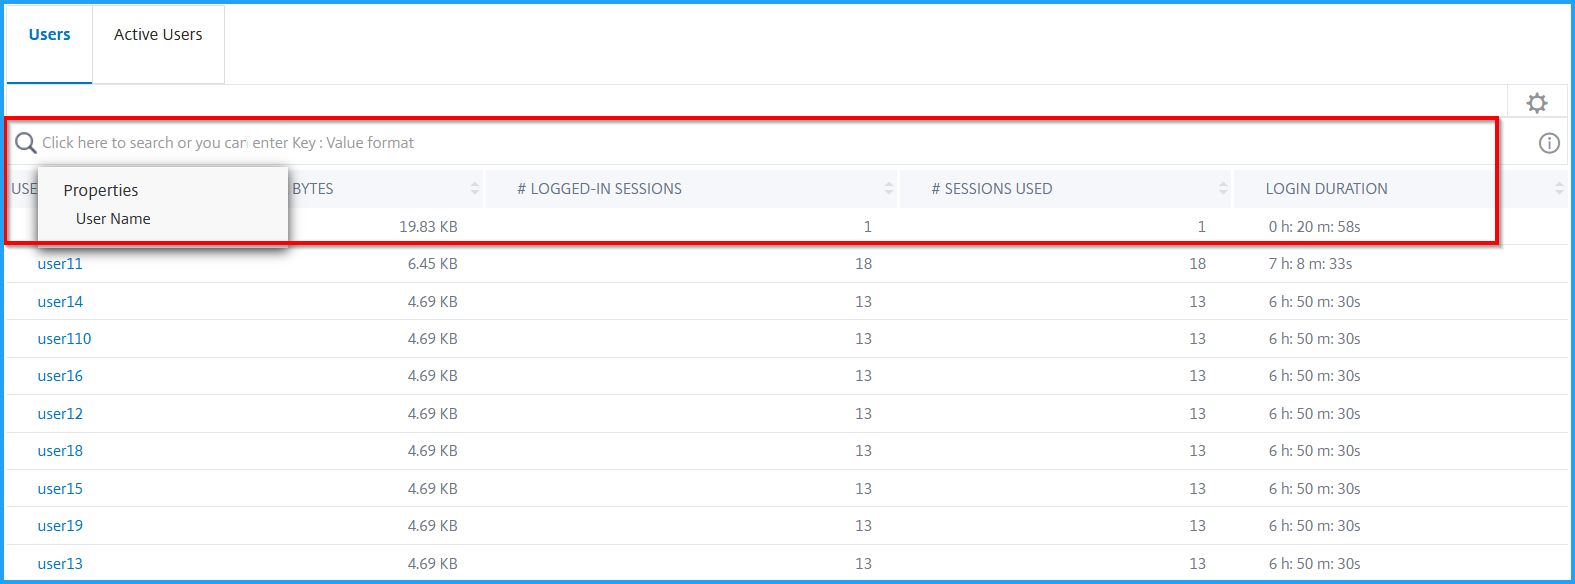
A search bar that enables you to filter results based on the user name. Navigate to Gateway > Gateway Insight > Users to view the search bar for Users and Active Users. Place the mouse pointer on the search bar, select User Name, and type a user name to filter results.
-
A geo map that displays the users information based on the users geographical location. As an administrator, this geo map enables you to view the summary of total users, total apps, and total sessions for a specific location.
-
Navigate to Gateway > Gateway Insight to view the geo map
-
Click a country. For example, United StatesThe geo map displays the details such as users list, active sessions, terminated sessions, applications for the selected country.
-
Applications
You can view the number of applications launched, number of total and active sessions, the number of total bytes and bandwidth consumed by the applications. You can view details of the users, sessions, bandwidth, and launch errors for an application.
View application details
-
In NetScaler Console, navigate to Gateway > Gateway Insight > Applications.
-
Select the time period for which you want to view the application details. You can use the time slider to further customize the selected time period. Click Go.
You can now view the number of applications launched, number of total and active sessions, the number of total bytes and bandwidth consumed by the applications.
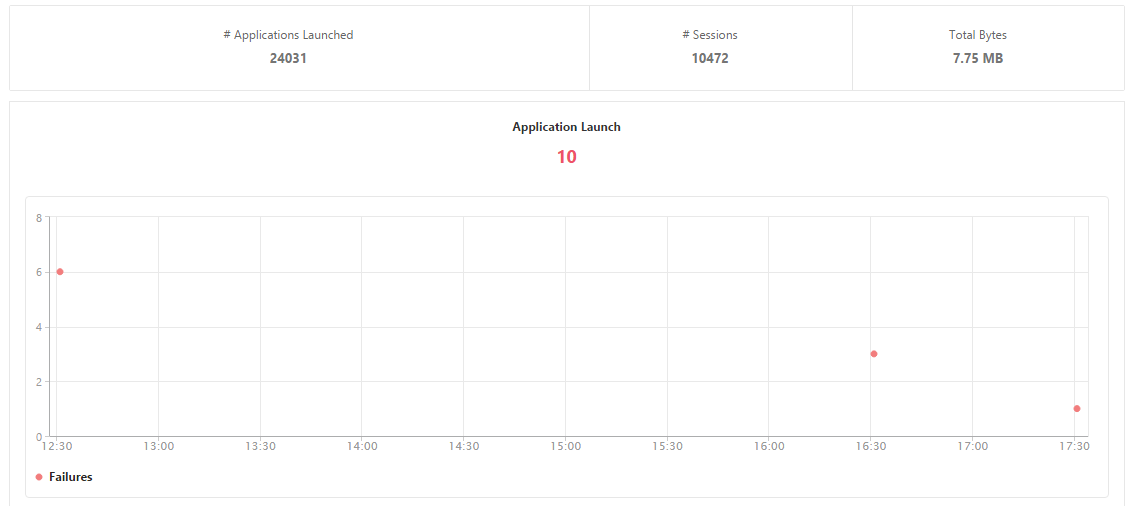
Scroll down to view the numbers of sessions, bandwidth, and total bytes consumed by ICA® and other applications.
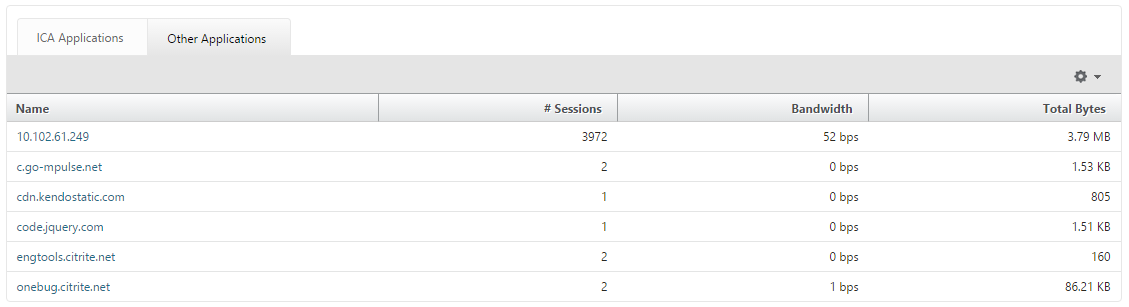
On the Other Applications tab, you can click an application in the Name column to display details of that application.
Gateways
You can view the number of gateways, number of active sessions, total bytes and bandwidth used by all gateways associated with a NetScaler Gateway appliance at any given time. You can view the EPA, authentication, single sign-on, and application launch failures for a gateway. You can also view the details of all users associated with a gateway and their logon activity.
View gateway details
-
In NetScaler Console, navigate to Gateway > Gateway Insight > Gateways.
-
Select the time period for which you want to view the gateway details. You can use the time slider to further customize the selected time period. Click Go.
You can now view the number of gateways, number of active sessions, total bytes and bandwidth used by all gateways associated with a NetScaler Gateway appliance at any given time.
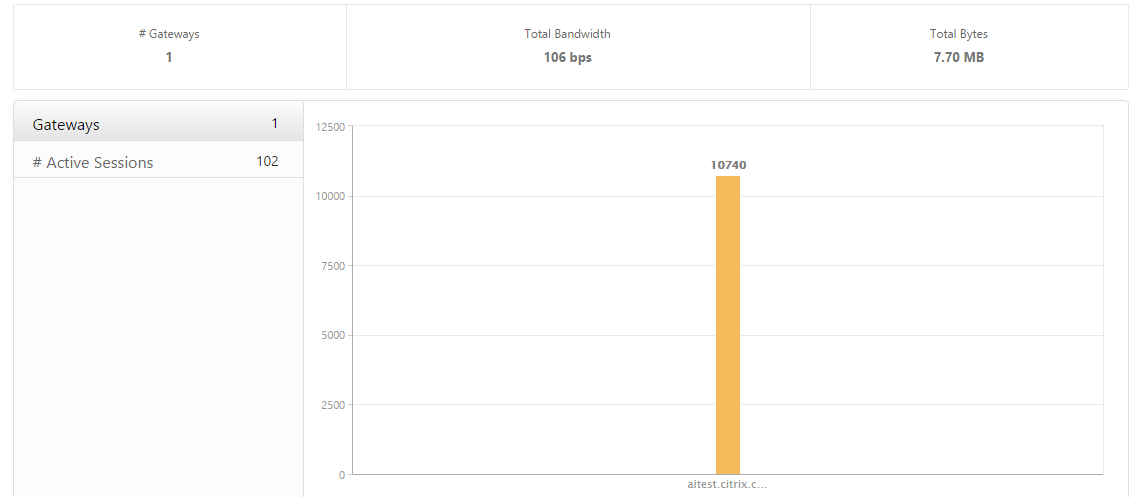
Scroll down to view the gateway details such as Gateway Domain Name, Virtual Server Name, NetScaler IP address, session modes, and Total Bytes.
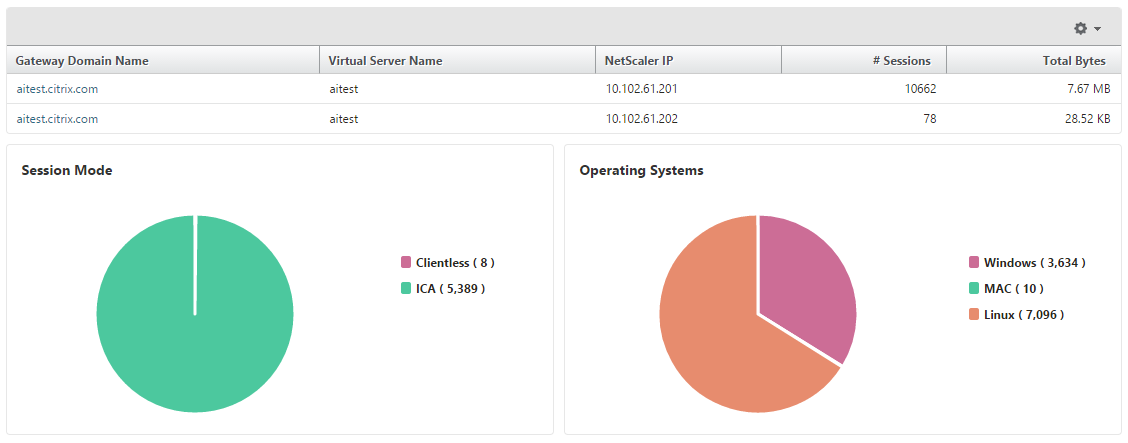
You can click a gateway in the Gateway Domain Name column to display the EPA, authentication, single sign-on, and application launch failures and other details for a gateway.
You can also view a geo map for gateways that enables you to filter users based on a particular location.
-
Navigate to Gateway > Gateway Insight > Gateways
-
Select a gateway domain name to view the geo map
-
Click a country. For example, United StatesThe geo map displays the details such as users list, active sessions, terminated sessions, applications for the selected country.
Exporting reports
You can save the Gateway Insight reports with all the details shown in the GUI in PDF, JPEG, PNG, or CSV format on your local computer. You can also schedule the export of the reports to specified email addresses at various intervals.
Note
-
Users with read only access cannot export reports.
-
Geo map reports are exported only if the NetScaler Console has internet connectivity.
Export a report
-
On the Dashboard tab, in the right pane, click the export button.
-
Under Export Now, select the required format, and then click Export.
To schedule export:
-
On the Dashboard tab, in the right pane, click the export button.
-
Under Schedule Export, specify the details and click Schedule.
Note
Configure the email server settings before scheduling the report by navigating to System > Notifications > Email and by clicking Add.
To add an email server or an email distribution list:
-
On the Configuration tab, navigate to System > Notifications > Email.
-
In the right pane, select Email Server, to add an email server or select Email Distribution list to create an email distribution list.
-
Specify the details and click Create.
To export the entire Gateway Insight dashboard:
-
On the Dashboard tab, in the right pane, click the export button.
-
Under Export Now, select PDF format, and then click Export.
Gateway Insight Use Cases
The following use cases show how you can use Gateway Insight to gain visibility into users' access details, applications, and gateways on NetScaler Gateway appliances.
1. User is not able to log on to the NetScaler Gateway appliance or to the internal web servers
You are a NetScaler Gateway administrator monitoring NetScaler Gateway appliances through NetScaler Console, and you want to see why a user is unable to log in, or at what stage of the login process the failure has occurred.
NetScaler Console enables you to view the user login error details in the following stages of the login process:
-
Authentication
-
End-point analysis (EPA)
-
Single sign-on
In NetScaler Console, you can search for a particular user and then view all the details for that user.
To search for a user:
In NetScaler Console, navigate to Gateway > Gateway Insight and, in the Search for Users text box, specify the user you want to search.
Authentication Failures
You can view authentication errors such as incorrect credentials or no response from the authentication server. If you have set up two-stage authentication, you can see whether the primary, secondary, or both stages of the authentication have failed.
View the authentication failure details
-
In NetScaler Console, navigate to Gateway > Gateway Insight.
-
In the Overview section, select the time period for which you want to view the authentication errors. You can use the time slider to further customize the selected time period. Click Go.
-
Click the Authentication tab. You can view the number of authentication errors at any given time in the Failures graph.
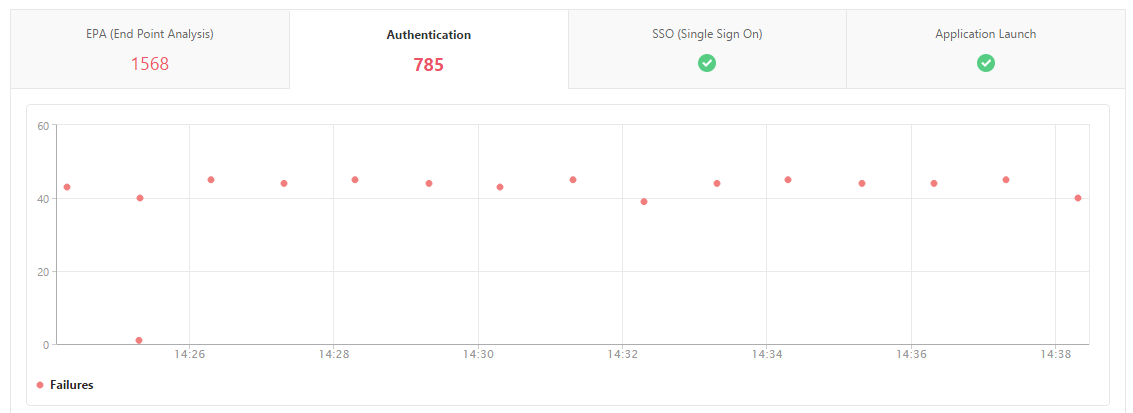
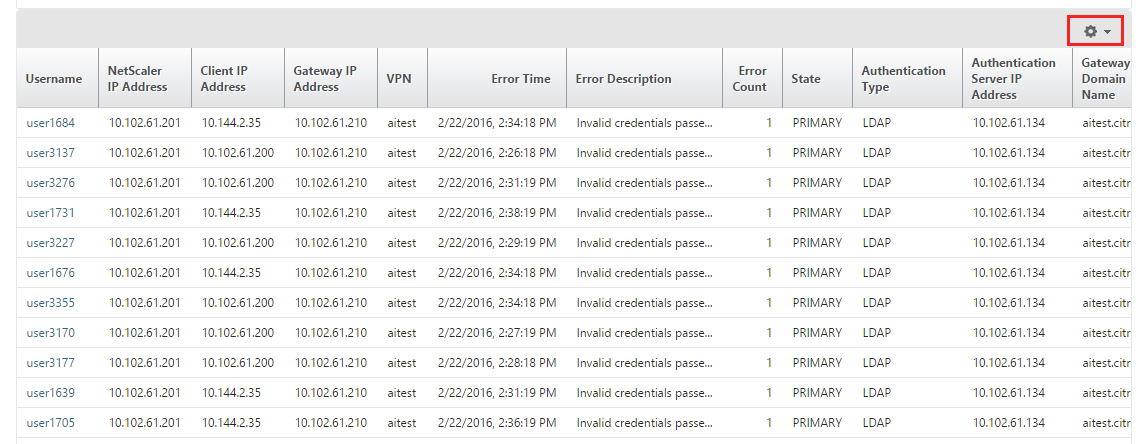
Scroll down to view details of each authentication error such as Username, Client IP Address, Error Time, Authentication type, Authentication Server IP Address, and more from the table on the same tab. The Error Description column in the table displays the reason for the logon failure, and the State column displays at what stage of a two-stage authentication the failure occurred.
You can click a user in the Username column to display the authentication errors and other details for that user.
You can customize the table to add or delete columns by using the settings option.
EPA Failures
You can view EPA failures at pre- or post-authentication stage.
View EPA failure details
-
In NetScaler Console, navigate to Gateway > Gateway Insight.
-
In the Overview section, select the time period for which you want to view the EPA errors. You can use the time slider to further customize the selected time period. Click Go.
-
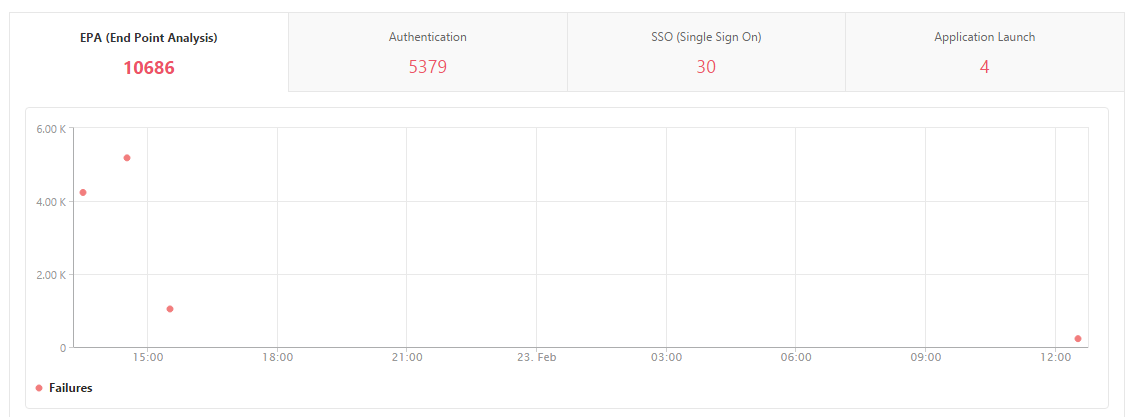
Click the EPA (End Point Analysis) tab. You can view the number of EPA errors at any given time in the Failures graph.
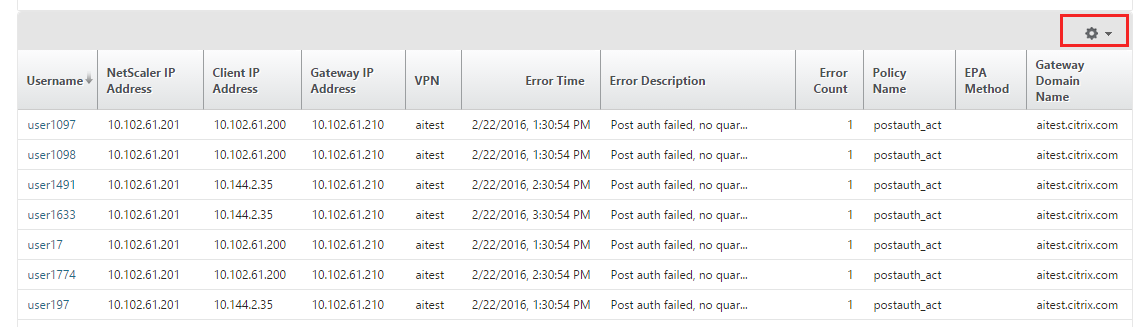
Scroll down to view details of each EPA error such as Username, NetScaler IP Address, Gateway IP Address, VPN, Error Time, Policy Name, Gateway Domain Name and more from the table on the same tab. The Error Description column in the table displays the reason for the EPA failure, and the Policy Name column displays the policy that resulted in the failure.
You can click a user in the Username column to display the EPA errors and other details for that user.
You can customize the table to add or delete columns by using the settings option.
Note
NetScaler Gateway doesn't report the EPA failures when the "clientSecurity" expression is configured as a VPN session policy rule.
SSO Failures
You can view the all the SSO failures at any stage for a user accessing any applications through the NetScaler Gateway appliance.
View SSO failure details
-
In NetScaler Console, navigate to Gateway > Gateway Insight.
-
In the Overview section, select the time period for which you want to view the SSO errors. You can use the time slider to further customize the selected time period. Click Go.
-
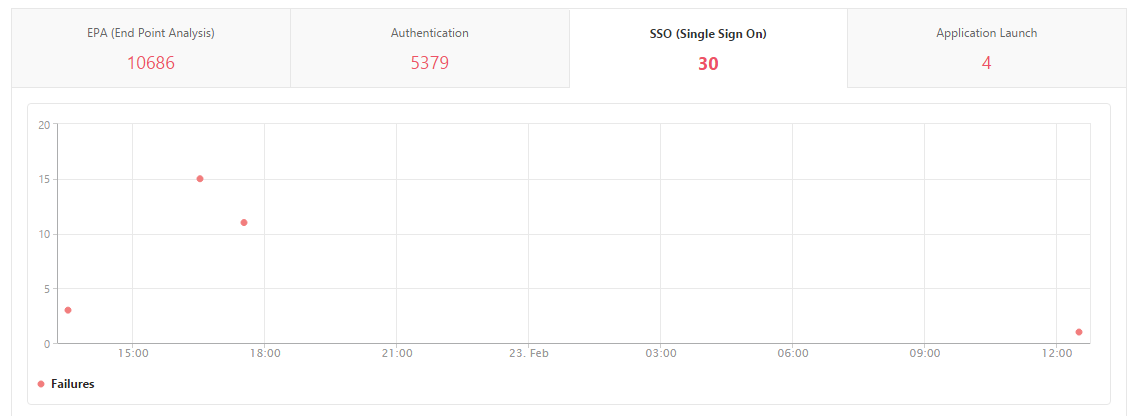
Click the SSO (Single Sign On) tab. You can view the number of SSO errors at any given time in the Failures graph.
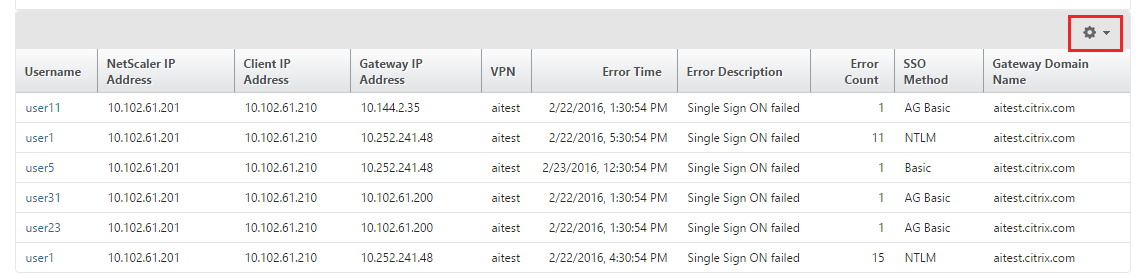
Scroll down to view details of each SSO error such as Username, NetScaler IP Address, Error Time, Error Description, Resource Name and more from the table on the same tab.
You can click a user in the Username column to display the SSO errors and other details for that user.
You can customize the table to add or delete columns by using the settings option.
2. After successfully logging on to NetScaler Gateway, a user is not able to launch any virtual application
For an application-launch failure, you can gain visibility into the reasons, such as inaccessible Secure Ticket Authority (STA) or Citrix Virtual App server, or invalid STA ticket. You can view the time the error occurred, details of the error, and the resource for which STA validation failed.
View application launch failure details
-
In NetScaler Console, navigate to Gateway > Gateway Insight.
-
In the Overview section, select the time period for which you want to view the SSO errors. You can use the time slider to further customize the selected time period. Click Go.
-
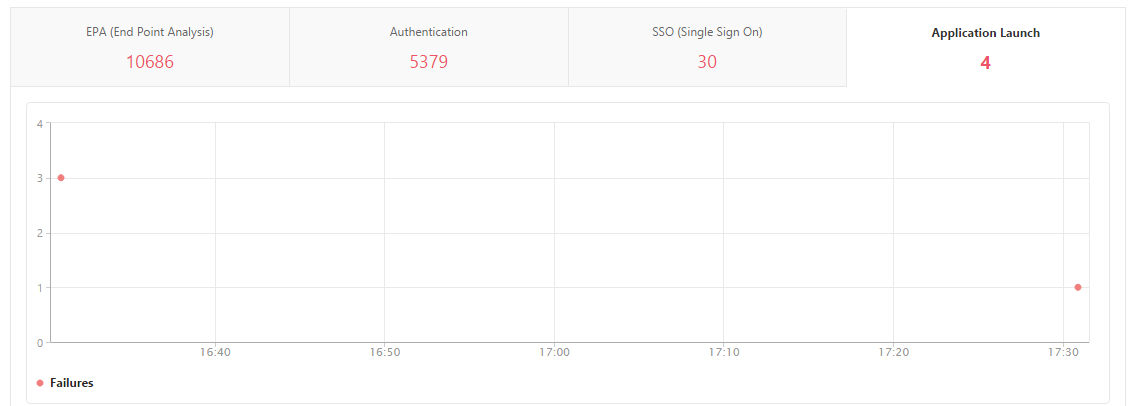
Click the Application Launch tab. You can view the number of application launch failures at any given time in the Failures graph.
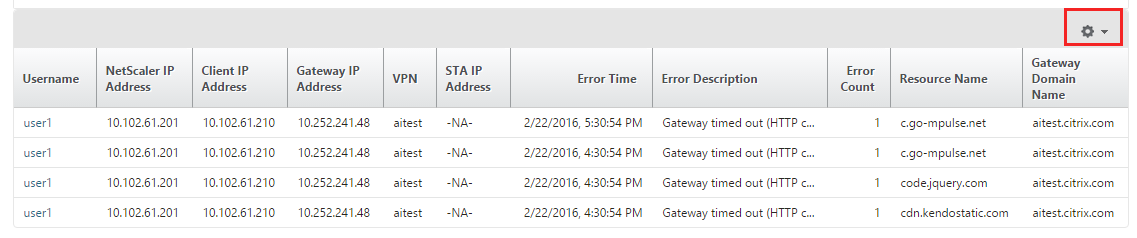
Scroll down to view details of each application launch error, such as NetScaler IP Address, Error Time, Error Description, Resource Name, Gateway Domain Name, and more, from the table on the same tab. The Error Description column in the table displays the IP address of the STA server and the Resource Name column displays the details of the resource for which the STA validation has failed.
You can click a user in the Username column to display the application launch errors and other details for that user.
You can customize the table to add or delete columns by using the settings option.
3. After successfully launching a new application, a user wants to view the total bytes and bandwidth consumed by that application
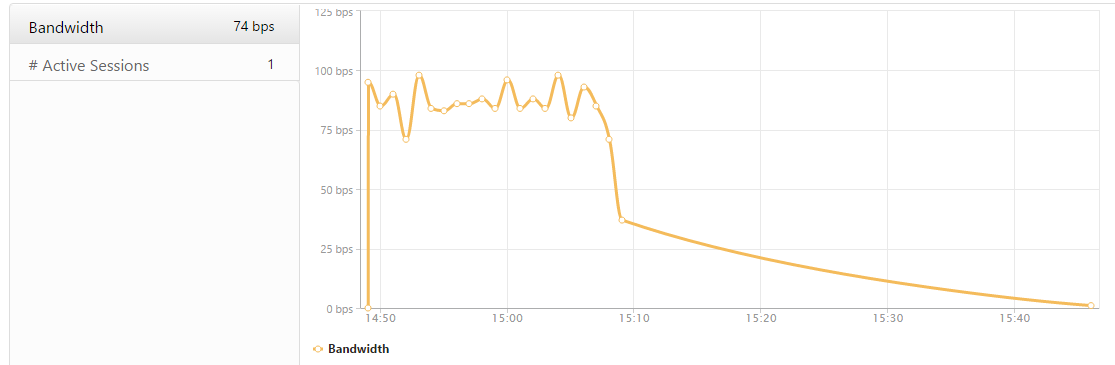
After you have successfully launched a new application, in NetScaler Console, you can view the total bytes and bandwidth consumed by that application.
View total bytes and bandwidth consumed by an application
In NetScaler Console, navigate to Gateway > Gateway Insight > Applications, scroll down and, on the Other Applications tab, click the application for which you want to view the details.
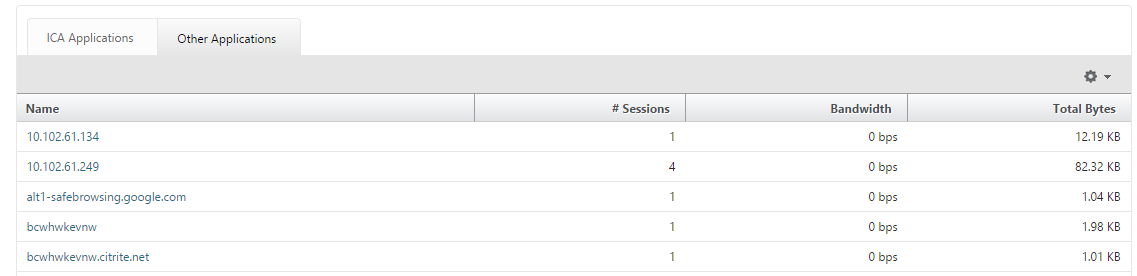
You can view the number of sessions and the total number of bytes consumed by that application.

You can also view the bandwidth consumed by that application.
4. A user has logged on to NetScaler Gateway successfully, but is unable to access certain network resources in the internal network
With Gateway Insight, you can determine whether the user has access to the network resources or not. You can also view the name of the policy that resulted in the failure.
View user access for resources
-
In NetScaler Console, navigate to Gateway > Gateway Insight > Applications.
-
On the screen that appears, scroll down, and on the Other Applications tab, select the application to which the user was unable to log on to.
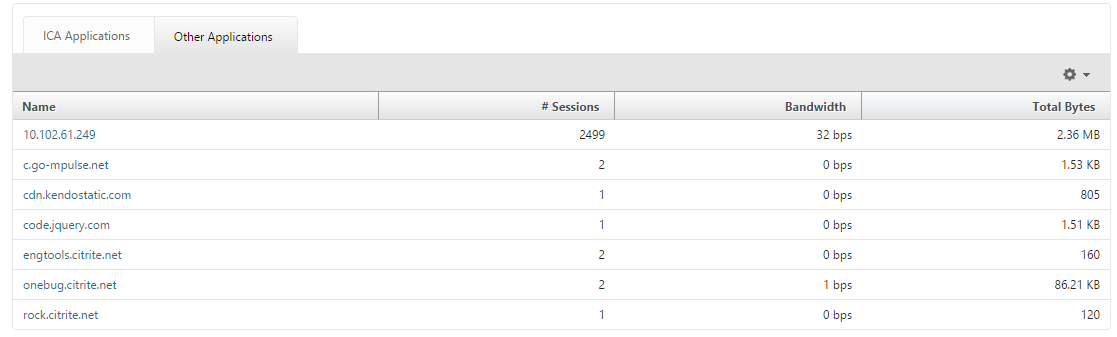
On the screen that appears, scroll down, and in the Users table, all the users that have access to that application are displayed.

5. Different users might be using different NetScaler Gateway deployments or might log on to NetScaler Gateway through different access modes. The administrator must be able to view details about the deployment types and access modes
With Gateway Insight, you can view a summary of the different session modes used by users to log on, the types of clients, and the number of users logged on every hour. You can also determine whether a user's deployment is a unified gateway or classic NetScaler Gateway deployment. For unified gateway deployments, you can view the content switching virtual server name and IP address and the VPN virtual server name.
View summary of session modes, type of clients, and number of users logged on
-
In NetScaler Console, navigate to Gateway > Gateway Insight.
-
In the Overview section, scroll down to view the Session Mode, Operating Systems, Browsers, and User Logon Activity charts display the different session modes used by users to log on, the types of clients, and the number of users logged on every hour.