Analyze the root cause for application slowness
Application slowness is a major concern for any organization because it results in business impact or productivity. As an administrator, you must ensure that all applications perform optimally to avoid any business impact. When your users experience a slowness in accessing the application, you must ensure if the issue is with:
-
Client network latency
-
Server network latency
-
Server processing time
NetScaler Console performs anomaly checks every hour and reports anomalies for past 1 hour traffic, based on certain prerequisites. For example, to avoid false positive results, if the response time is < 1 ms, the anomaly checks for those results are skipped.
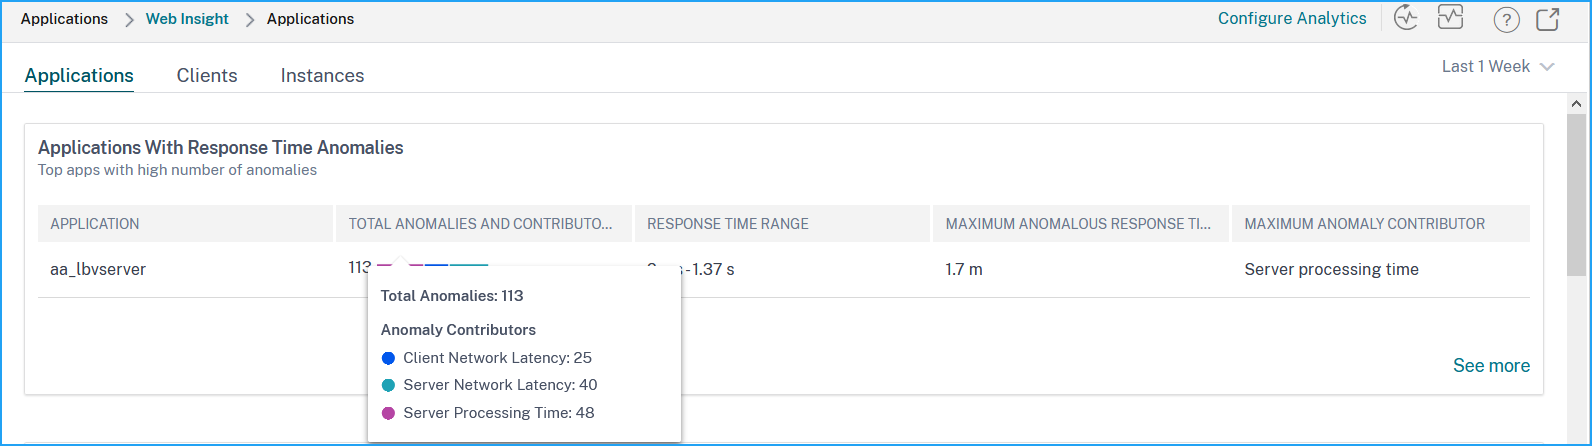
The Applications > Web Insight page enables you to view the applications with response time anomalies for the selected duration. The Applications with Response Time Anomalies metric displays the top five applications based on the total anomalies. Click See more to view all applications.
-
Application – Denotes the application name.
-
Total Anomalies and Contributors – Denotes the total anomalies from the application. When you hover the mouse pointer, you can view the total anomalies that are from the client network latency, server network latency, and server processing time respectively.
-
Response Time Range – Denotes the expected response time range from the application.
-
Maximum Anomalous Response Time – Denotes the highest response time from the application.
-
Maximum Anomaly Contributor – Denotes if the maximum number of anomalies for the application are from client network latency, server network latency, or server processing time.
Related information
Application drill-down
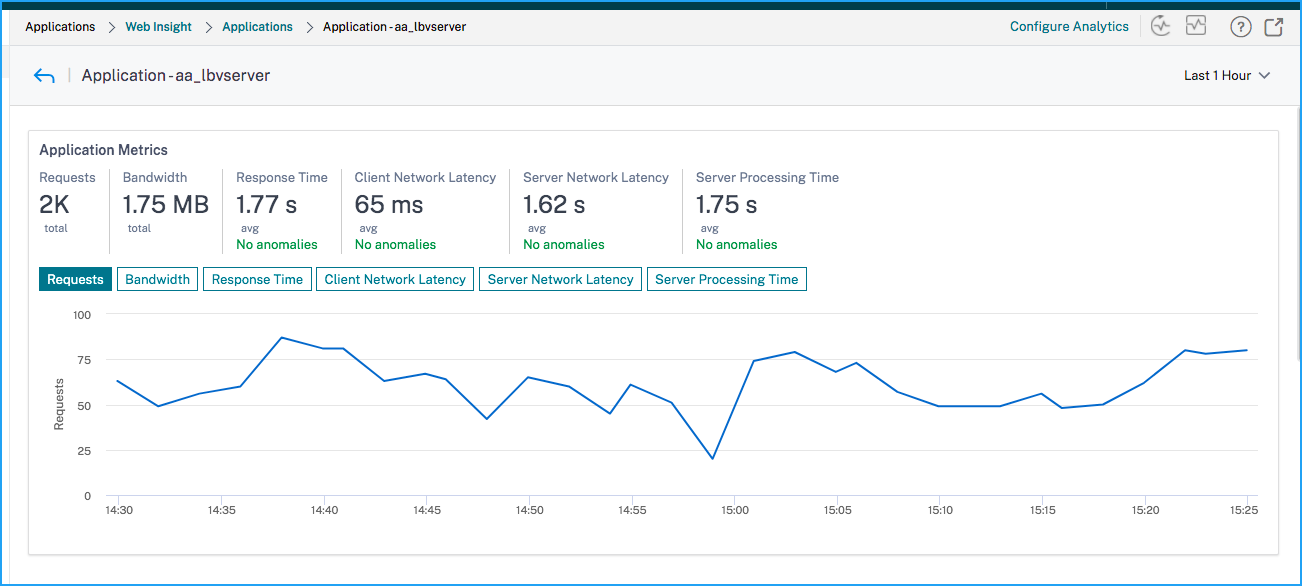
Click an application to view the Application Metrics details for the selected duration.
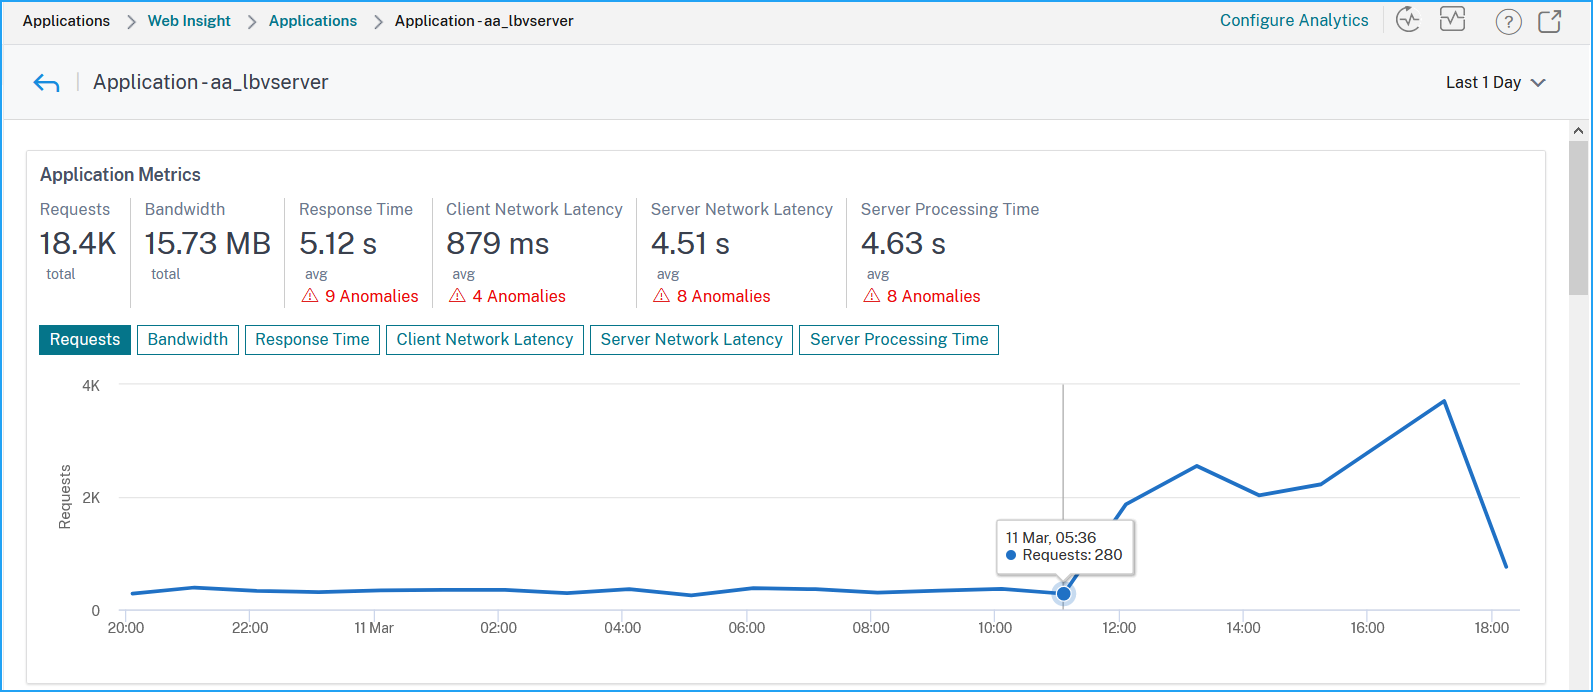
The Application Metrics enable you to view:
-
Summary – An overview to visualize the application performance such as Response Time, Requests, and Bandwidth
-
Requests – The total requests received by the application. You can also view requests from the top 5 clients based on the total requests
-
Bandwidth – The total bandwidth processed by the application. You can also view the bandwidth consumption from the top 5 servers based on the total bandwidth consumption
-
Response Time – An overview to visualize Client Network Latency, Server Network Latency, and Server Processing Time on the same graph
-
Client Network Latency – The average client network latency (from client to NetScaler)
-
Server Network Latency – The average server network latency (from NetScaler to server)
-
Server Processing Time – The average server processing time (from server to NetScaler)
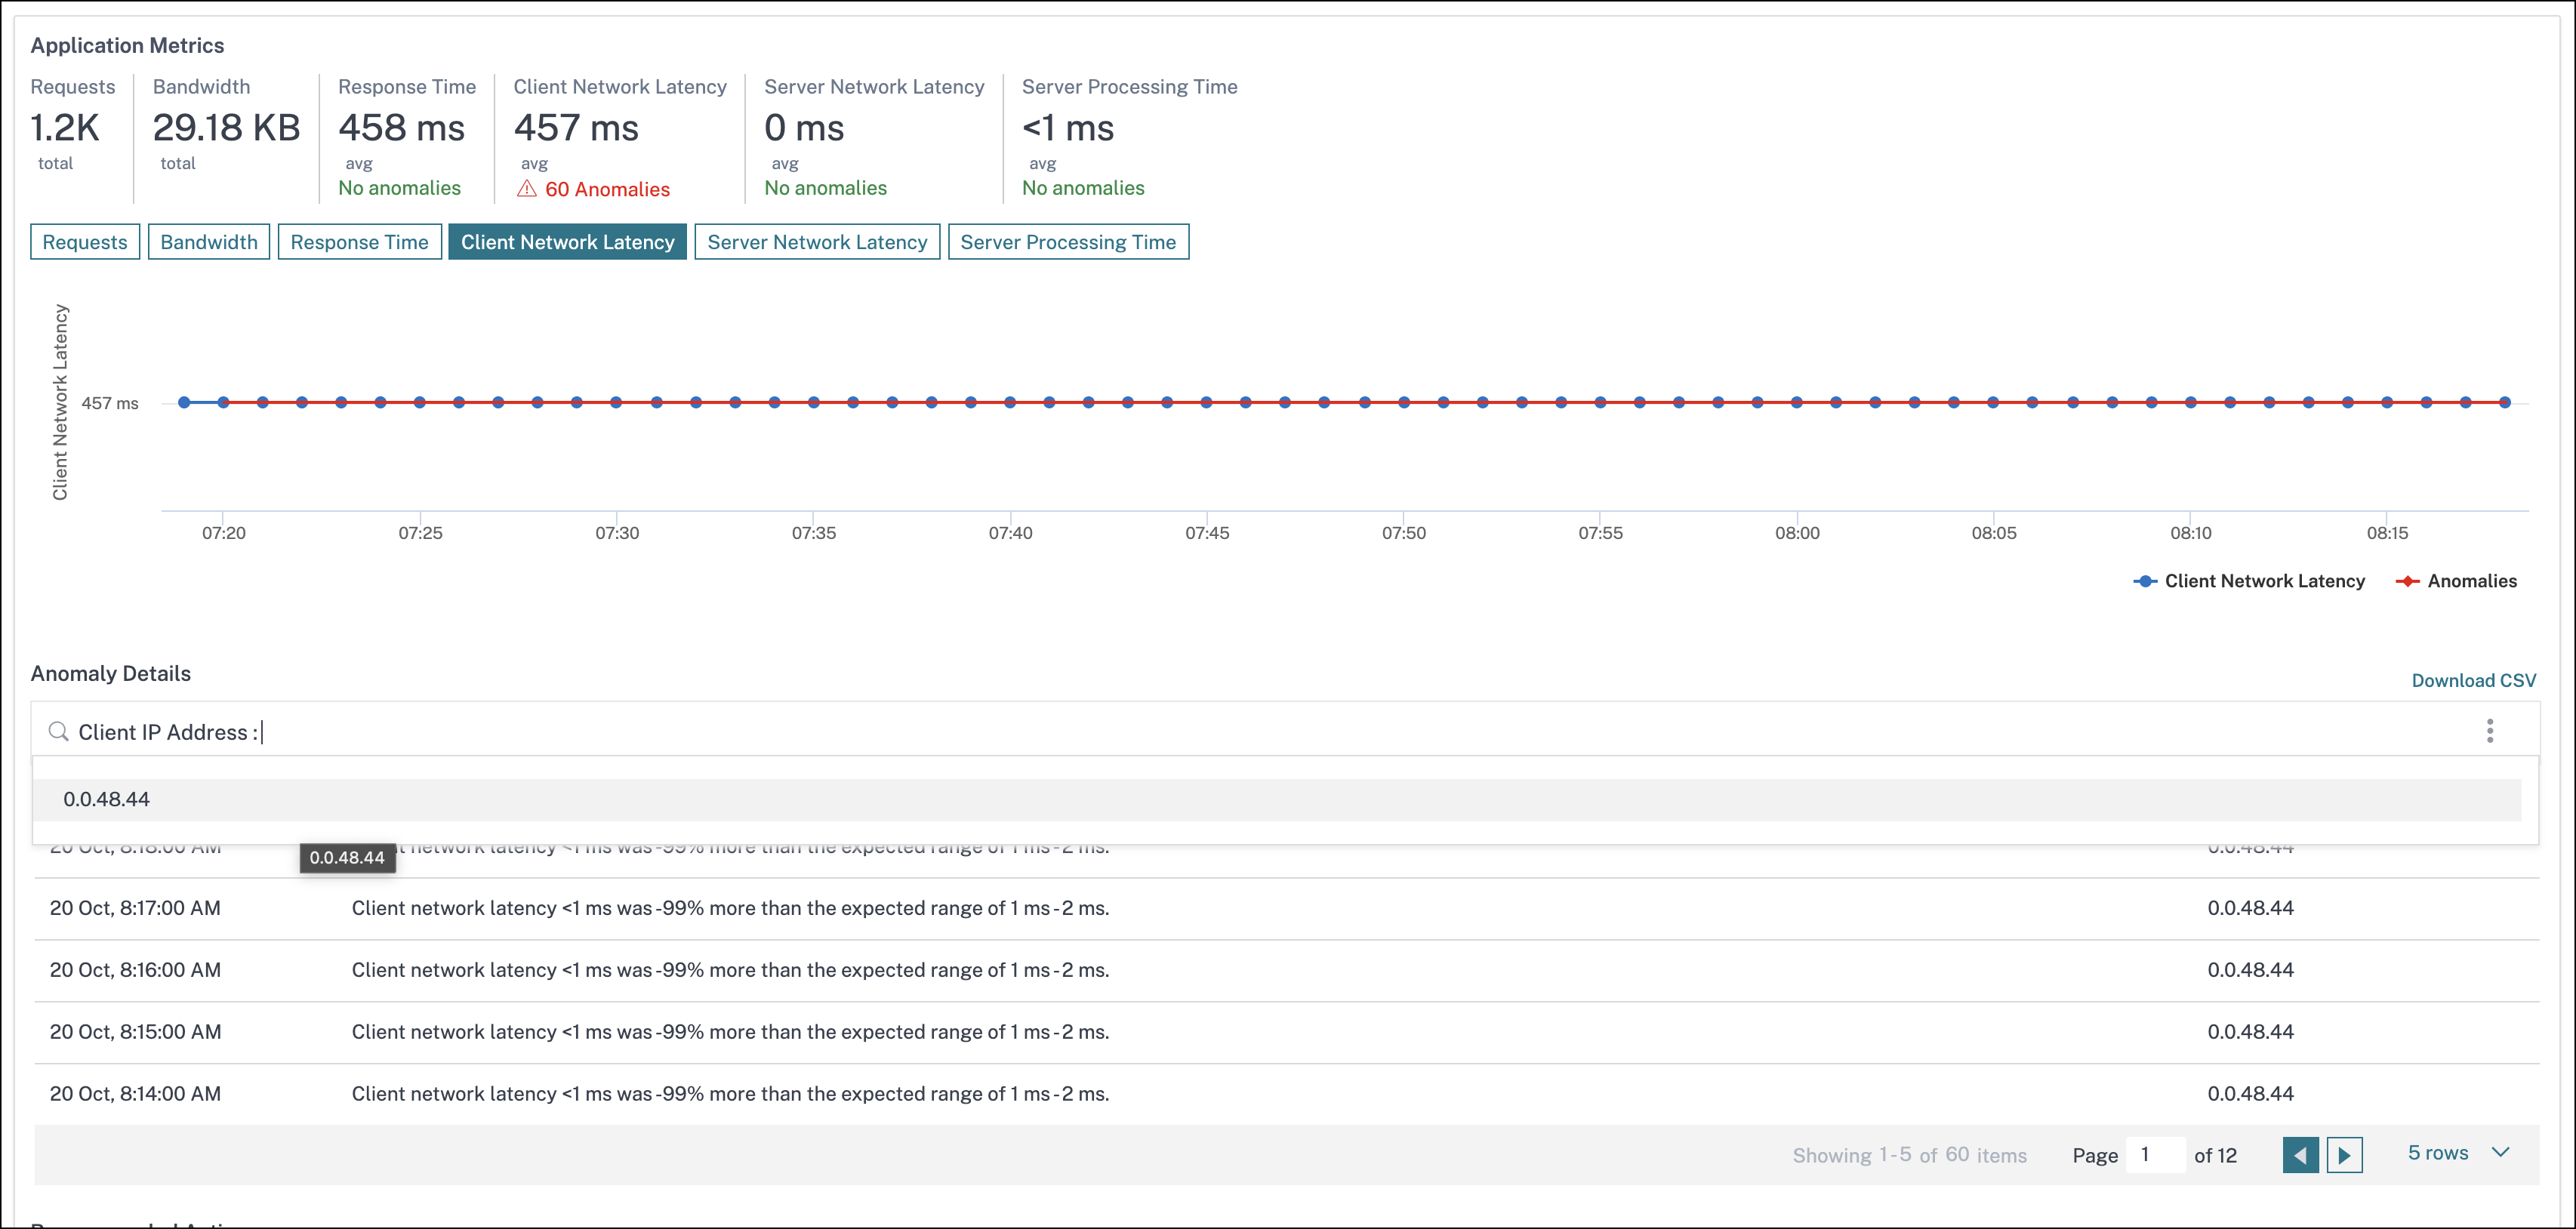
If the application has anomalies, you can view if the anomalies are from client network latency, server network latency, or server processing time. Click each tab to view details.
In the Client Network Latency and Server Network Latency tabs, you can view:
-
A search bar - Click the search bar to view the IP address of all clients (in Client Network Latency) and servers (in Server Network Latency). You can select the IP address to filter results.
-
An export option - Click Download CSV to export the details in CSV format.
Response Time
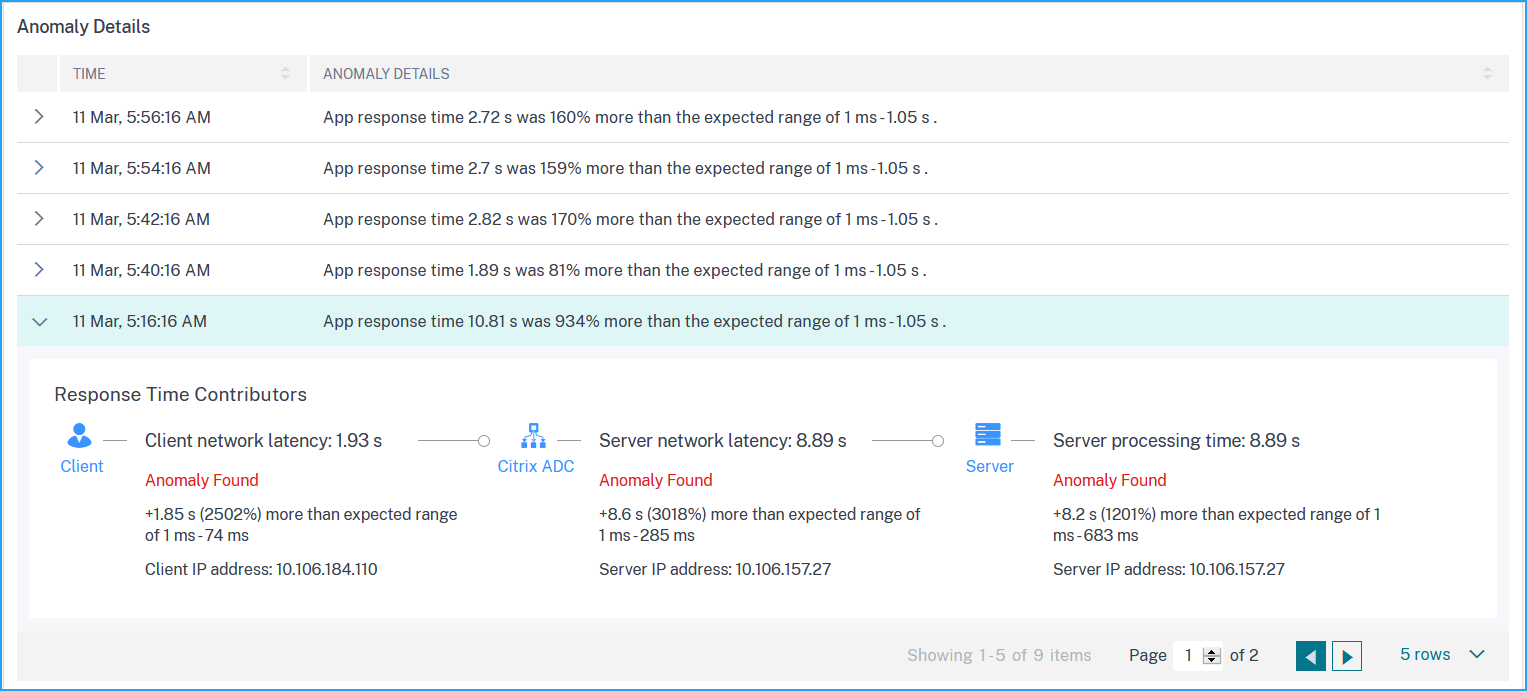
Under Anomaly Details, click to view details for the response time contributors (from client to server). The following example has an anomaly for client network latency, server network latency, and server processing time. You can also view the expected ranges and the breach that has happened beyond the expected range.
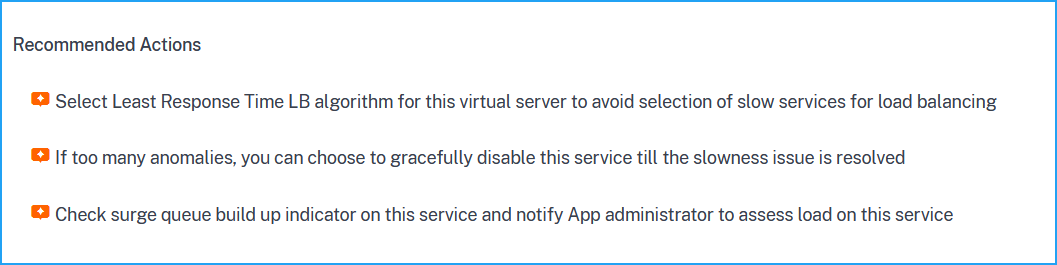
The Recommended Actions suggest you the possible resolutions for the anomalies.
Similarly, you can click the Client Network Latency, Server Network Latency, and Server Processing Time tabs to view:
-
Anomaly that has breached the expected range.
-
Recommended Actions that suggest you the possible resolutions.
If the application is performing well, you can view application metrics as no anomalies.