
Infrastructure Analytics
A key goal for network administrators is to monitor {{page.citrix-adc-generic}} instances. {{page.citrix-adc-generic}} instances offer interesting insights into usage and performance of applications and desktops accessed through it. Administrators must monitor the {{page.citrix-adc-generic}} instance and analyze the application flows processed by each {{page.citrix-adc-generic}} instance. Administrators must also be able to remediate any probable issues in configuration, setup, connectivity, certificates, and other impacts in application usage or performance. For example, a sudden change in application traffic pattern can be due to change in SSL configuration like disabling of an SSL protocol. Administrators must be able to quickly identify the correlation between these data points to ensure the following:
-
Application availability is in an optimal state
-
There are no resource consumption, hardware, capacity, or configuration change issues
-
There are no unused inventories
-
There are no expired certificates
Infrastructure Analytics feature simplifies the process of data analysis by correlating multiple data sources and quantifying to a measurable score that defines the health of an instance. With this feature, administrators get a single touch point to understand the problem, the origin of the problem, and probable remediations that they can perform.
Infrastructure Analytics in
The Infrastructure Analytics feature collates all the data gathered from the {{page.citrix-adc-generic}} instances and quantifies it into an Instance Score that defines the health of the instances. The instance score is summarized over tabular view or as circle pack visualization. The Infrastructure Analytics feature helps you to visualize the factors that resulted or might result in an issue on the instances. This visualization also helps you to determine the actions that must be performed to prevent the issue and its recurrence.
Instance score
Instance score indicates the health of an {{page.citrix-adc-generic}} instance. A score of 100 means a perfectly healthy instance without any issues. Instance score captures different levels of potential issues on the instance. It is a quantifiable measurement of instance health and multiple "health indicators" contribute to the score.
Health indicators are the building blocks of the instance score, where the score is computed periodically for a predefined "monitoring period," based on all detected indicators in that time window. Currently, Infrastructure analytics calculates the instance score once every hour based on the data collected from the instances. An indicator can be defined as any activity (an event or an issue) that belongs to one of the following categories on the instances.
-
System resource indicators
-
Critical events indicators
-
SSL configuration indicators
-
Configuration deviation indicators
Health indicators explained
-
System resources indicatorsThe following are the critical system resource issues that might occur on {{page.citrix-adc-generic}} instances and monitored by {{page.adm-product-name-short}}.
-
High CPU usage. The CPU usage has crossed the higher threshold value in the {{page.citrix-adc-generic}} instance.
-
High memory usage. The memory usage has crossed the higher threshold value in the {{page.citrix-adc-generic}} instance.
-
High disk usage. The disk usage has crossed the higher threshold value in the {{page.citrix-adc-generic}} instance.
-
Disk errors. There are errors on hard disk 0 or hard disk 1 on the hypervisor where the {{page.citrix-adc-generic}} instance is installed.
-
Power failure. The power supply has failed or disconnected from the {{page.citrix-adc-generic}} instance.
-
SSL card failure. The SSL card installed on the instance has failed.
-
Flash errors. There are Compact Flash Errors seen on the {{page.citrix-adc-generic}} instance.
-
NIC discards. The packets discarded by the NIC card have crossed the higher threshold value in the {{page.citrix-adc-generic}} instance.
-
For more information on these system resources errors, see Instance dashboard.
-
Critical events indicatorsThe following critical events are identified by the events under event management feature of {{page.adm-product-name-short}} that are configured with critical severity.
-
HA sync failure. Configuration sync between the {{page.citrix-adc-generic}} instances in high availability has failed on the secondary server.
-
HA no heartbeats. The primary server in a pair of {{page.citrix-adc-generic}} instances in high availability is not receiving heart beats from the secondary server.
-
HA bad secondary state. The secondary server in a pair of {{page.citrix-adc-generic}} instances in high availability is in Down, Unknown, or Stay secondary state.
-
HA version mismatch. The version of the {{page.citrix-adc-generic}} software images installed on a pair of {{page.citrix-adc-generic}} instances in high availability does not match.
-
Cluster sync failure. Configuration sync between the {{page.citrix-adc-generic}} instances in cluster mode has failed.
-
Cluster version mismatch. The version of the {{page.citrix-adc-generic}} software images installed on the {{page.citrix-adc-generic}} instances in cluster mode does not match.
-
Cluster propagation failure. Propagation of configurations to all instances in a cluster has failed.Note:You can have your list of critical SNMP events by changing the severity levels of the events. For more information on how to change the severity levels, see Modify the reported severity of events that occur on {{page.citrix-adc-generic}} instances.
For more information on events in {{page.adm-product-name-short}}, see Events. -
-
SSL configuration indicators
-
Not recommended key strength. The key strength of the SSL certificates is not as per NetScaler® standards
-
Not recommended issuer. The issuer of the SSL certificate is not recommended by Citrix.
-
SSL certs expired. The SSL certificate installed in the {{page.citrix-adc-generic}} instance has expired.
-
SSL certs expiry due. The SSL certificate installed in the {{page.citrix-adc-generic}} instance is about to expire in the next one week.
-
Not recommended algorithms. The signature algorithms of SSL certificates installed in the {{page.citrix-adc-generic}} instance are not as per NetScaler standards.
-
For more information on SSL certificates, see SSL dashboard.
-
Configuration deviation indicators
-
Config drift template. There is a drift (unsaved changes) in configuration from the audit templates that you have created with specific configurations you want to audit on certain instances.
-
Config drift default. There is a drift (unsaved changes) in configuration from the default configuration files.
-
For more information on configuration deviations and how to run audit reports to check configuration deviation, see View audit reports..
View {{page.citrix-adc-generic}} Capacity issues
When a {{page.citrix-adc-generic}} instance has consumed most its available capacity, packet-drop might occur while processing the client traffic. By understanding such {{page.citrix-adc-generic}} capacity issues, you can proactively allocate additional licenses to steady the {{page.citrix-adc-generic}} performance. For more information, see View the capacity issues in a {{page.citrix-adc-generic}} instance.
Value of health indicators
The indicators are classified into high priority indicators and low-priority indicators based on their values as follows:
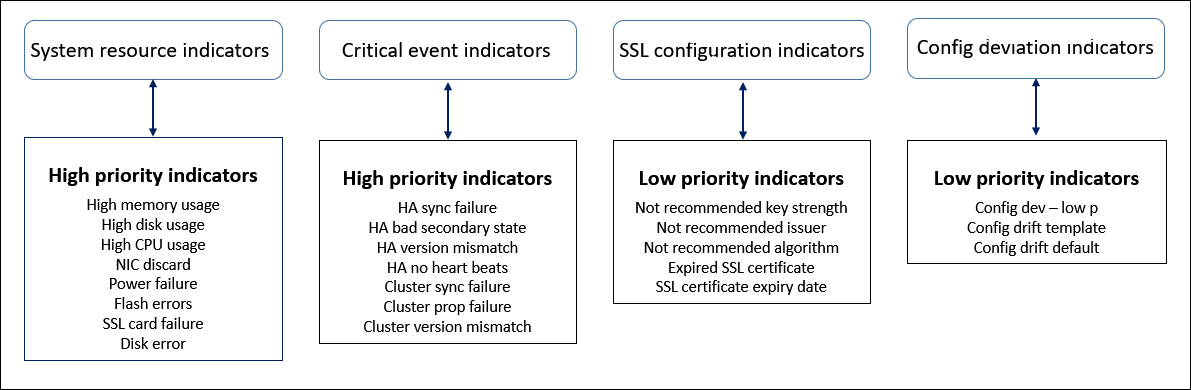
The health indicators within the same group of indicators have different weights assigned to them. One indicator might contribute more to lowered instance score than another indicator. For example, high memory usage brings down the instance score more than high disk usage, high CPU usage, and NIC discard. If an instance has a greater number of indicators detected on it, the lesser is the instance score.
The value of an indicator is calculated based on the following rules. The indicator is said to be detected in one of the following three ways:
-
Based on an activity. For example, a System resource indicator is triggered whenever there is a power failure on the instance, and this indicator reduces the value of the instance score. When the indicator is cleared the penalty is cleared, and the instance score increases.
-
Based on the threshold value breach. For example, a System resource indicator is triggered when the NIC card discards packets and the threshold level is breached.
-
Based on the low and high threshold value breach. Here, an indicator can be triggered in two ways:
-
When the value of the indicator is between low and high thresholds, in which case a partial penalty is levied on the instance score.
-
When the value crosses the high threshold, in which case a full penalty is levied on the instance score.
-
No penalty is levied on the instance score if the value falls below a low threshold.
-
For example, CPU usage is a system resource indicator triggered when the usage value crosses the low threshold and also when the value crosses the high threshold.
Infrastructure analytics dashboard
Navigate to Infrastructure > Infrastructure Analytics.
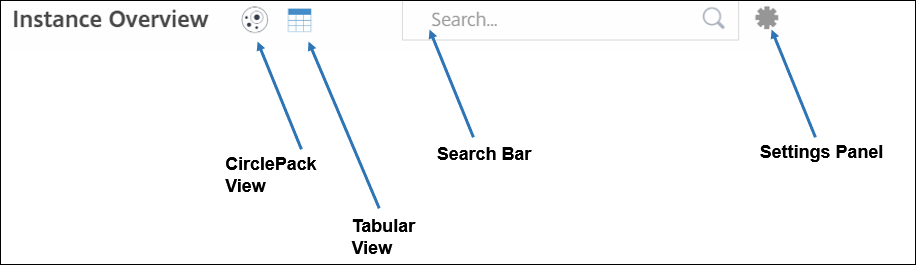
The Infrastructure Analytics can be viewed in a Circle Pack format or a Tabular format. You can toggle between the two formats.
-
In the Tabular view, you can search for an instance by typing the host name or the IP address in the Search bar.
-
By default, Infrastructure Analytics page displays the Summary Panel on the right side of the page.
-
Click the Settings icon to display the Settings Panel.
-
In both the view formats, the Summary Panel displays details of all the instances in your network.
Circle pack view
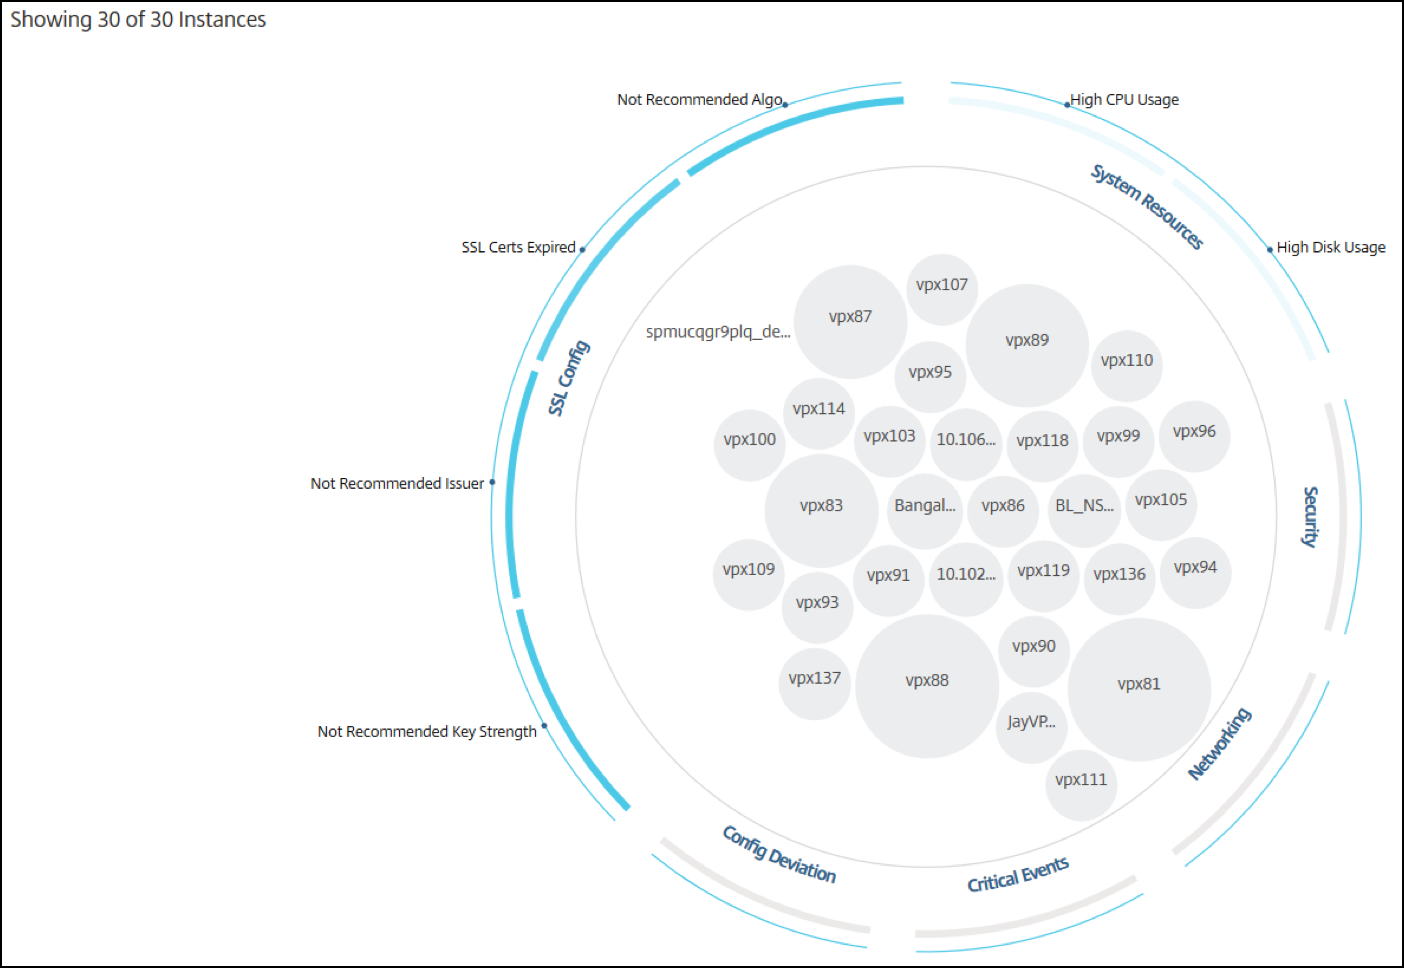
Circle packing diagrams show instance groups as tightly organized circles. They often show hierarchies where smaller instance groups are either colored similarly to others in the same category, or nested within larger groups. Circle packs represent hierarchical data sets and shows different levels in the hierarchy and how they interact with each other.
Instance circles
Color. Each instance is represented in Circle Pack as a colored circle. The color of the circle indicates the health of that instance.
-
Green - instance score is between 100 and 80. The instance is healthy.
-
Yellow - instance score is between 80 and 50. Some issues have been noticed and in need of review.
-
Red - instance score is below 50. The instance is in a critical stage as there are multiple issues noticed on that instance.
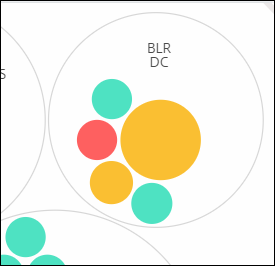
Size. The size of these colored circles indicates the number of virtual servers configured on that instance. A bigger circle indicates that there are a greater number of virtual servers.
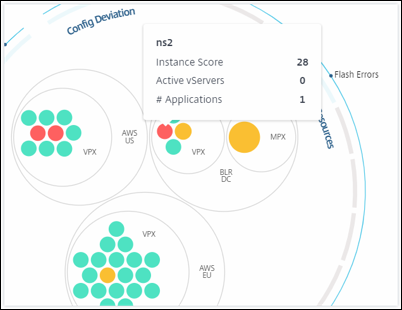
You can hover the mouse pointer on each of the instance circles (colored circles) to view a summary. The hover tool tip displays the host name of the instance, the number of active virtual servers and the number of applications configured on that instance.
Grouped instance circles
The Circle Pack at the outset, comprises instance circles that are grouped, nested, or packed inside another circle based on the following criteria:
-
the site where they are deployed
-
the type of instances deployed - VPX, MPX, SDX, and CPX
-
the virtual or physical model of the {{page.citrix-adc-generic}} instance
-
the {{page.citrix-adc-generic}} image version installed on the instances
The following image shows a Circle Pack where the instances are first grouped by the site or data center where they are deployed, and then they are further grouped based on their type, VPX, and MPX.
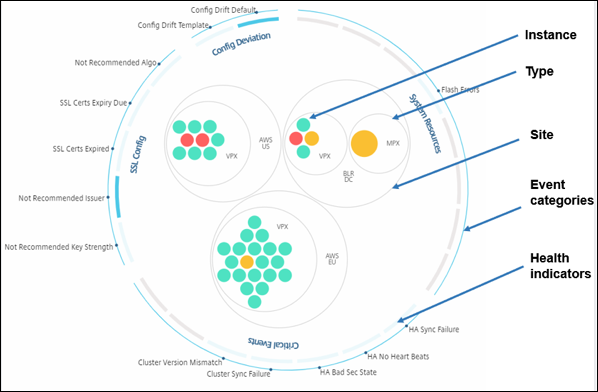
All these nested circles are bounded by two outermost circles. The outer two circles represent the four categories of events monitored by the {{page.adm-product-name-short}} (system resources, critical events, SSL configuration, and configuration deviation) and the contributing health indicators.
Clustered instance circles
{{page.adm-product-name-short}} monitors many instances. To ease the monitoring and maintenance of these instances, Infrastructure Analytics allows you to cluster them at two levels. That is, the instance groupings can be nested within another grouping.
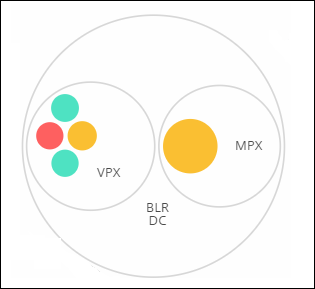
For example, the BLR data center has two types of {{page.citrix-adc-generic}} instances - VPX and MPX, deployed in it. You can first group the {{page.citrix-adc-generic}} instances by their type and then group all instances by the site where they are grouped. You can now easily identify how many types of instances are deployed in the sites that you are managing.
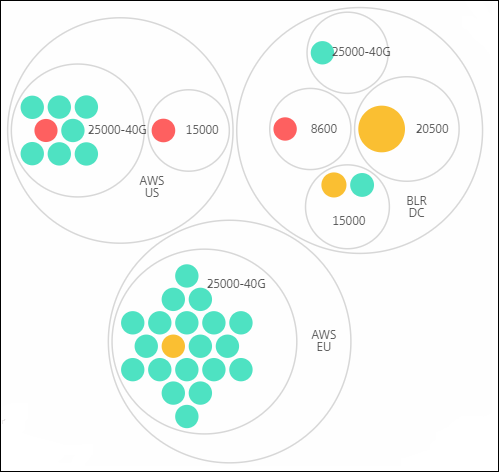
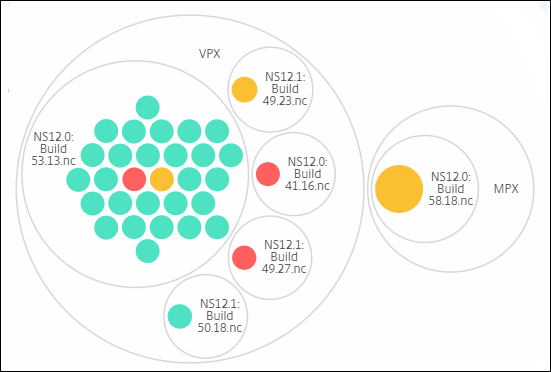
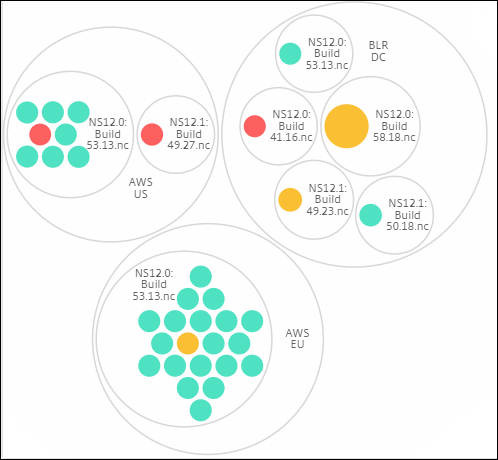
A few more examples of two-level clustering are as follows:
Site and model:
Type and version:
Site and version:
How to use Circle Pack
Click each of the colored circle to highlight that instance.
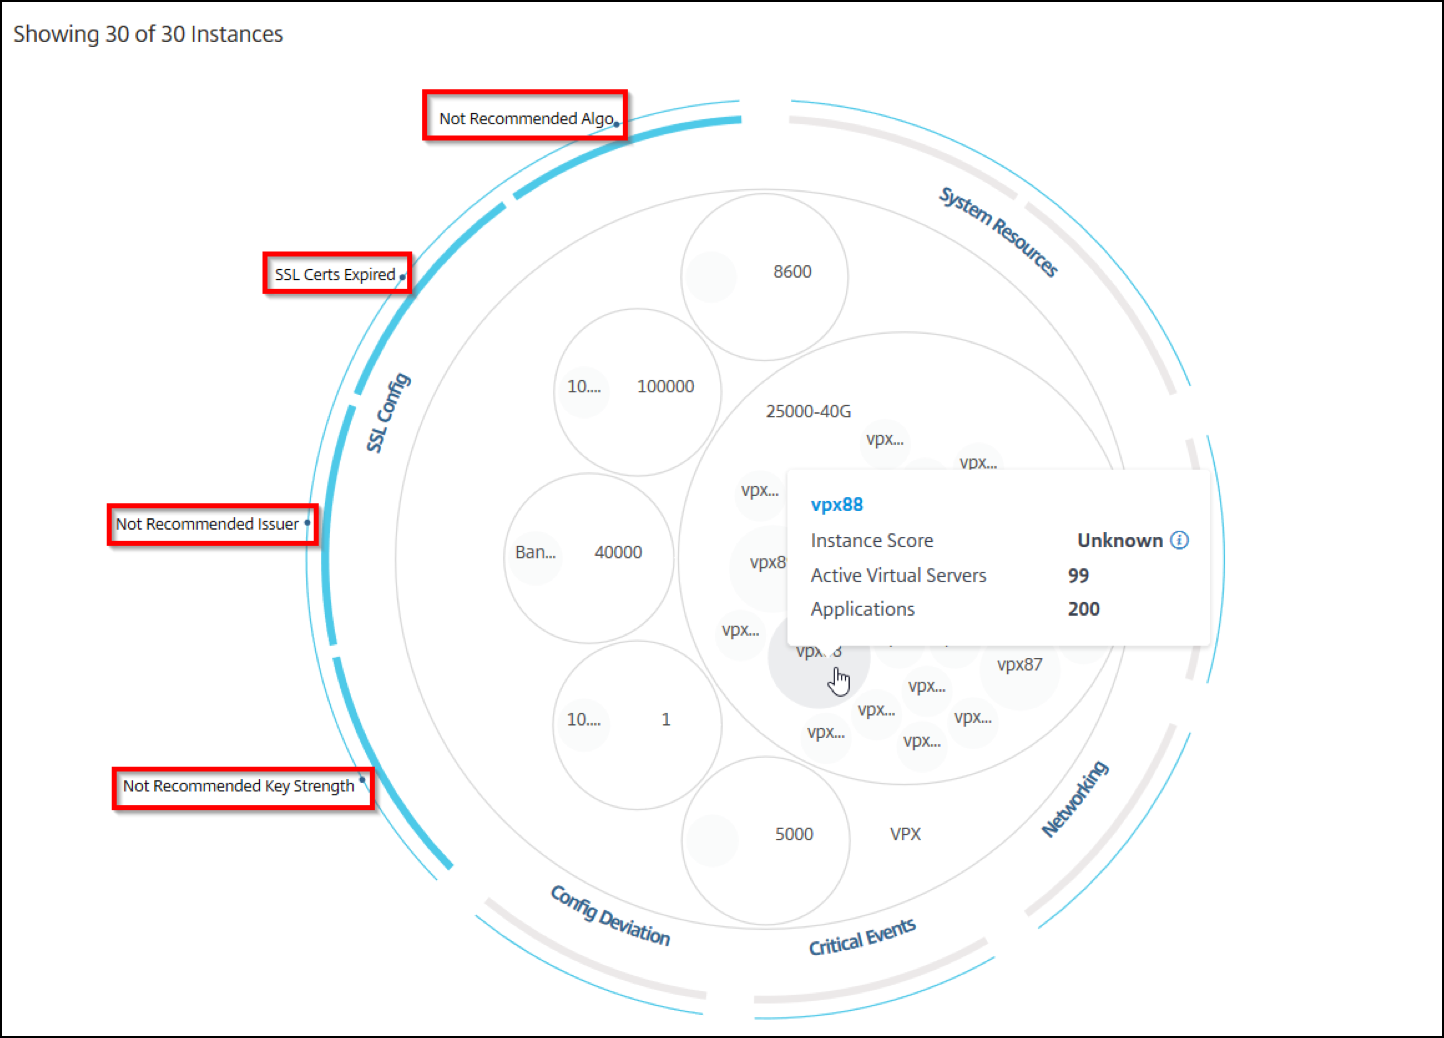
Depending on the events that have occurred in that instance, only those health indicators are highlighted on the outer circles. For example, the following two images of the Circle Pack display different sets of risk indicators, though both instances are in a critical state.
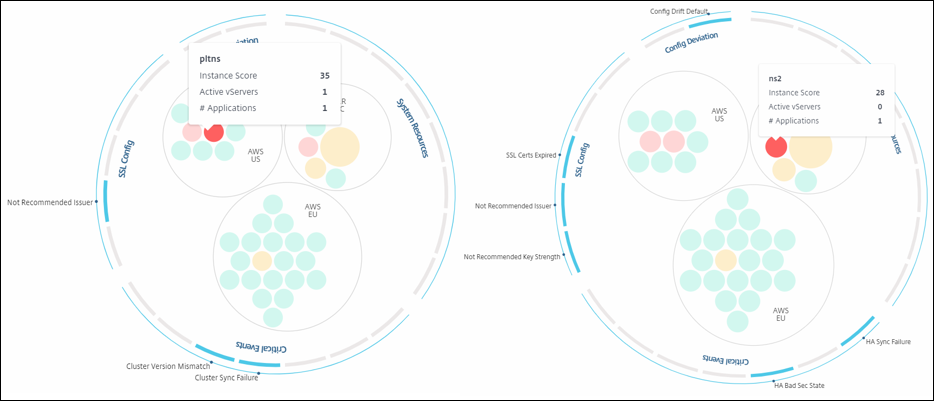
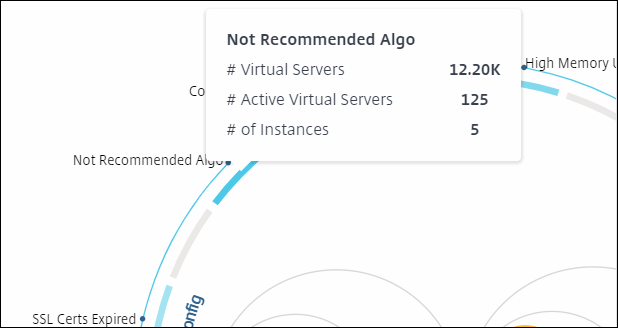
You can also click the health indicators to get more details on the number of instances that have reported that risk indicator. For example, click
Not recommended Algo to view the summary report of that risk indicator.
Tabular view
The tabular view displays the instances and the details of those instances in a tabular format. For more information, see Instance details
Search bar
Place the mouse cursor on the search bar and select the following search attributes to filter the results:
-
Host name
-
IP address
-
Type
-
Version
-
Site
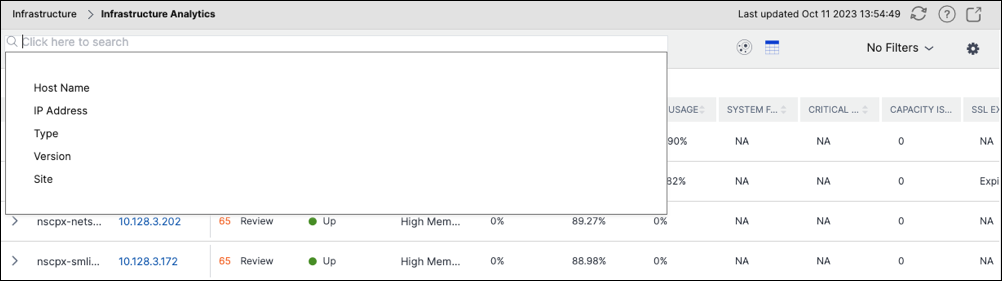
The search results work for both circle view and table view.
How to use the Summary Panel
The Summary Panel assists you in efficiently and quickly focuses on the instances that are in need of review or critical state. The panel is divided into three tabs - overview, instance info, and traffic profile. The changes you make in this panel modifies the display in both Circle Pack and Tabular view formats. The following sections describe these tabs in more detail. The examples in the following sections assist you to use the different selection criteria efficiently to analyze the issues reported by the instances.
Overview:
The Overview tab allows you to monitor the instances based on the hardware errors, usage, expired certificates and similar indicators that can occur in the instances. The indicators that you can monitor here are as follows:
-
CPU usage
-
Memory usage
-
Disk usage
-
System failures
-
Critical events
-
SSL certificates expiry
For more information on these indicators, see Health indicators in {{page.citrix-adc-generic}} instances.
The following examples illustrate how you can interact with the Overview panel to isolate those instances that are reporting errors.
Example 1: View instances that are in a review state:
Select Review check box to view only those instances that are not reporting critical errors, but still needs attention.
The Histograms in the Overview panel represent an aggregated number of instances based on high CPU usage, high memory usage, and high disk usage events. The Histograms are graded at 10%, 20%, 30%, 40%, 50%, 60%, 70%, 80%, 90%, and 100%. Hover your mouse pointer on one of the bar charts. The legend at the bottom of the chart displays the usage range and the number of instances in that range. You can also click the bar chart to display all the instances in that range.
Example 2: View instances that are consuming between 10% and 20% of the allocated memory:
In the memory usage section, click the bar chart. The legend shows that the selected range is 10–20% and there are 29 instances operating in that range.
You can also select multiple ranges in these histograms.
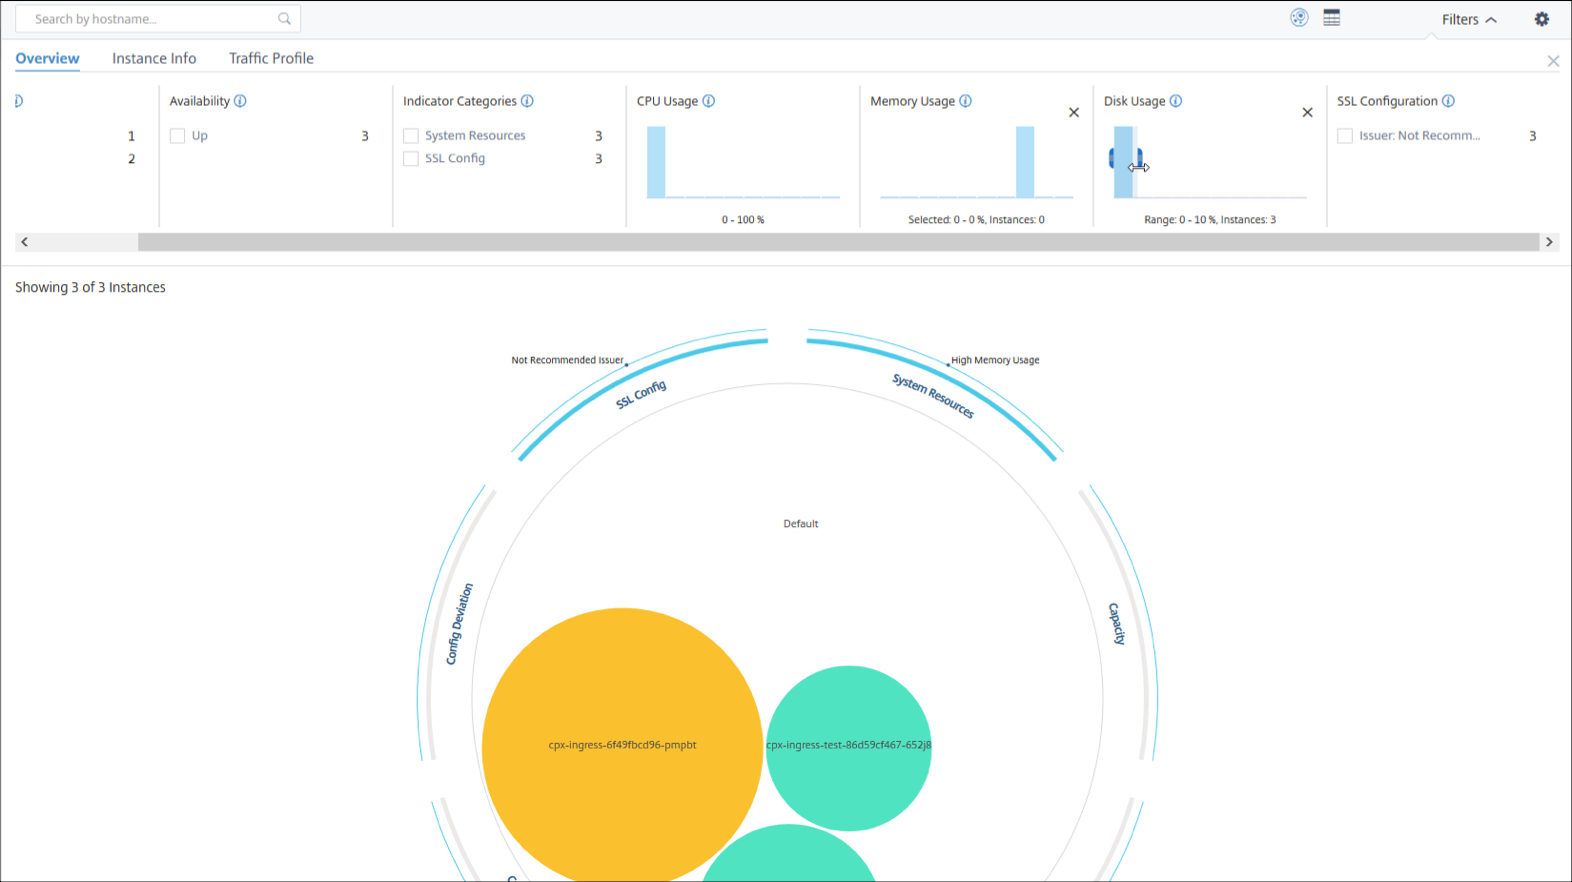
Example 3: View instances that are consuming disk space in multiple ranges:
To view instances that have consumed memory between 0% and 10% disk space, drag the mouse pointer over the two ranges as shown in the following image.
Note:
Click "X" to remove the selection. You can also click Reset to remove multiple selections.
The horizontal bar charts in the Overview panel indicate the number of instances that report system errors, critical events, and expiry status of the SSL certificates. Select the check box to view those instances.
Example 4: View instances for expired SSL certificates:
In the SSL certificates expiry section, select Expired check box to view the three instances.
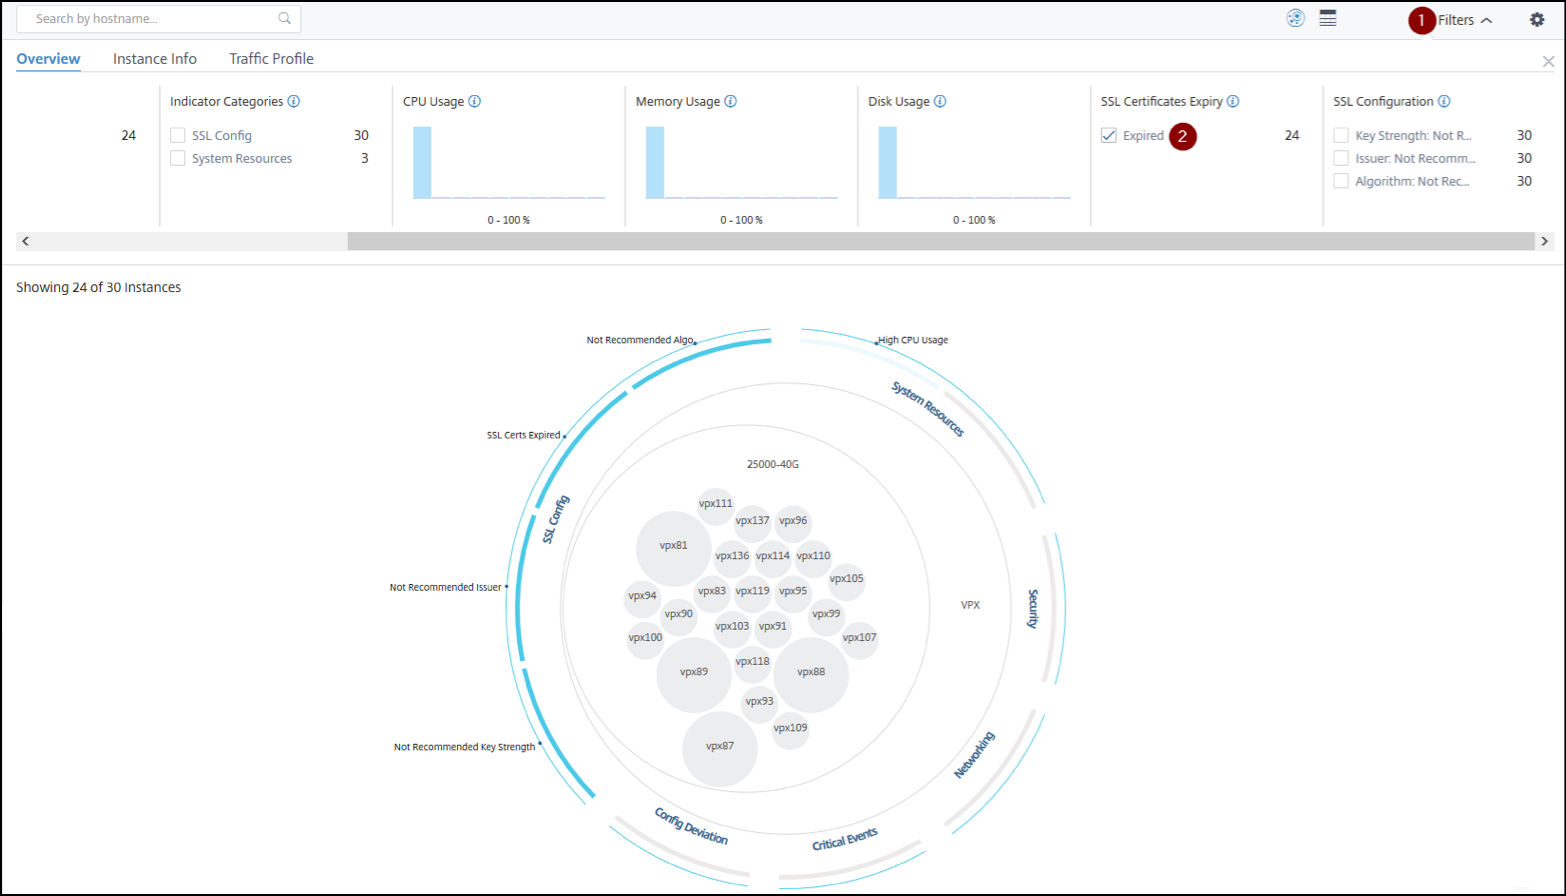
1 - Click the Filter list.
2 - In the SSL certificates expiry section, select Expired check box to view the instances.
Instance info
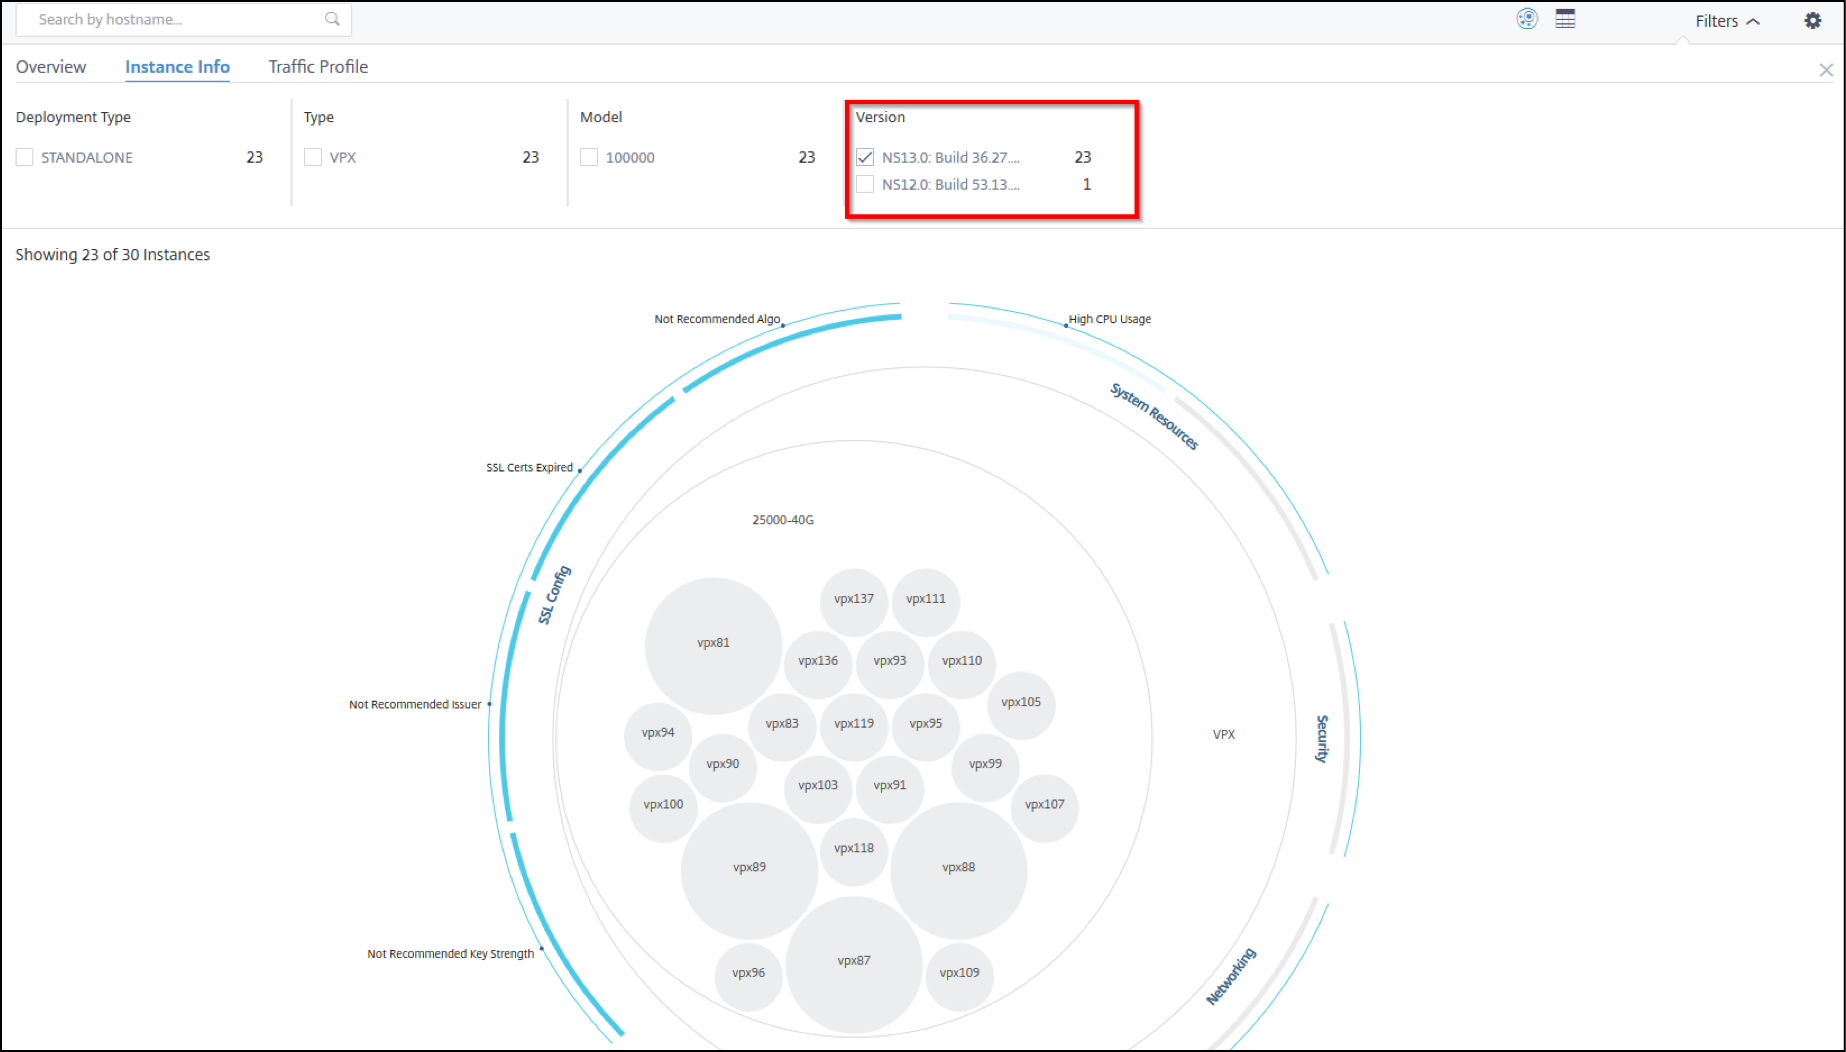
The Instance Info panel allows you to view instances based on the type of deployment, instance type, model, and software version. You can select multiple check boxes to narrow down your selection.
Example 5: View {{page.netscaler-vpx-short}} instances with specific build number:
Select the version that you want to view.
Traffic profile
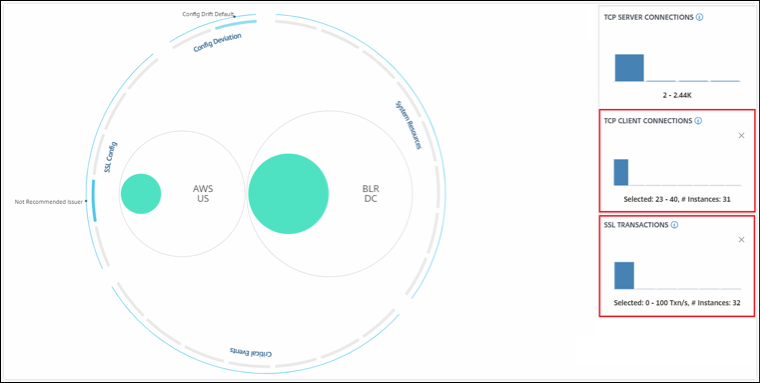
The Histograms in the Traffic profile panel represent an aggregated number of instances based on the licensed throughput on the instances, number of requests, connections, and transactions handled by the instances. Select the bar chart to view instances in that range.
Example 6: View instances supporting TCP connections:
The following image shows the number of instances supporting TCP connections between 23 and 40, and also processing up to 100 SSL transactions per second.
How to use the settings panel
The Settings panel allows you to:
-
Set the default view of the Infrastructure Analytics.
-
Set the low and high threshold values for high CPU usage, high disk usage, and high memory usage.
-
Select the instance metrics, configure thresholds, and assign weightage for those metrics to calculate the instance score
-
Select the required issues, enable notifications for issues that breach the configured thresholds, and receive notifications only for the selected issues.
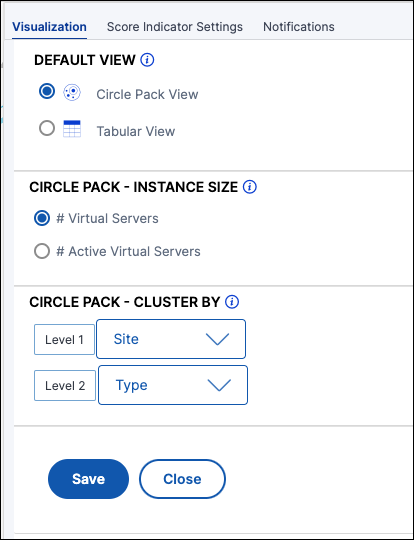
View
-
Default View. Select Circle Pack or Tabular format as the default view on the analytics page. The format you select is what you see whenever you access the page in {{page.adm-product-name-short}}.
-
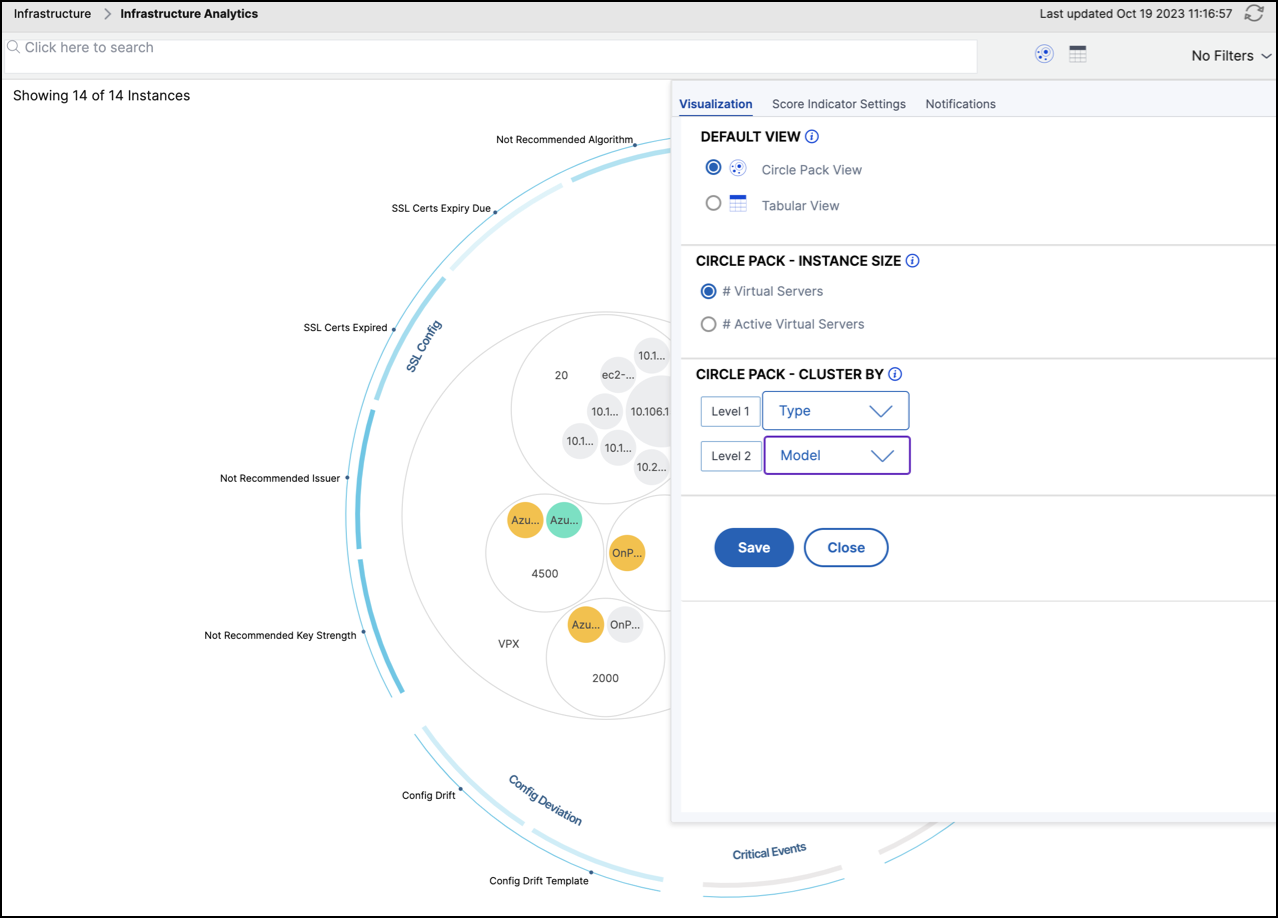
Circle Pack - Instance Size. Allow the size of the instance circle to by either the number of virtual servers or the number of active virtual servers.
-
Circle Pack - Cluster By. Decide the two-level clustering of the instance circles. For more information on instance clustering, see Clustered instance circles.
Select metrics and customize weightage for instance score calculation
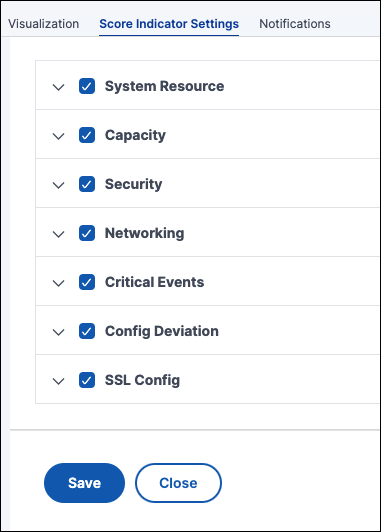
You can select the instance metrics, configure thresholds, and assign weightage for those metrics to calculate the instance score. By default, all metrics are selected, and default weightage is assigned to each metric. You can select metrics depending upon your requirement and assign a suitable weightage to determine the instance score calculation.
Click the Settings icon and select the Score Indicator Settings tab to:
-
Select the required metrics and add thresholds
-
Assign the weightage for metrics.
After you configure thresholds and assign weightage, click Save. The instance score is updated only based on the selected metrics and their weightage.
Configure notifications
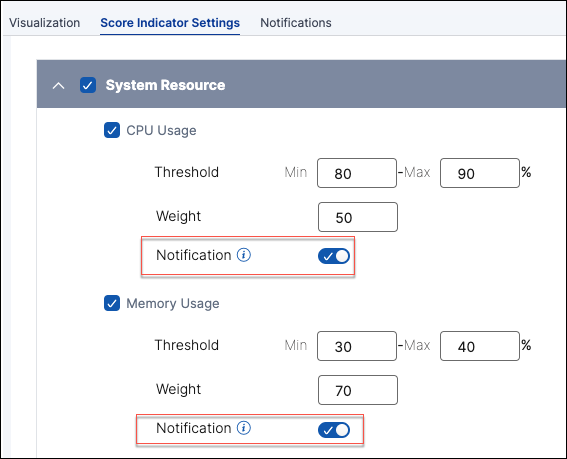
You can select the required issues, enable notifications for issues that breach the configured thresholds, and receive notifications only for the selected issues. This enhancement enables you to receive notifications only for the selected issues that you want to monitor.
Note:
By default, issues under all categories are selected. You can enable notification only for the issues that you can configure thresholds.
-
Click the Settings icon and select the Score Indicator Settings tab.
-
Select the issues that you want to receive notifications.
-
For the issues under System Resource and Capacity categories, enable the Notification.
-
Click Save.Note:You must ensure to configure at least one profile in the Notifications tab.
How to visualize data on the dashboard
Using Infrastructure Analytics, network admins can now identify instances needing the most attention within a few seconds. To understand this in more detail, let us consider the case of Chris, a network admin of ExampleCompany.
Chris maintains many {{page.citrix-adc-generic}} instances in his organization. A few of the instances process high traffic, and he needs to monitor them closely. He notices that a few high-traffic instances are no longer processing the full traffic passing through them. To analyze this reduction, earlier, he had to read multiple data reports coming in from various sources. Chris had to spend more time trying to correlate the data manually and find out which instances are not in optimal state and need attention. He uses the Infrastructure Analytics feature to see the health of all instances visually.
The following two examples illustrate how Infrastructure Analytics assists Chris in maintenance activity:
Example 1 - To monitor the SSL traffic:
Chris notices on the Circle Pack that one instance has a low instance score and that instance is in "Critical" state. He clicks the instance to see what the issue is. The instance summary displays that there is an SSL card failure on that instance and therefore that instance is unable to process SSL traffic (the SSL traffic has reduced). Chris extracts that information and sends a report to the team to look into the issue immediately.
Example 2 - To monitor configuration changes:
Chris also notices that another instance is in "Review" state and that there has been a config deviation recently. When he clicks the config deviation risk indicator, he notices that RC4 Cipher, SSL v3, TLS 1.0, and TLS 1.1 related configuration changes have been made which might be due to security concerns. He also notices that the SSL transaction traffic profile for this instance has gone down. He exports this report and sends it to the admin to inquire further.