
Generate reports for load balancing entities
NetScaler Console allows you to view the reports of Citrix Application Delivery Controller (NetScaler) instance entities at all levels. There are two types of reports that you can download in NetScaler Console > Network Functions - consolidated reports and individual reports.
Consolidated reports: You can download and view a consolidated or a summarized report for all entities that are managed on NetScaler instances.
This report allows you to have a high-level view of the mapping between the NetScaler instances, partitions, and the corresponding load balancing entities (virtual servers, service groups, and services) that are present in the network.
The following image shows an example of a summarized report.

The consolidated report is in a CSV format. The entries in each column are described as follows:
-
NetScaler IP Address: IP address of the NetScaler instance is displayed in the report
-
NetScaler HostName: Host name is displayed in the report.
-
Partition: IP address of the administrative partition is displayed
-
Virtual Server: \<name\_of\_the\_virtual\_server\>#virtual\_IP\_address:port\_number
-
Services: \<name\_of\_the\_service\>#service-IP\_address:port\_number
-
Service Groups: \<name\_of\_service\_group\>#server\_member1\_IP\_address:port,server\_member2\_IP\_address:port,server\_member3\_IP\_address:port,………..,server\_membern\_IP\_address:port
Note
-
If there is no host name available, the corresponding IP address is displayed.
-
Blank columns indicate that the respective entities are not configured for that NetScaler instance.
Individual reports: You can also download and view independent reports of all instances and entities. For example, you can download a report for only load balancing virtual servers or load balancing services or load balancing service groups.
NetScaler Console allows you to download the report instantly. You can also schedule the report to be generated at a fixed time once a day, once a week, or once a month.
Related information
Generate a combined load balancing report
-
In NetScaler Console, navigate to Infrastructure > Network Functions.
-
Click Generate Report.
-
On the Generate Report page that opens, you have two options to view the report:
-
On the Export Now tab, select Load Balancing and click OK.The consolidated report downloads to your system.
-
Select Schedule Report to create a schedule for generating and exporting reports at regular intervals. Specify the report generation recurrence settings and create an email profile to which the report is exported.
-
Select Enable Schedule.
-
Recurrence - select Daily, Weekly, or Monthly from the list.NoteIf you select Weekly recurrence, ensure that you select the weekdays on which you want the report to be scheduled.
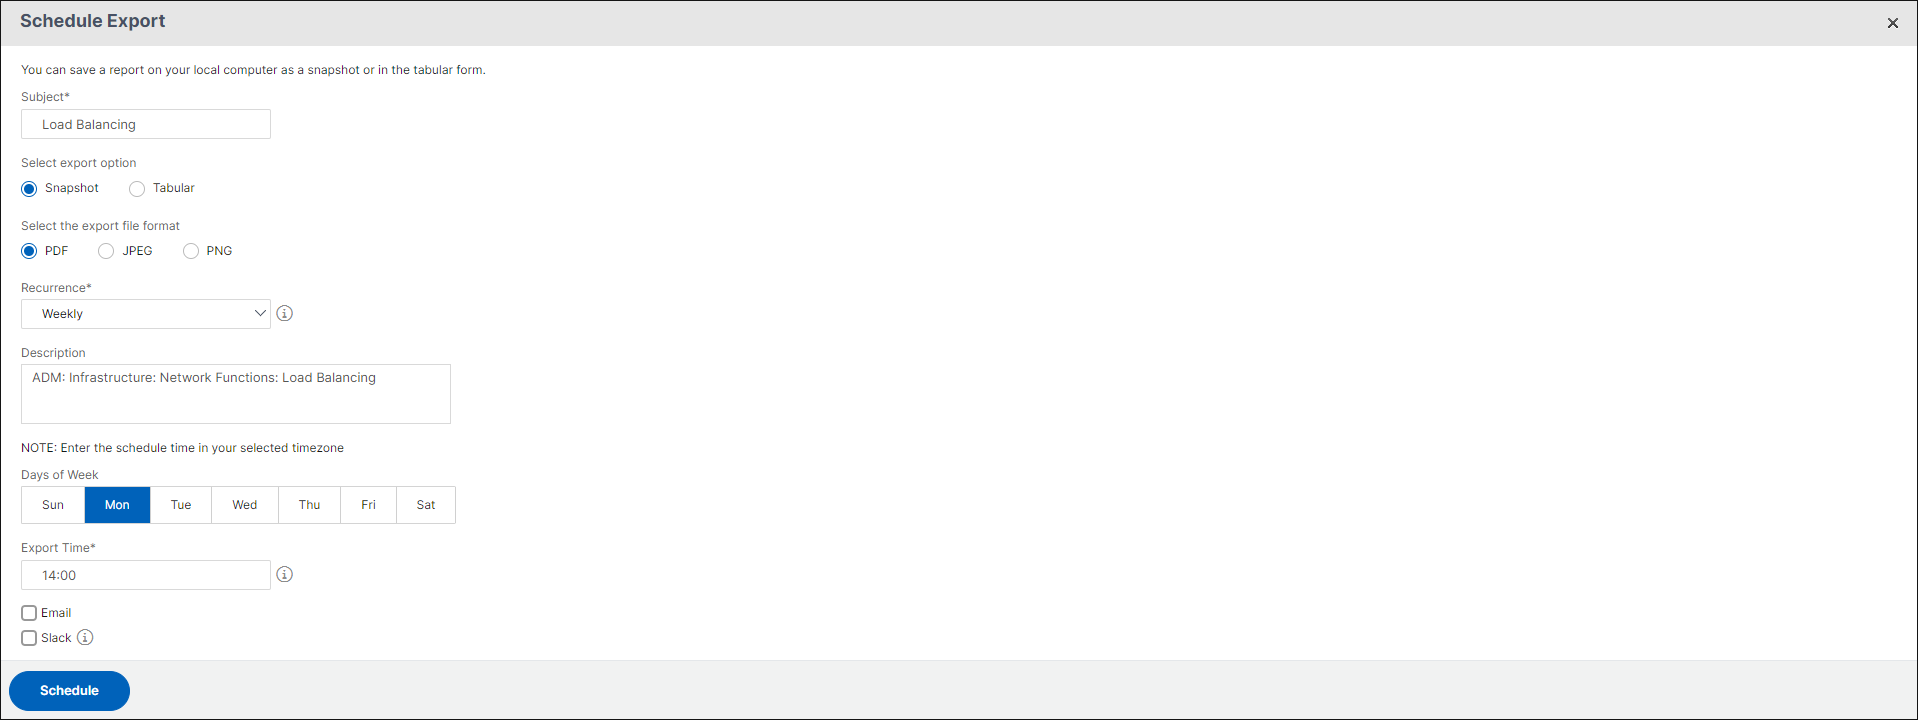 NoteIf you select Monthly recurrence, ensure that you enter days of month, with the values between 1 and 31.
 -
Export time - Enter the time in the Hour: Minute in 24-hour format.
-
Email - check the check-box and then select a profile from the list, or click Add to create an email profile.
-
Slack - Select the Slack check box and then select a profile from the list box, or click Add to create a slack profile.
-
Click Schedule to complete the process.
-
-
Generate an individual load balancing entity report
You can generate and export an individual report for a particular type of entity associated with the instances. For example, consider a scenario where you want to see a list of all load balancing services in the network.
-
In NetScaler Console, navigate to Infrastructure > Network Functions > Load Balancing > Services.
-
On Services page, click the Export button at the top right-hand corner.
 Select Export Now tab if you want to generate and view the report at this instant.NoteYou can only download the reports or export the reports as mail attachments. You cannot view the reports on the NetScaler Console GUI.