
View instance details in Infrastructure Analytics
-
Navigate to Infrastructure > Infrastructure Analytics.
-
Click the circle pack view and select the IP address.
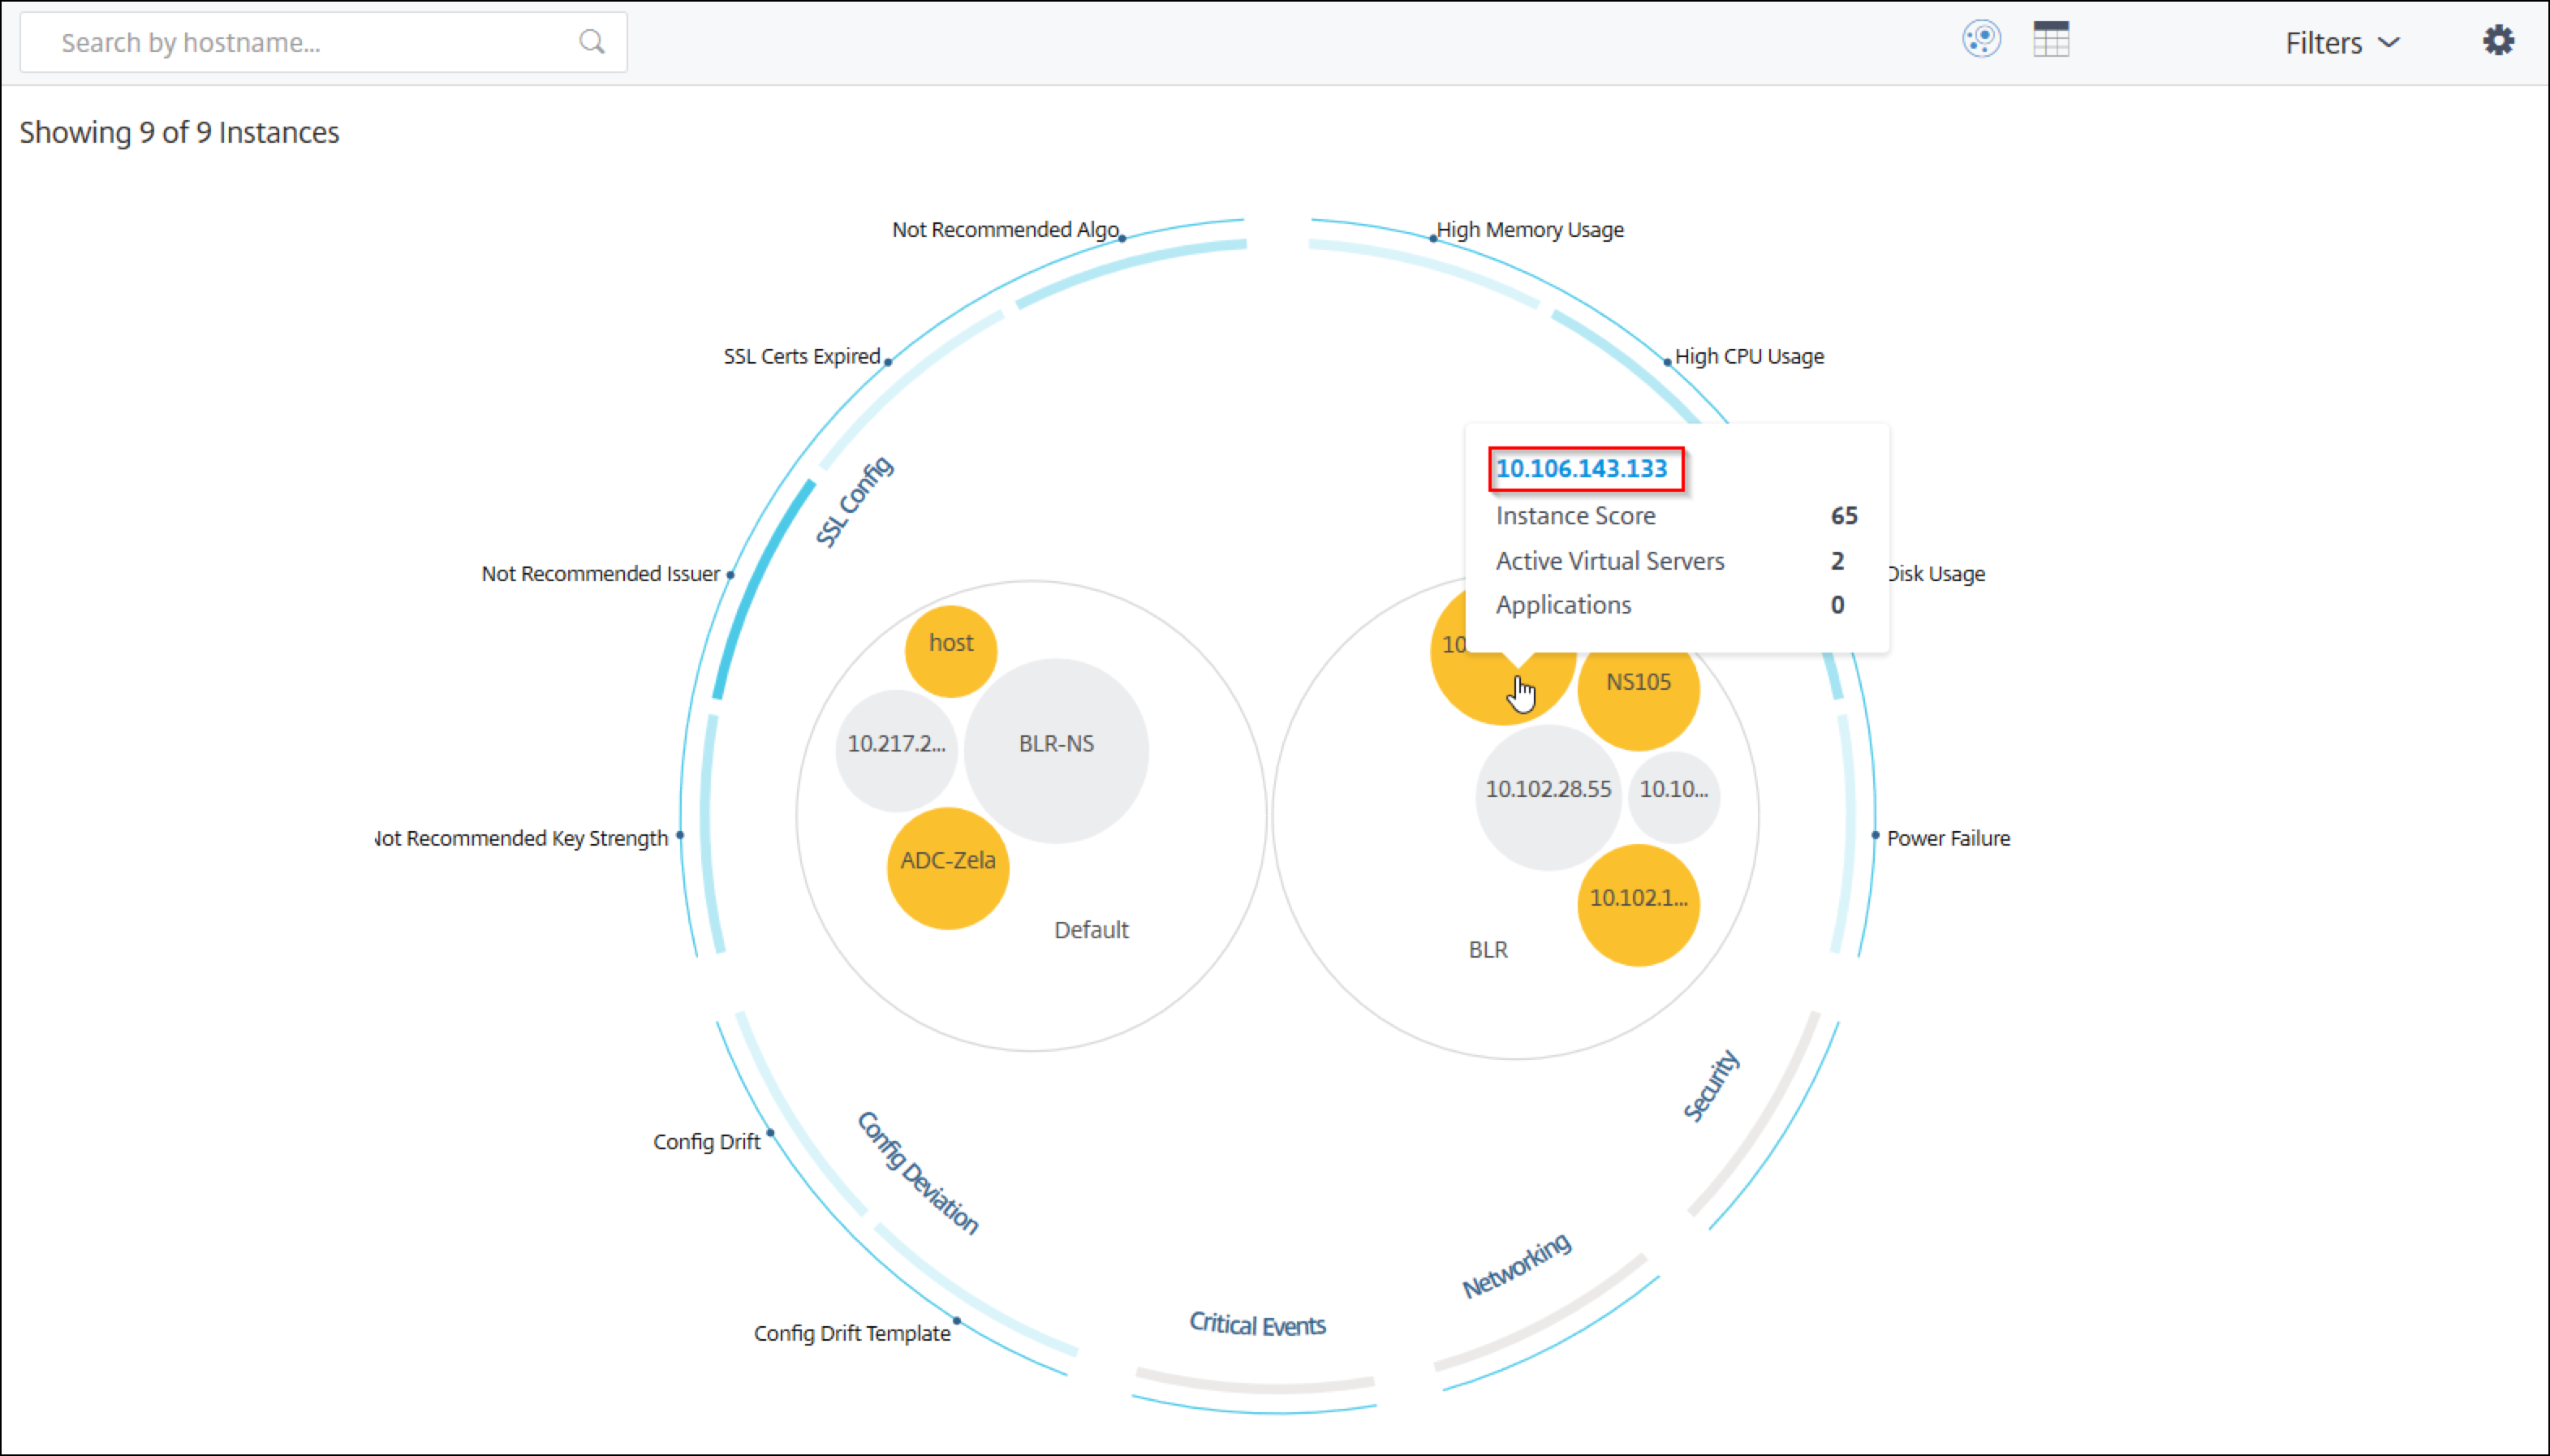 You can also click an IP address from the table view.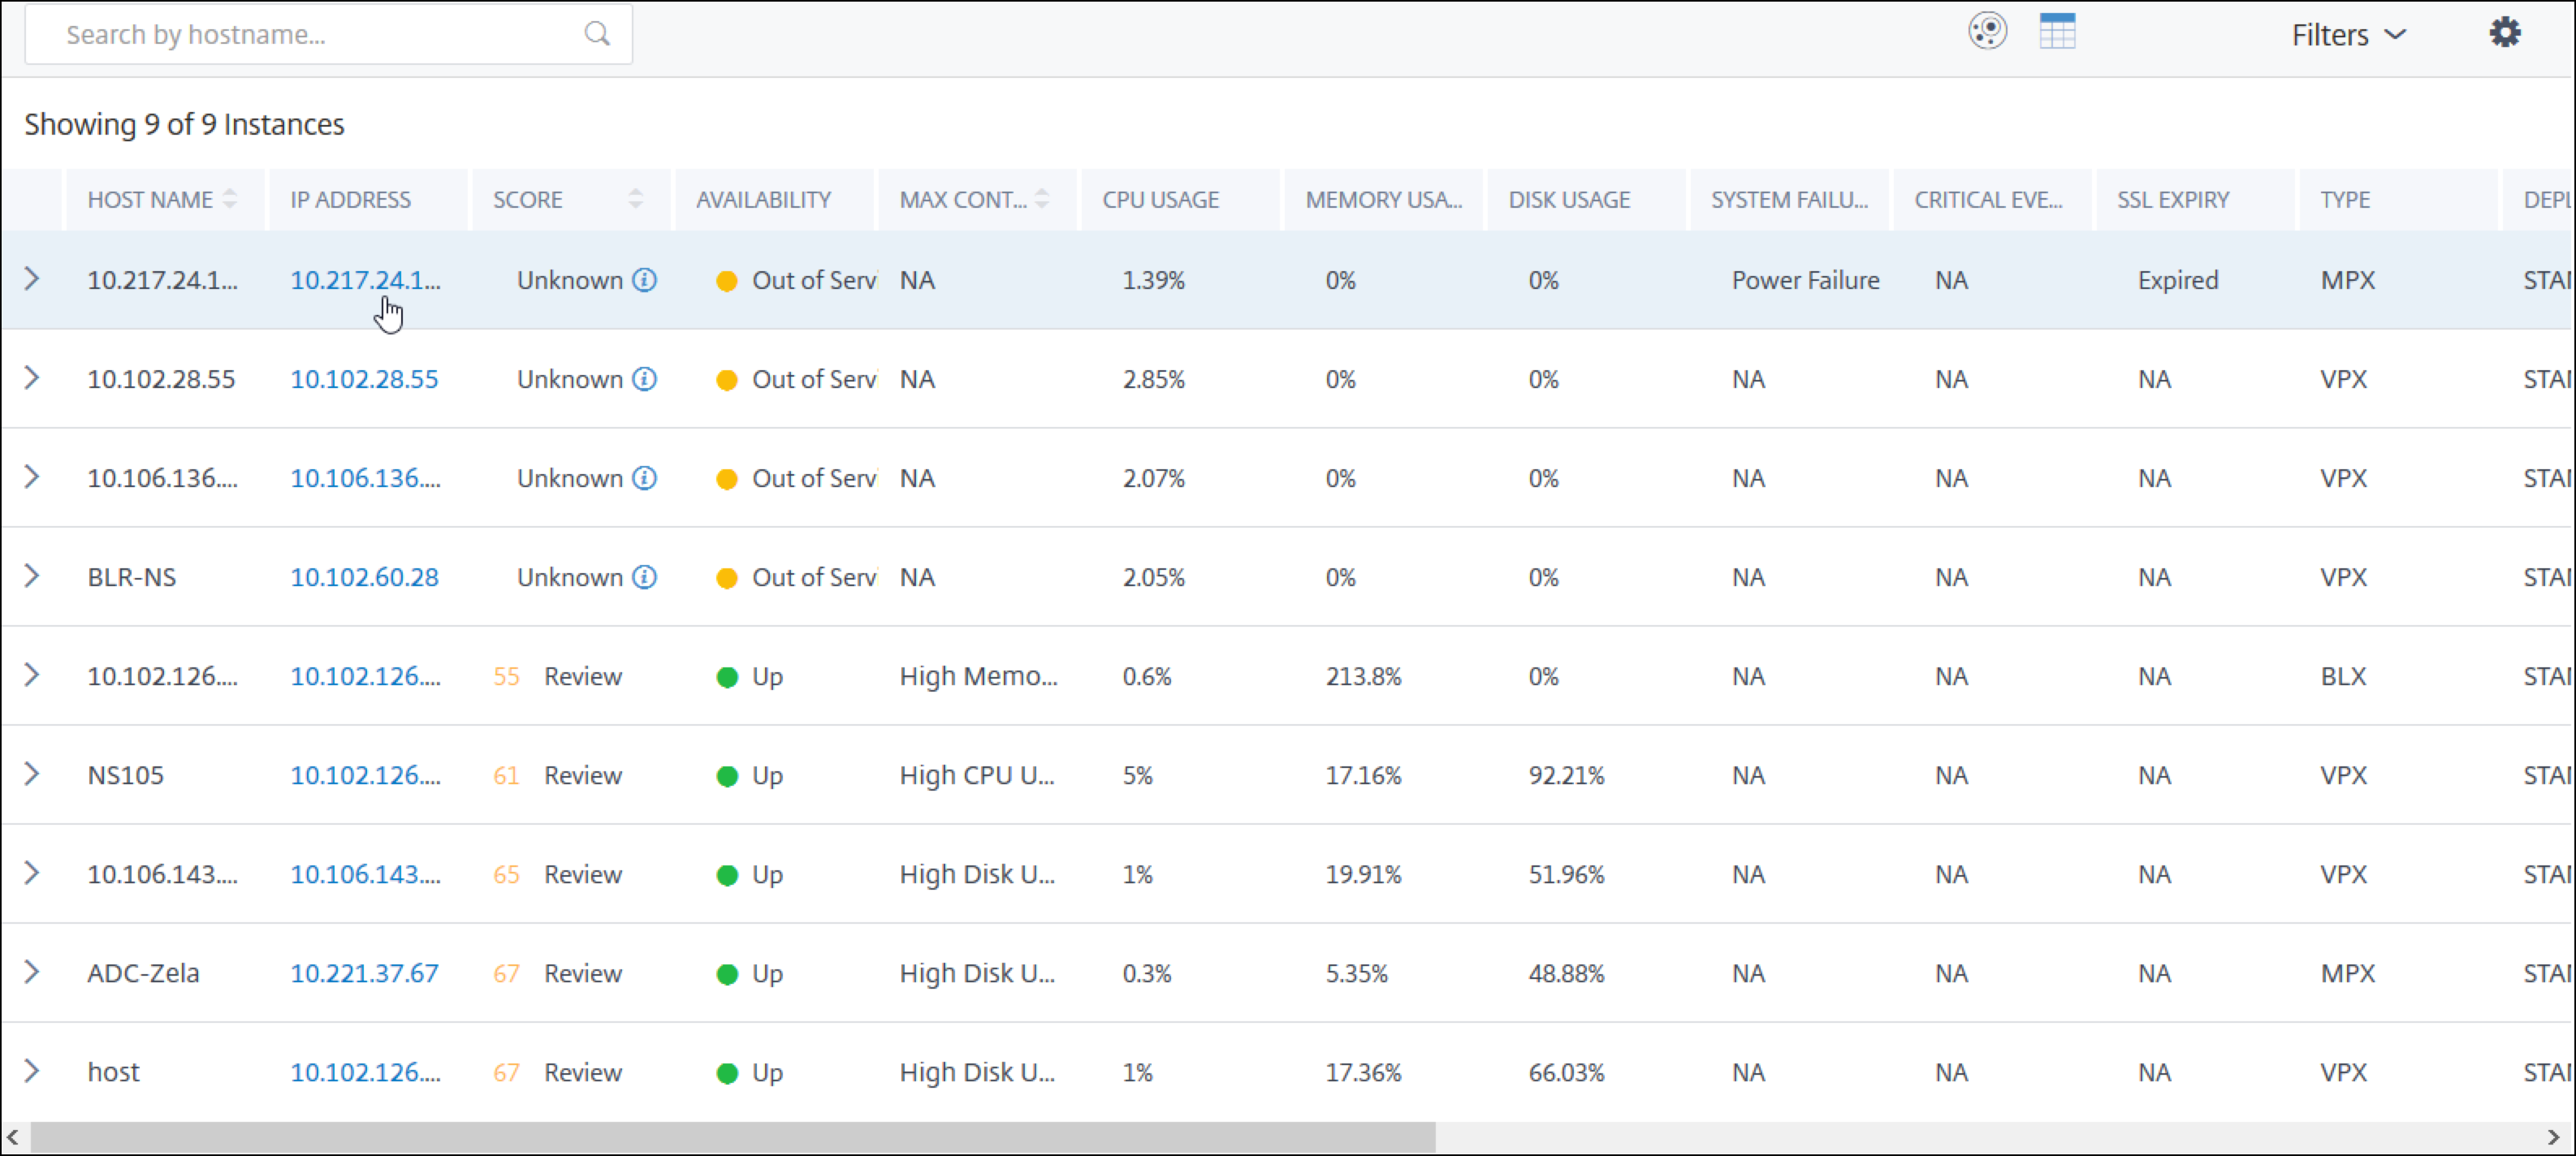
-
Host name – Denotes the host name assigned to the {{page.citrix-adc-generic}} instance
-
IP address – Denotes the IP address of the {{page.citrix-adc-generic}} instance
-
Score – Denotes the {{page.citrix-adc-generic}} instance score and the status such as Critical, Good, and Fair
-
Availability – Denotes the current status of the {{page.citrix-adc-generic}} instance such as Up, Down, or Out of service.
-
Max Contribution – Denotes the issue category that the {{page.citrix-adc-generic}} instance has the maximum error counts.
-
CPU usage – Denotes the current CPU % used by the instance
-
Memory usage – Denotes the current memory % used by the instance
-
Disk usage – Denotes the current disk % used by the instance
-
System Failure – Denotes the total number of errors for the instance system
-
Critical Events – Denotes the event category that the {{page.citrix-adc-generic}} instance has the maximum events
-
SSL expiry – Denotes the current status of the SSL certificate installed on the {{page.citrix-adc-generic}} instance
-
Type – Denotes the {{page.citrix-adc-generic}} instance type such as VPX, SDX, MPX, or CPX
-
Deployment – Denotes if the {{page.citrix-adc-generic}} instance is deployed as a standalone instance or HA pair
-
Model – Denotes the {{page.citrix-adc-generic}} instance model number
-
Version – Denotes the {{page.citrix-adc-generic}} instance version and build number
-
Throughput – Denotes the current network throughput from the {{page.citrix-adc-generic}} instance
-
HTTPS request/sec – Denotes the current HTTPS requests/sec received by the {{page.citrix-adc-generic}} instance
-
TCP connection – Denotes the current TCP connections established
-
SSL transaction – Denotes the current SSL transactions processed by the {{page.citrix-adc-generic}} instance
-
Site – Denotes the name of the site that the {{page.citrix-adc-generic}} instance is deployed.
Note:
For every 5 minutes, the current values for CPU usage, memory usage, disk usage, throughput, and so on are updated.
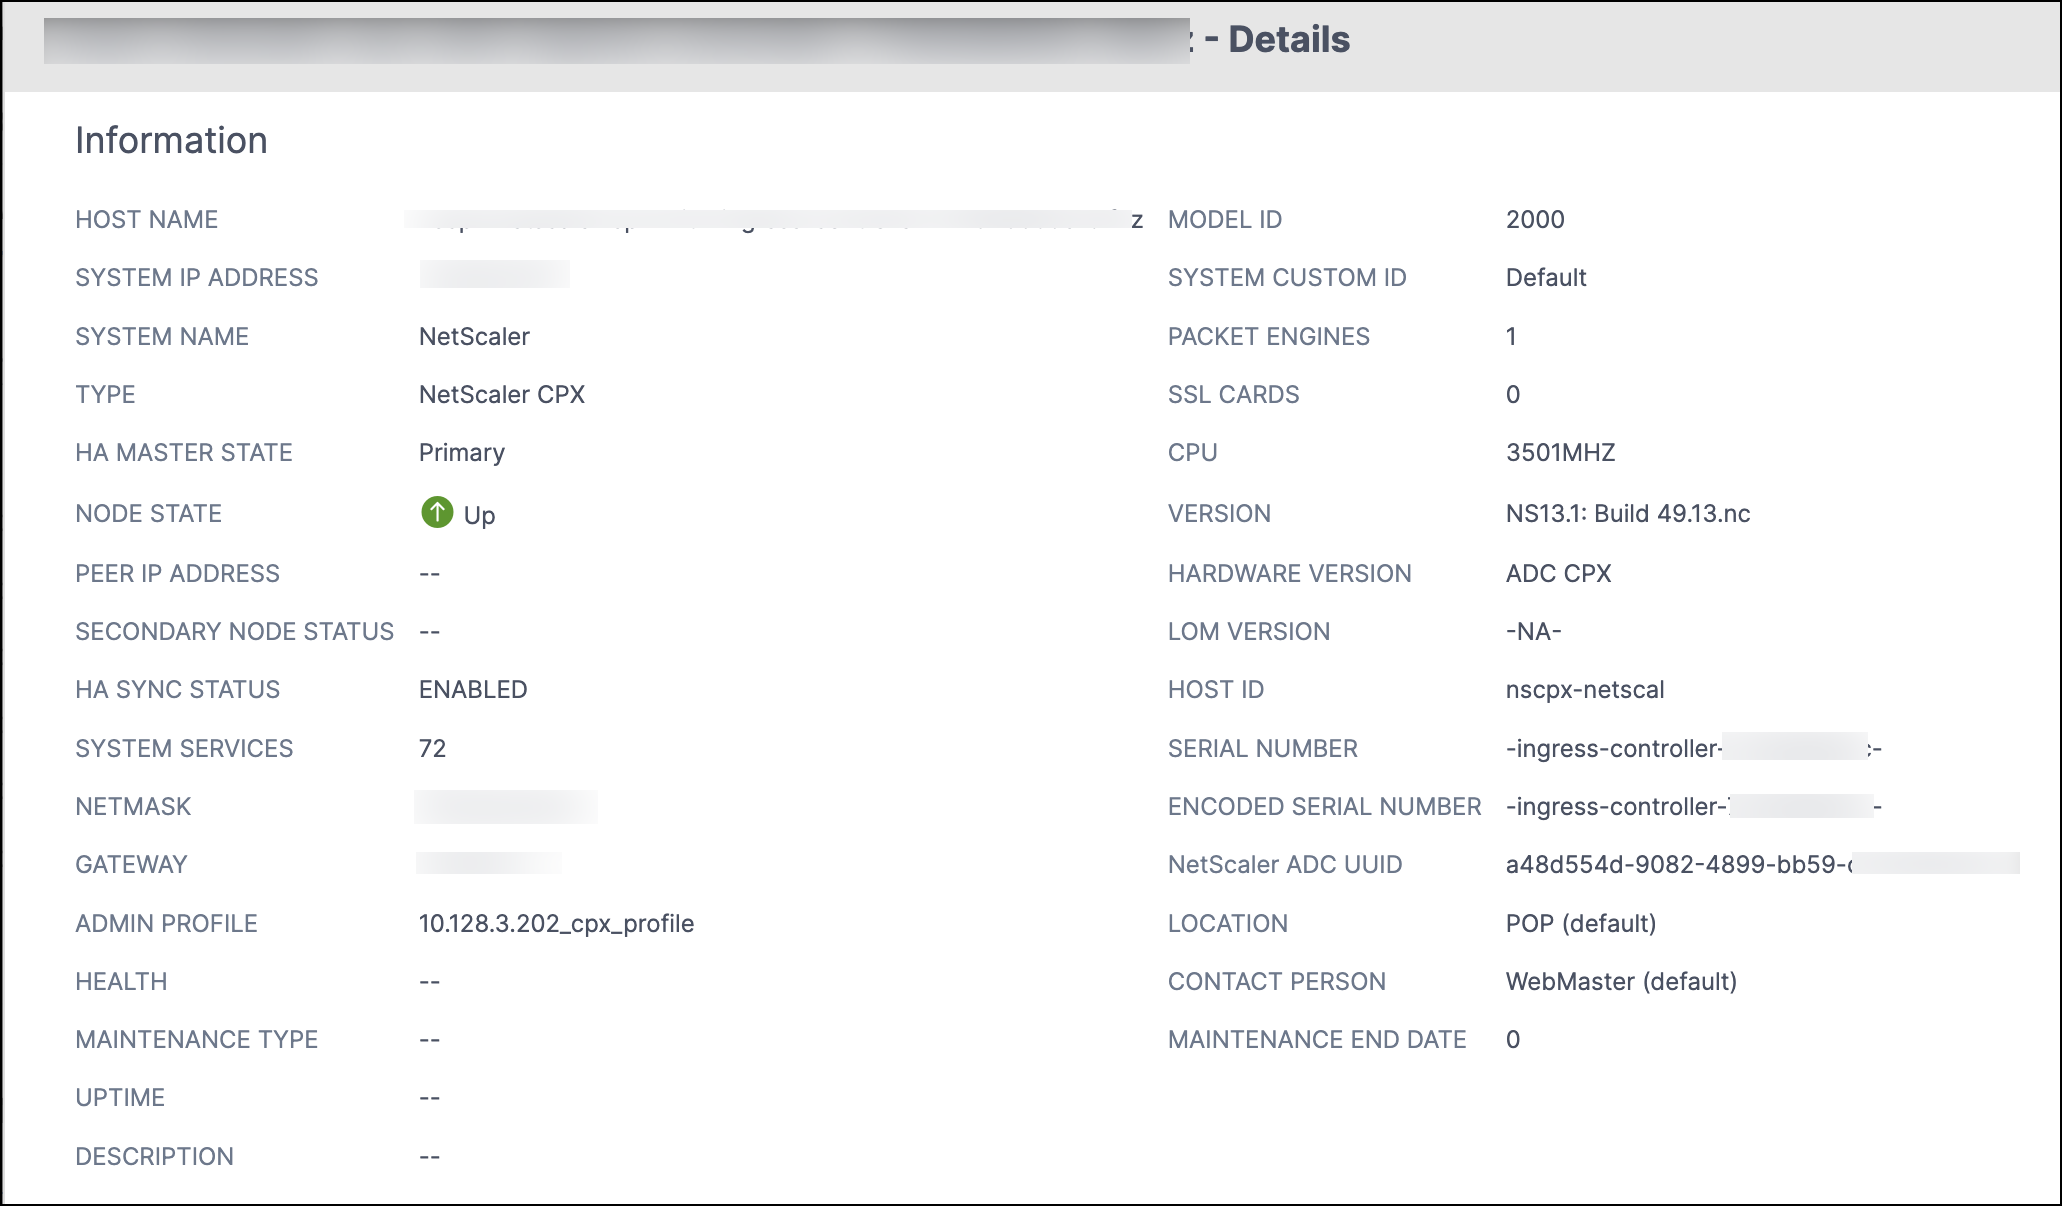
Click an IP address and in the page that appears, click Instance Details to view the instance details.

The following details are displayed:
-
Information - Instance details such as instance type, deployment type, version, model, and so on.
-
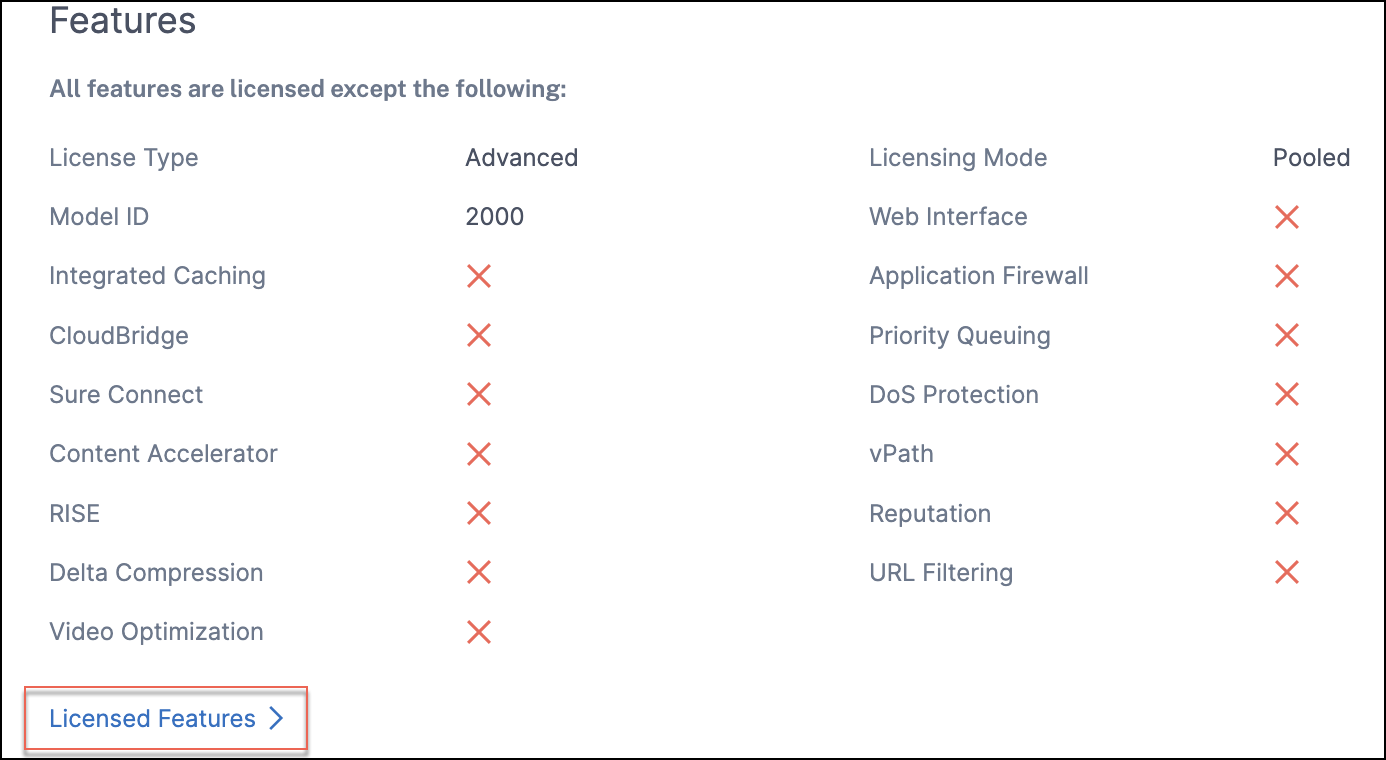
Features – By default, the features that are not licensed are displayed. Click Licensed Features to view the features that are licensed.
-
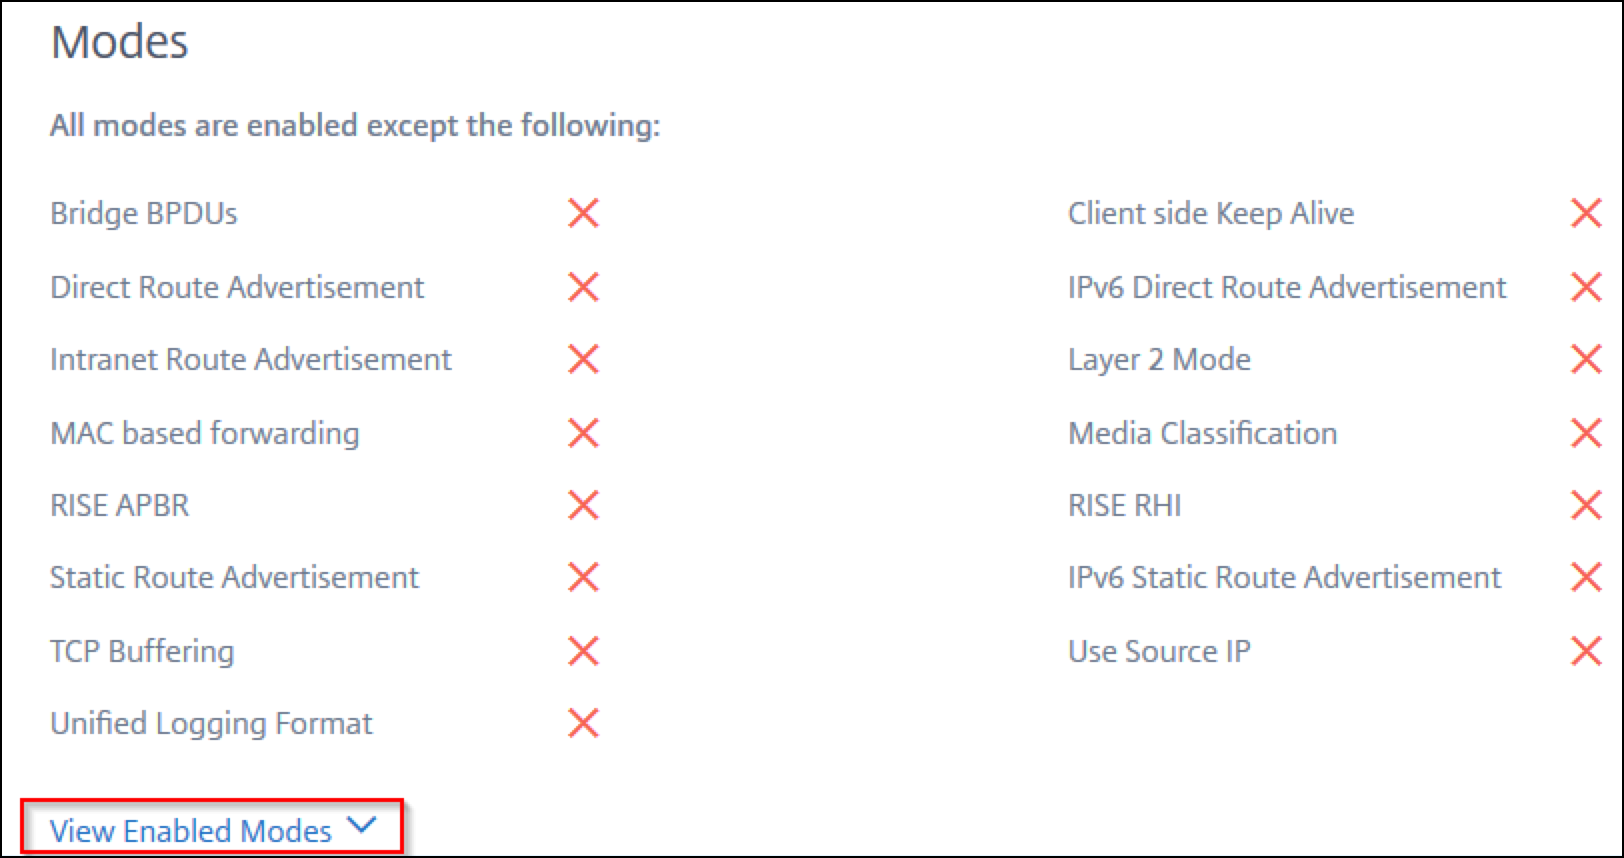
Modes – By default, all modes that are disabled on the instance are displayed. Click View Enabled Modes to view the enabled modes on the instance.
The instance dashboard presents an instance overview where you can see the following details:
-
Instance score
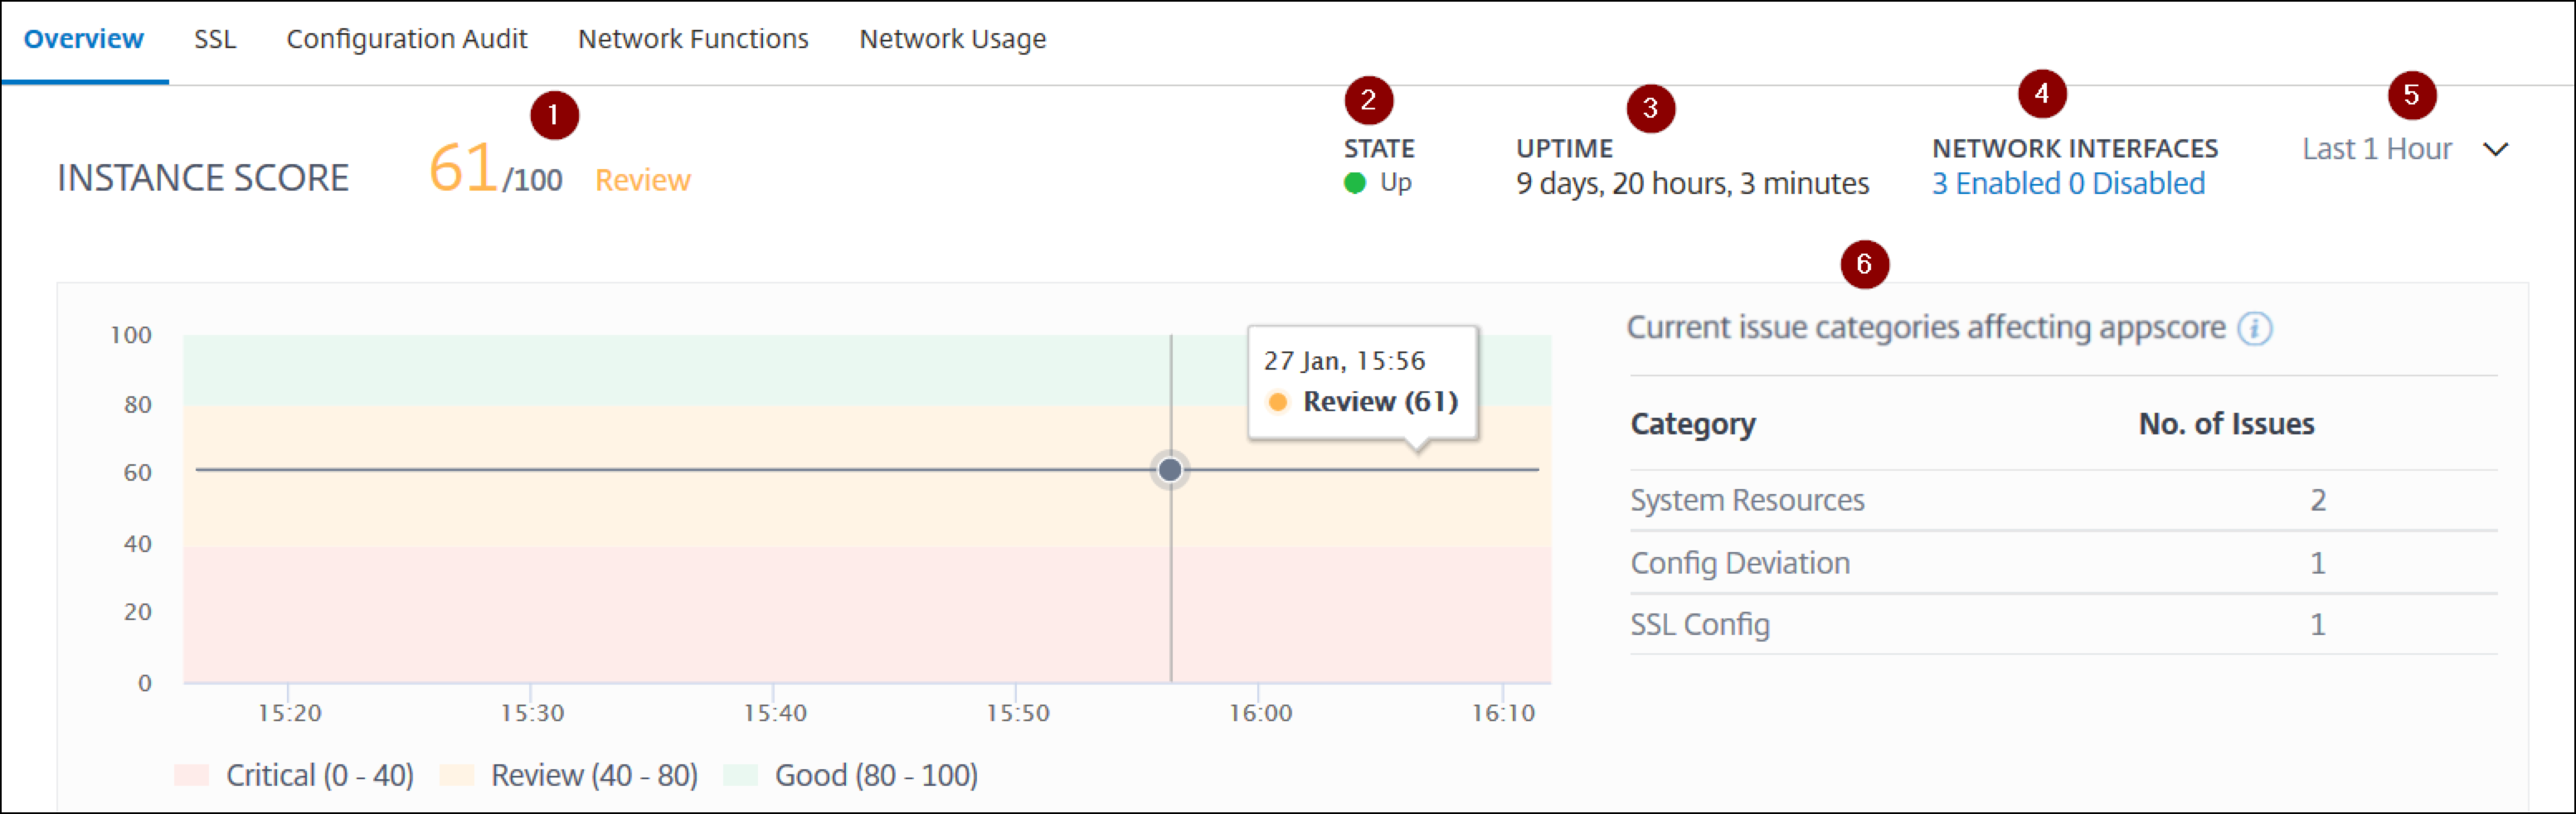 1 – Indicates the current {{page.citrix-adc-generic}} instance score for the selected time duration. The final score is calculated as 100 minus total penalties. The graph displays the score ranges for the selected time duration.2 – Indicates the current status of the {{page.citrix-adc-generic}} instance, such as Up, Down, and Out of Service.3 – Indicates the duration that the {{page.citrix-adc-generic}} instance is up and running.4 – Indicates the total network interfaces enabled and disabled for the instance. Click Enabled or Disabled to view the details such as network interface name and the status (enabled or disabled).5 – Select the time duration from the list to view the instance details.6 – Displays the total issues and issue category of the {{page.citrix-adc-generic}} instance.
 -
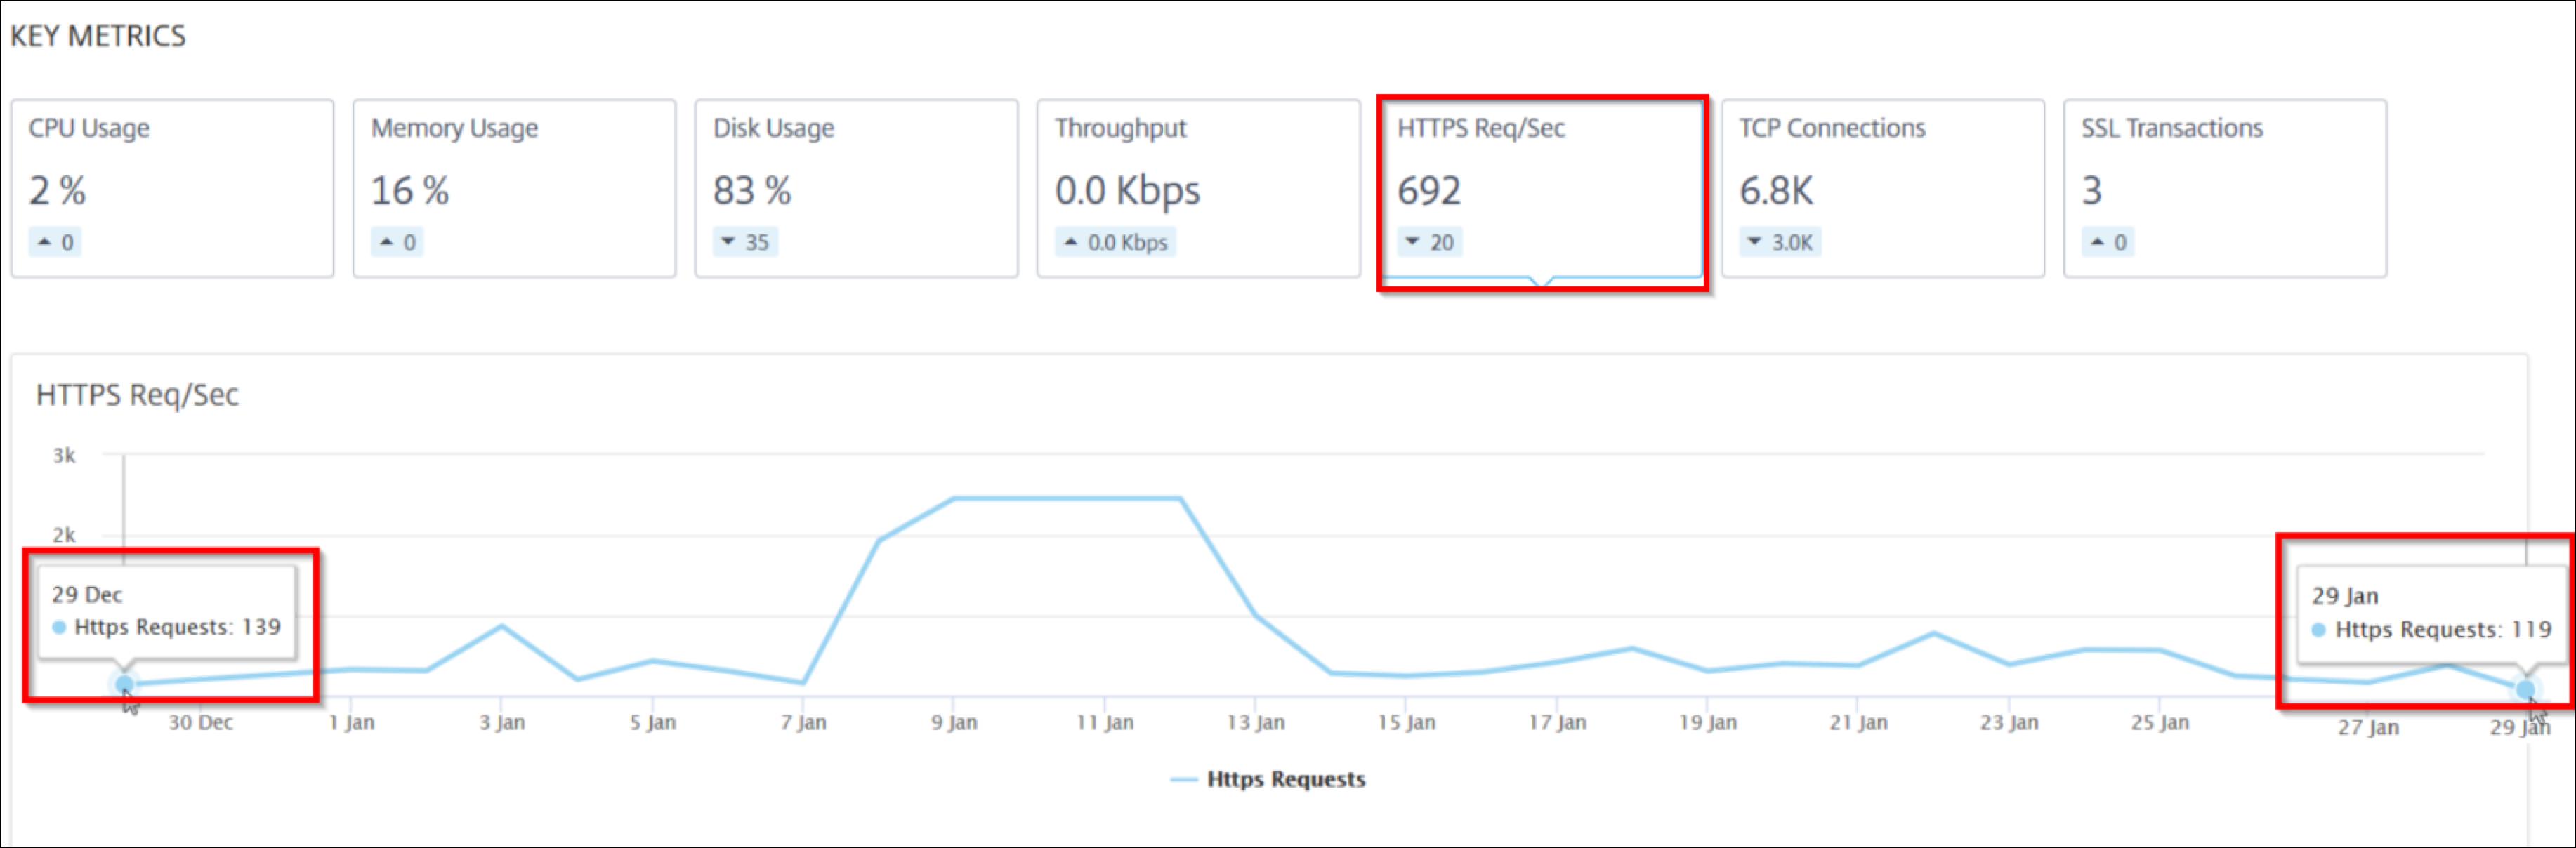
Key MetricsClick each tab to view the details. In each metric, you can view the average value and the difference value for the selected time.The following image is an example for HTTPS Req/Sec and the selected time duration is 1 hour. The value 692 is the average HTTPS Req/Sec for the 1-month duration and the value 20 is the difference value. In the graph, the first value is 139 and the last value is 119. The difference value is 139 – 119 = 20.
 You can view the following instance metrics in a graph format for the selected time duration:
-
CPU Usage – The average CPU % from the instance for the selected duration (displays for both packet CPU and for management CPU).
-
Memory Usage – The average memory usage % from the instance for the selected duration.
-
Disk Usage – The average disk space % from the instance for the selected duration.
-
Throughput – The average network throughput processed by the instance for the selected duration.
-
HTTPS request/sec – The average HTTPs requests received by the instance for the selected duration.
-
TCP connections – The average TCP connections established by the client and server for the selected duration.
-
SSL transactions – The average SSL transactions processed by the instance for the selected duration.
-
-
IssuesYou can view the following issues that occur in {{page.citrix-adc-generic}} instance:
Issue Category Description Issues System Resources Displays all issues related to the {{page.citrix-adc-generic}} system resource such as CPU, Memory, disk usage, and so on. - High CPU Usage - High Memory Usage - High Disk Usage - SSL Card Failures - Power Failure - Disk Error - Flash Error - NIC Discards SSL Config Displays all issues related to the SSL configuration on the {{page.citrix-adc-generic}} instance. - SSL Certs Expired - Not Recommended Issuer - Not Recommended Algo - Not Recommended Key Strength Config Deviation Displays all issues related to the configuration jobs applied in {{page.citrix-adc-generic}} instance. - Config Drift - Running vs Template Critical events Displays all critical events related to {{page.citrix-adc-generic}} instances configured in HA pair and in Cluster. - Cluster Prop Failure - Cluster Sync Failure - Cluster versions Mismatch - HA Bad Sec State - HA No Heat Beats - HA Sync Failure - HA Version Mismatch Capacity issues Displays {{page.citrix-adc-generic}} capacity issues. The {{page.adm-product-name-short}} polls these events every five minutes from the {{page.citrix-adc-generic}} instance and displays the packet drops or rate-limit counter increments if exists. The issues are categorized on the following capacity parameters. - Throughput Limit Reached - PE CPU Limit Reached - PPS Limit Reached - SSL Throughput Rate Limit - SSL TPS Rate Limit Networking Displays the operational issues that occur in the instances. For more information, see Enhanced Infrastructure Analytics with new indicators. Click each tab to analyze and troubleshoot the issue. For example, consider that an instance has the following errors for the selected time duration: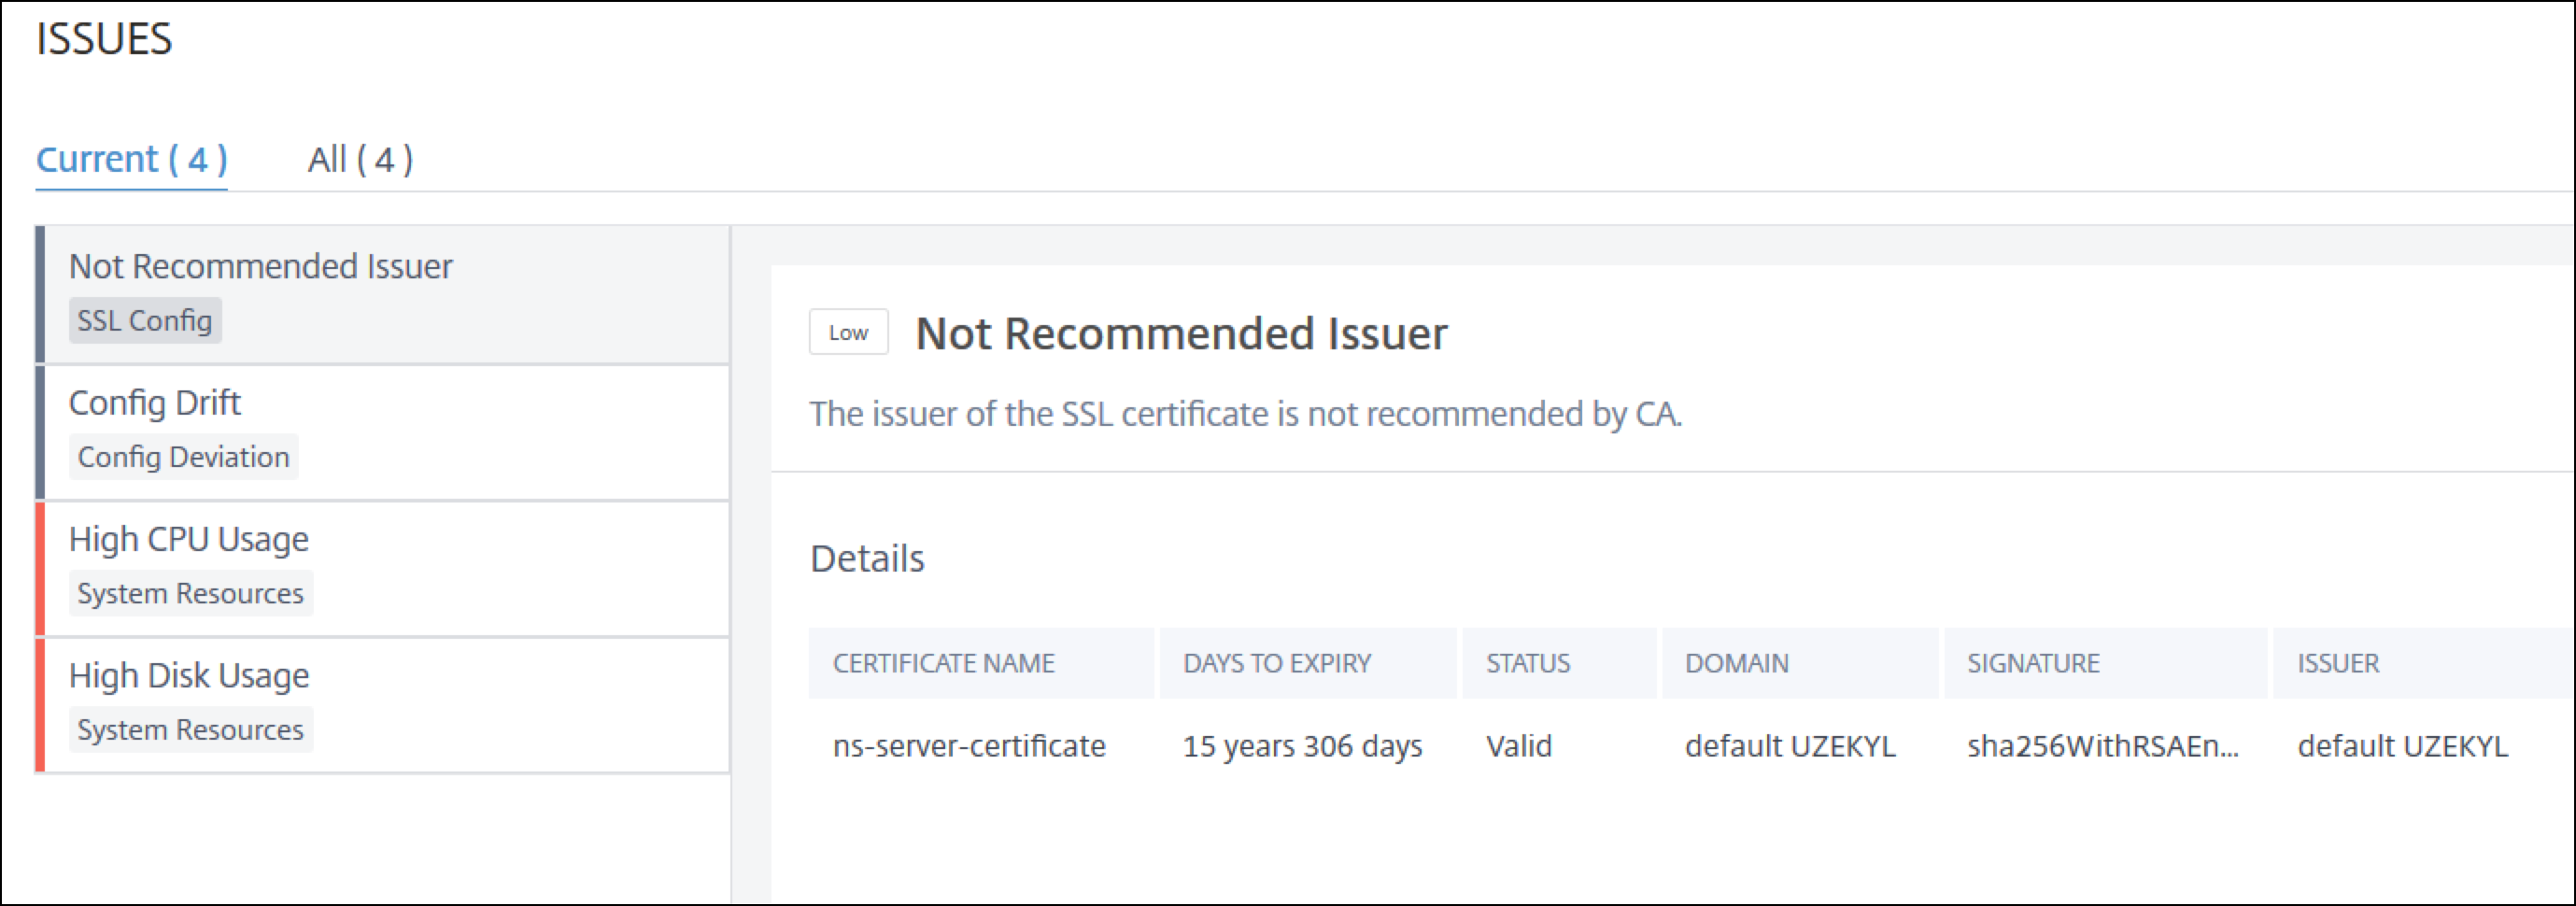
-
The Current tab displays the issues that are currently affecting the instance score.
-
The All tab displays all infra issues detected for the selected duration.
-
Related information