
Performance indicators for application analytics
You can view the performance indicators, along with its categories that occur in NetScaler web applications. To view these indicators, you must ensure to enable analytics and metrics collector on the NetScaler instance:
After you enable analytics and metrics collector, you can view the following indicators by navigating to Applications > Dashboard, selecting an application, and scrolling down to Issues section:
Related information
Response time
This issue detects when the application response time to respond to client requests deviates from the configured threshold value. Click the Response Time tab to view the issue details.
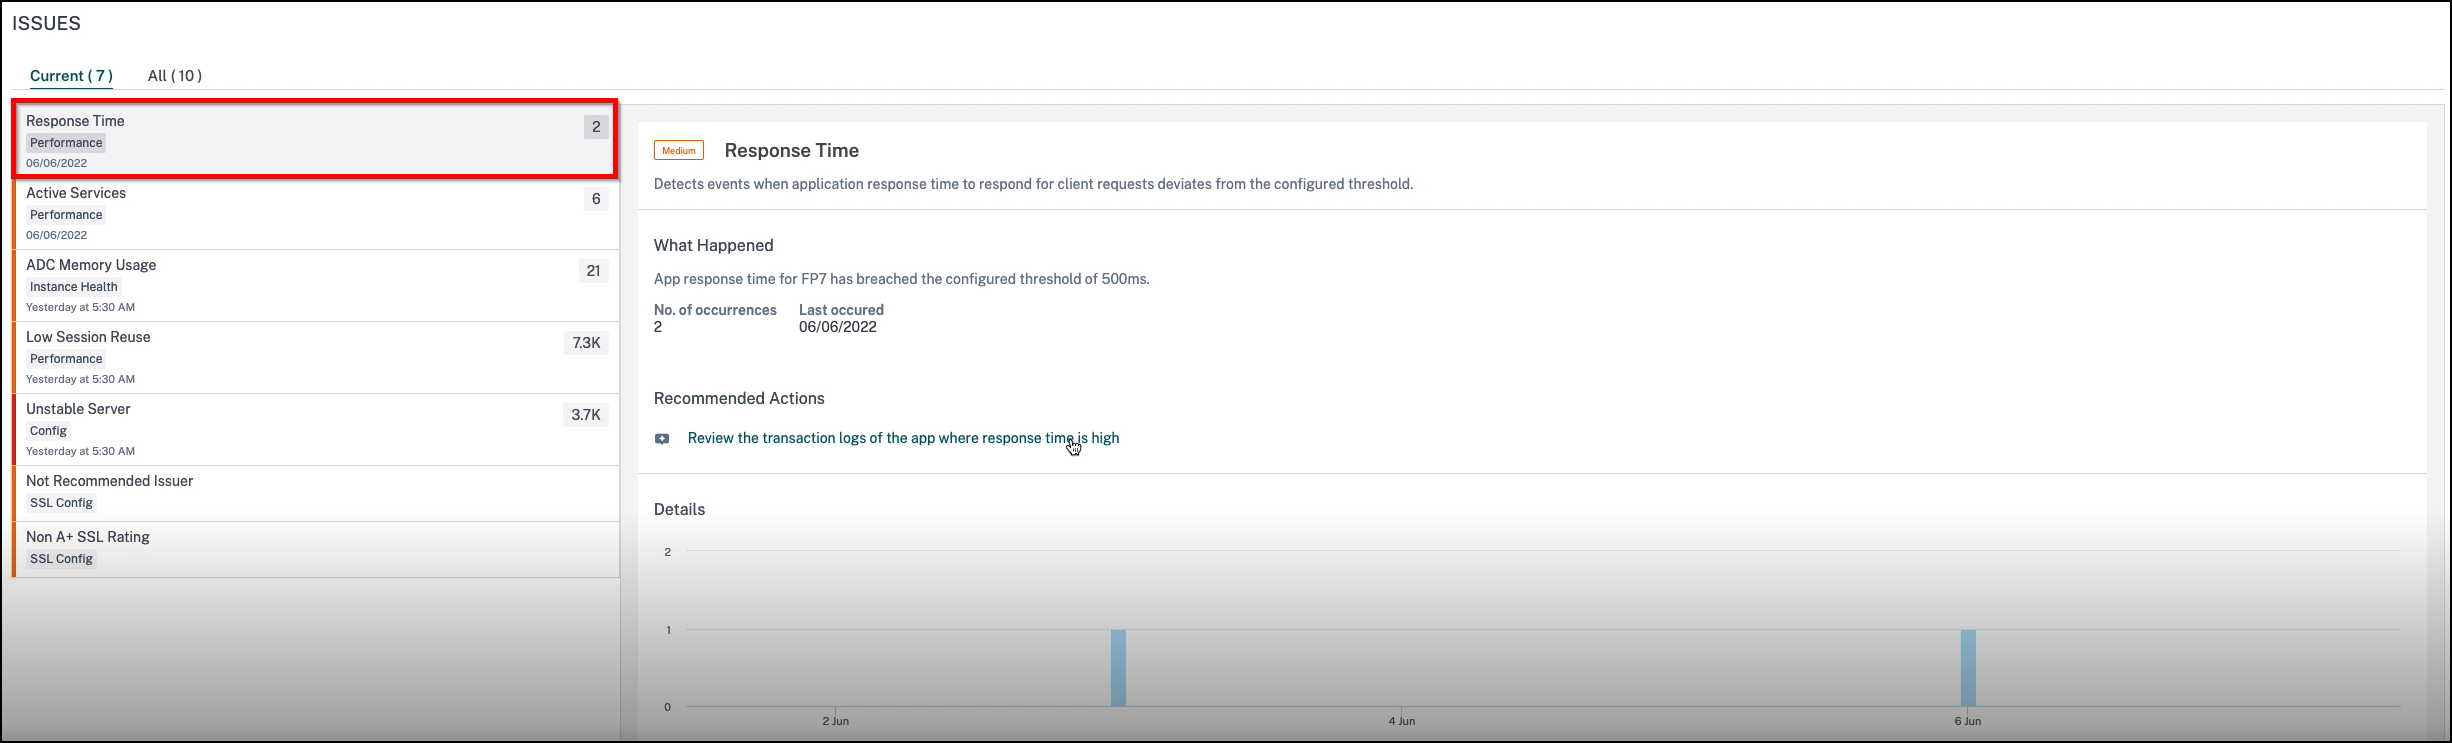
In the Recommended Actions, click to view the Transaction Logs that show the application with > 500 ms response time.
Under Details, you can view:
-
The graph indicating the total events for the selected time. Click to apply filter and view details
-
When the issue has occurred
-
The total occurrences for the selected time
-
The issue severity such as low, medium, and high
-
The detection message indicating the total transaction response time exceeding the configured threshold value.
Active services
This issue detects when the % of active services bound to the virtual server is lesser than the configured threshold value. Click the Active Services tab to view the issue details.
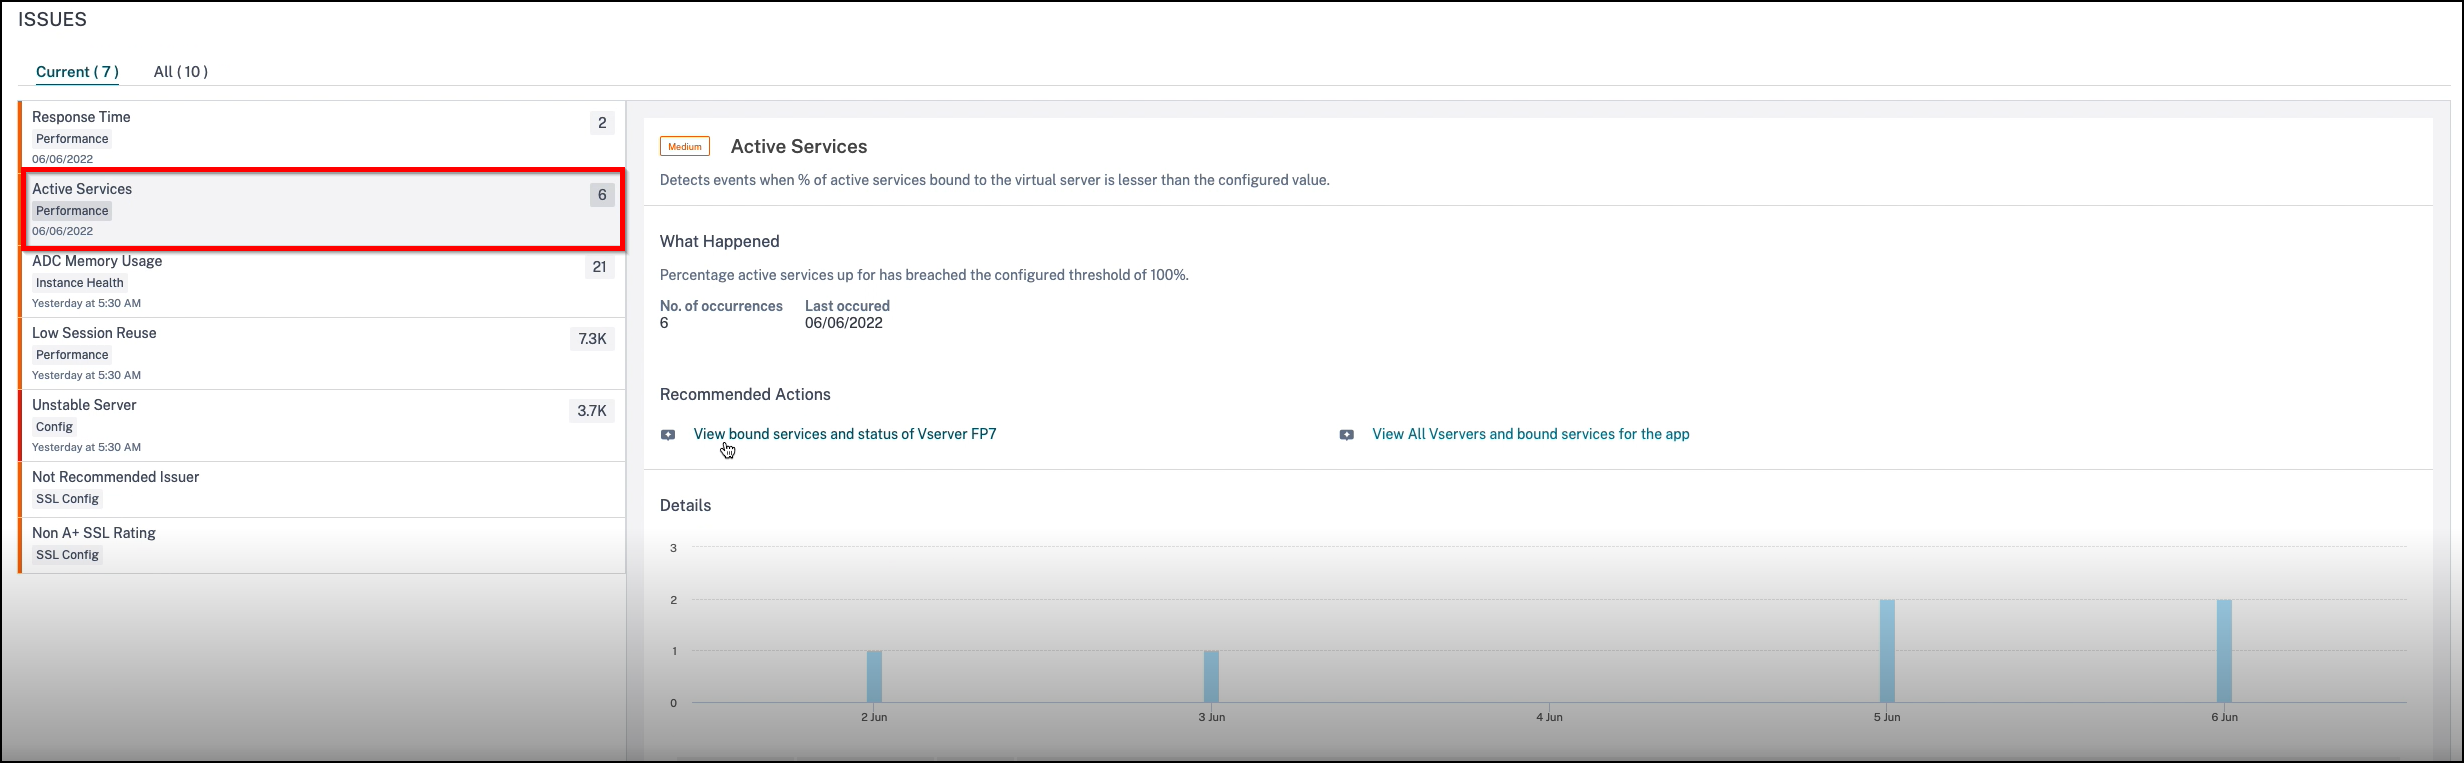
In the Recommended Actions, click to view details of the services bound to the virtual server.
Under Details, you can view:
-
The graph indicating the total events for the selected time duration. Click to apply filter and view details
-
When the issue has occurred
-
The total occurrences for the selected time duration
-
The issue severity such as low, medium, and high
-
The detection message indicating the % of active service sessions and the configured threshold value.
Average CPU usage
This issue detects when the NetScaler CPU usage for this application exceeds the configured threshold value. Click the Average CPU Usage tab to view the issue details.
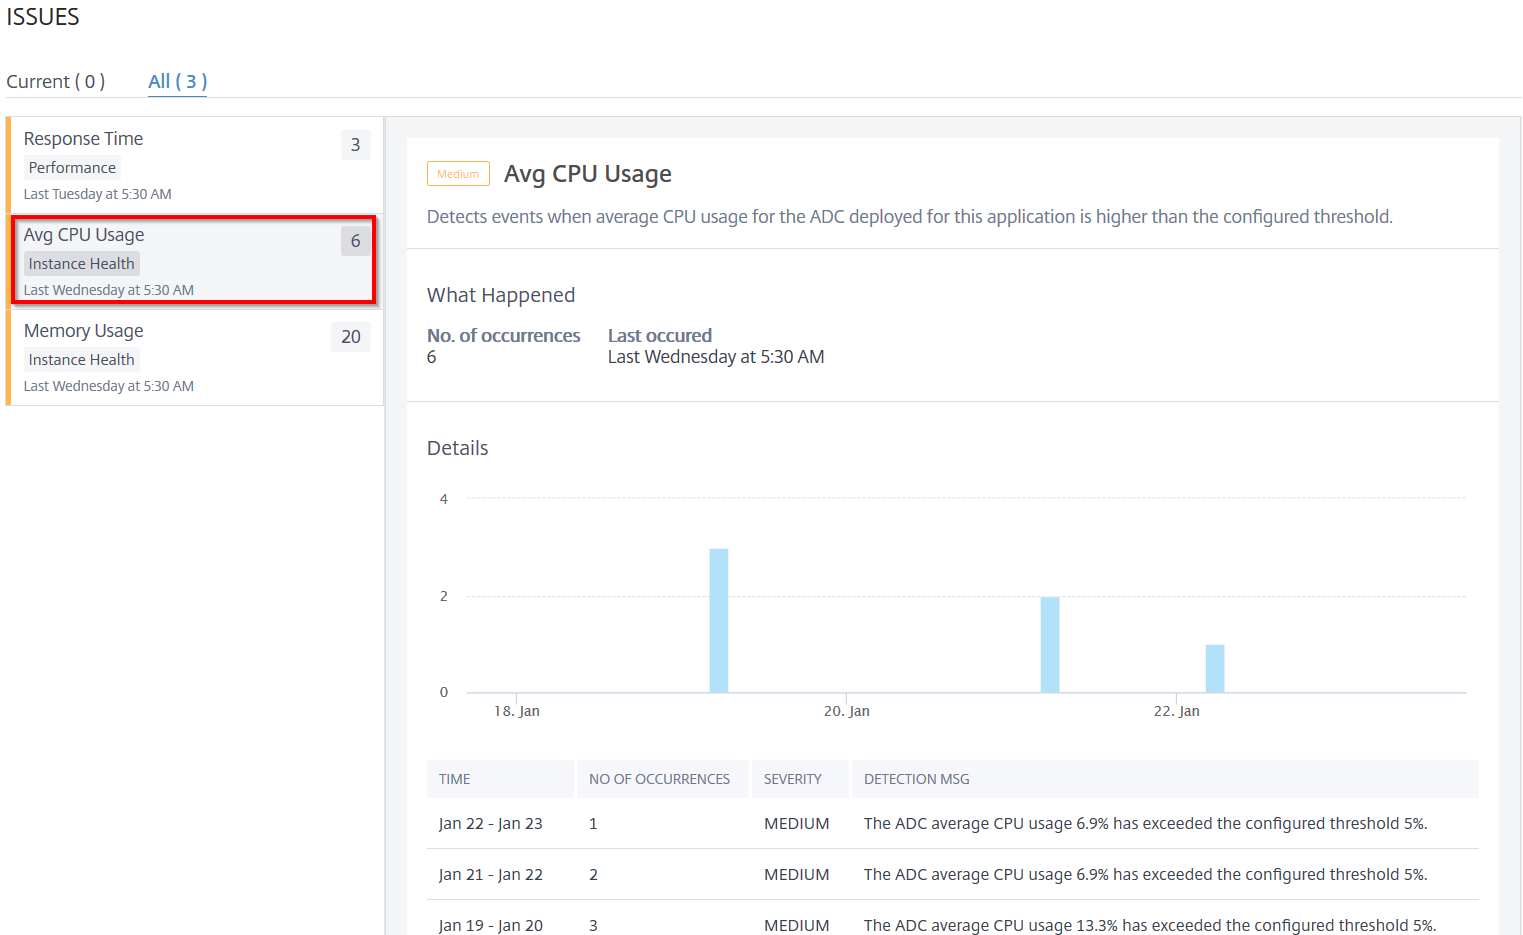
Under Details, you can view:
-
The graph indicating the total events for the selected time duration. Click to apply filter and view details
-
When the issue has occurred
-
The total occurrences for the selected time duration
-
The issue severity such as low, medium, and high
-
The detection message indicating the NetScaler average CPU usage % and the configured threshold value.
Average application CPU usage
This issue detects when the application CPU usage exceeds the configured threshold value. Click the App CPU Usage tab to view the issue details.
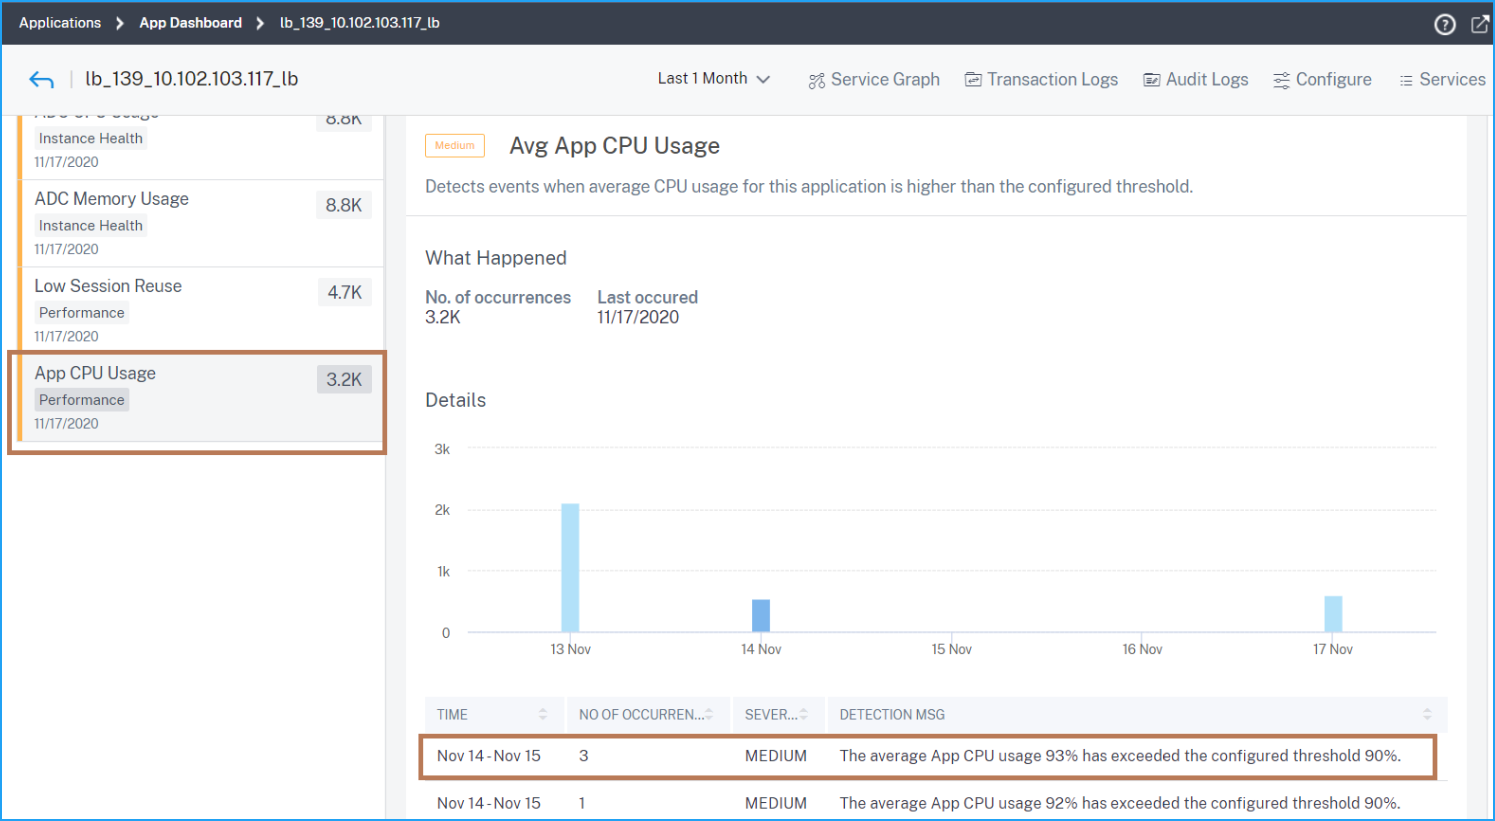
Under Details, you can view:
The graph indicating the total events for the selected time duration. Click to apply filter and view details
-
When the issue has occurred
-
The total occurrences for the selected time duration
-
The issue severity such as low, medium, and high
-
The detection message indicating the application average CPU usage % and the configured threshold value
Memory usage
This issue detects when the NetScaler memory usage for this application exceeds the configured threshold value. Click the Memory Usage tab to view the issue details.
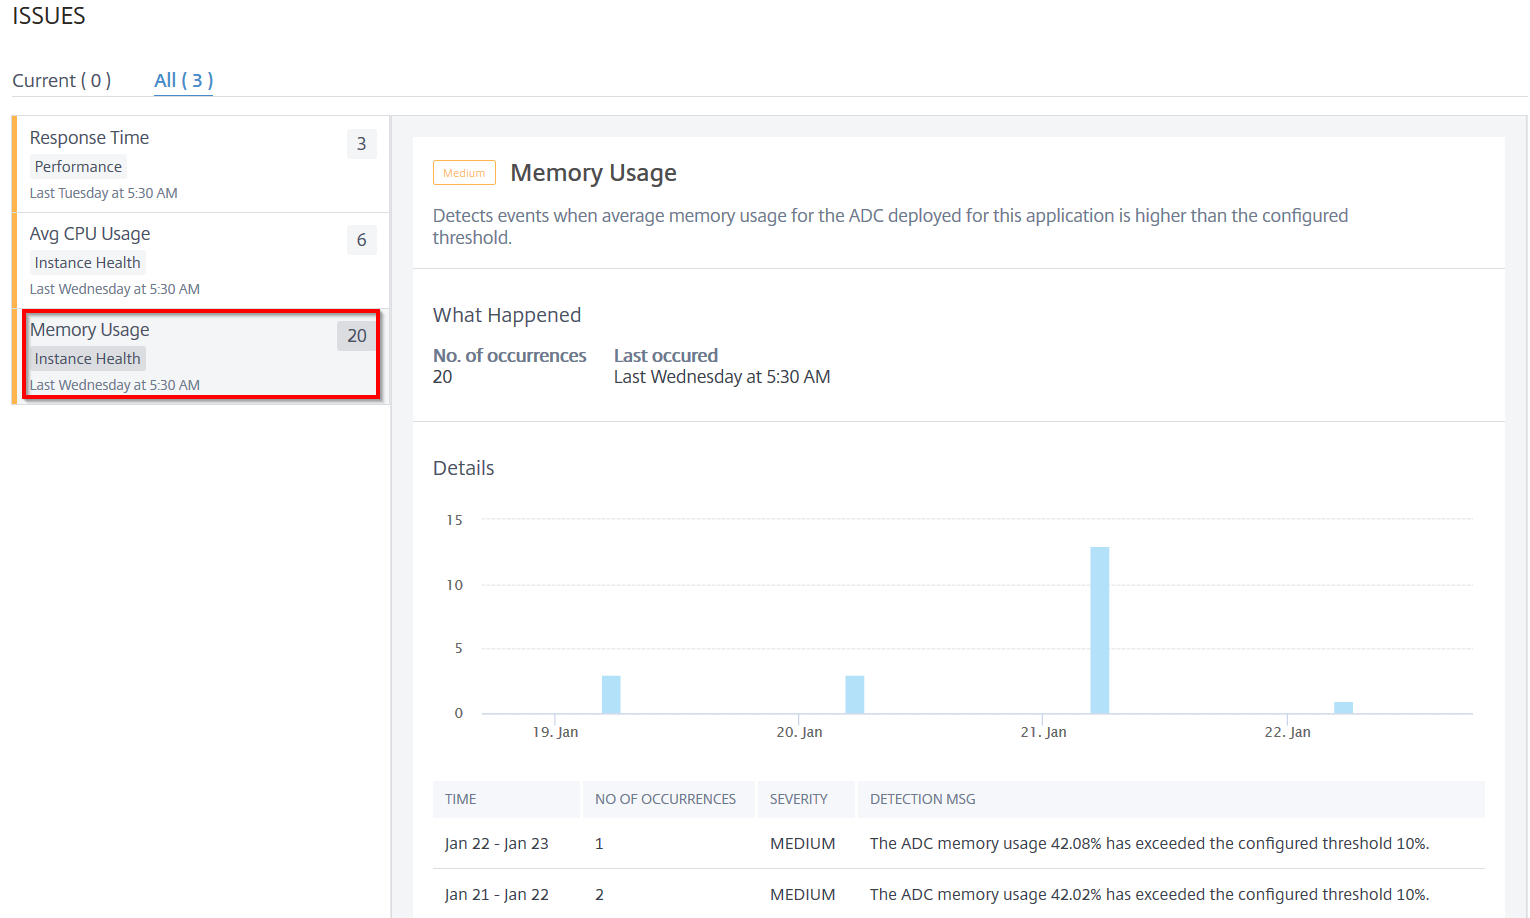
Under Details, you can view:
-
The graph indicating the total events for the selected time duration. Click to apply filter and view details
-
When the issue has occurred
-
The total occurrences for the selected time duration
-
The issue severity such as low, medium, and high
-
The detection message indicating the NetScaler average memory usage % and the configured threshold value.
NIC discards
A packet discard can happen when:
-
A received packet has some format errors
-
A receiving device does not have enough storage for the packets
Using the NIC Discards indicator, you can view total packets discarded from the NIC. Click the NIC Discards tab to view the details.
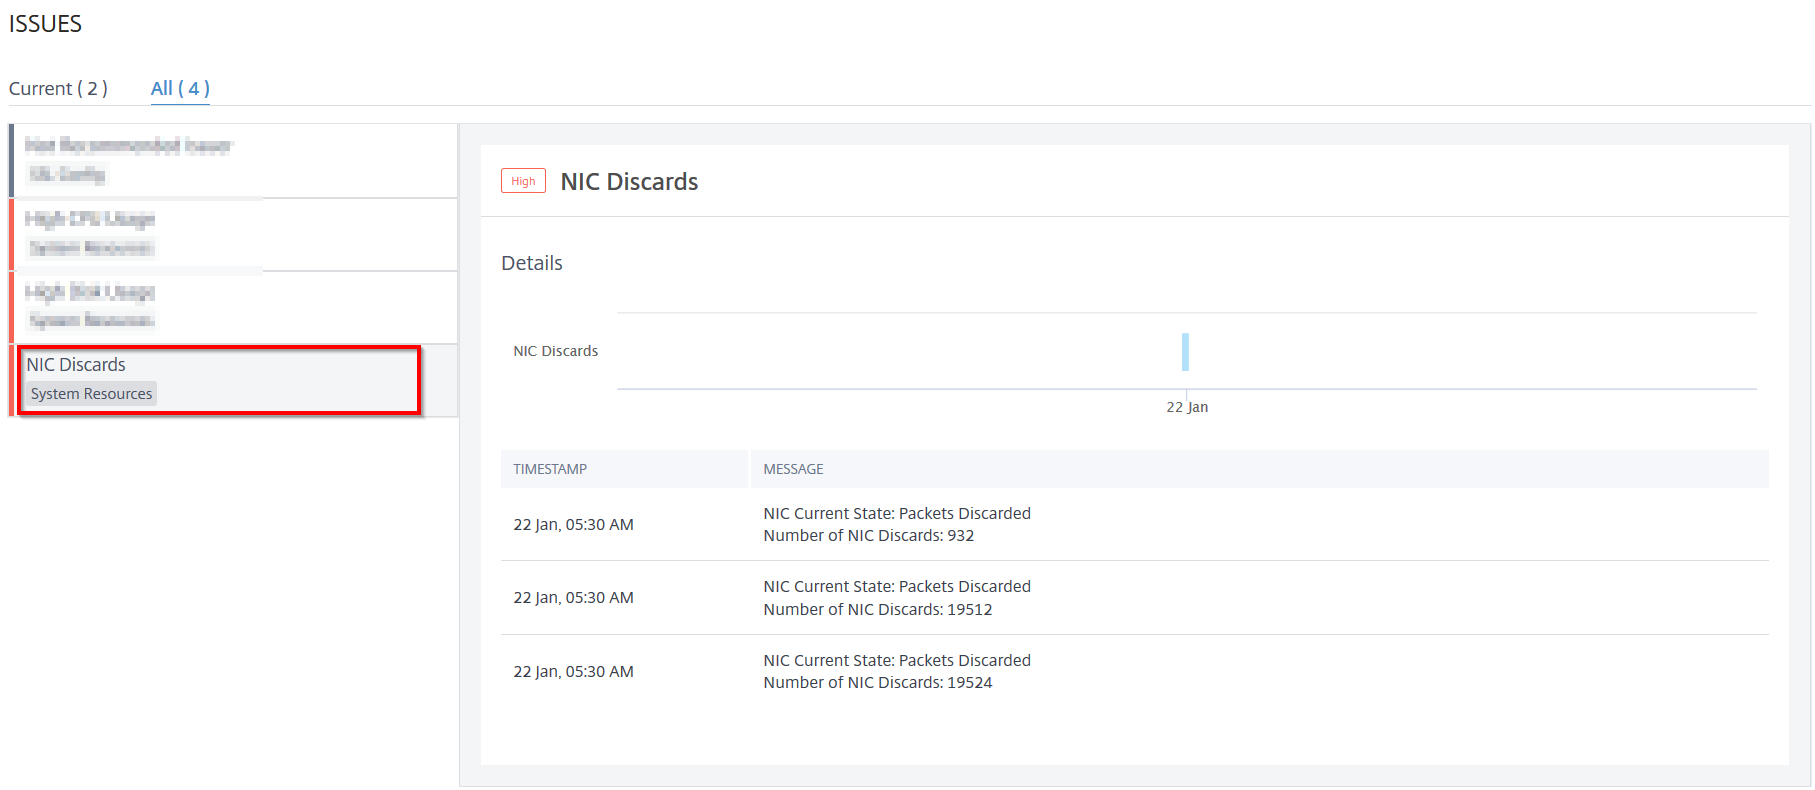
Under Details, you can view:
-
The time that occurred the anomaly
-
The message indicating the total packets discarded from NIC
Service flaps
As a network administrator, you must ensure for optimal availability of the application. When there are any network issues or configuration issues, the status and availability of an application server might impact the overall performance.
Using the service flaps events, you can identify the application that has issues. Service flaps events also help you:
-
Understand which service is in DOWN status for a specific duration
-
Understand how many services are in UP or DOWN state for a specific duration
Click the Service Flaps tab to view the service flaps details.
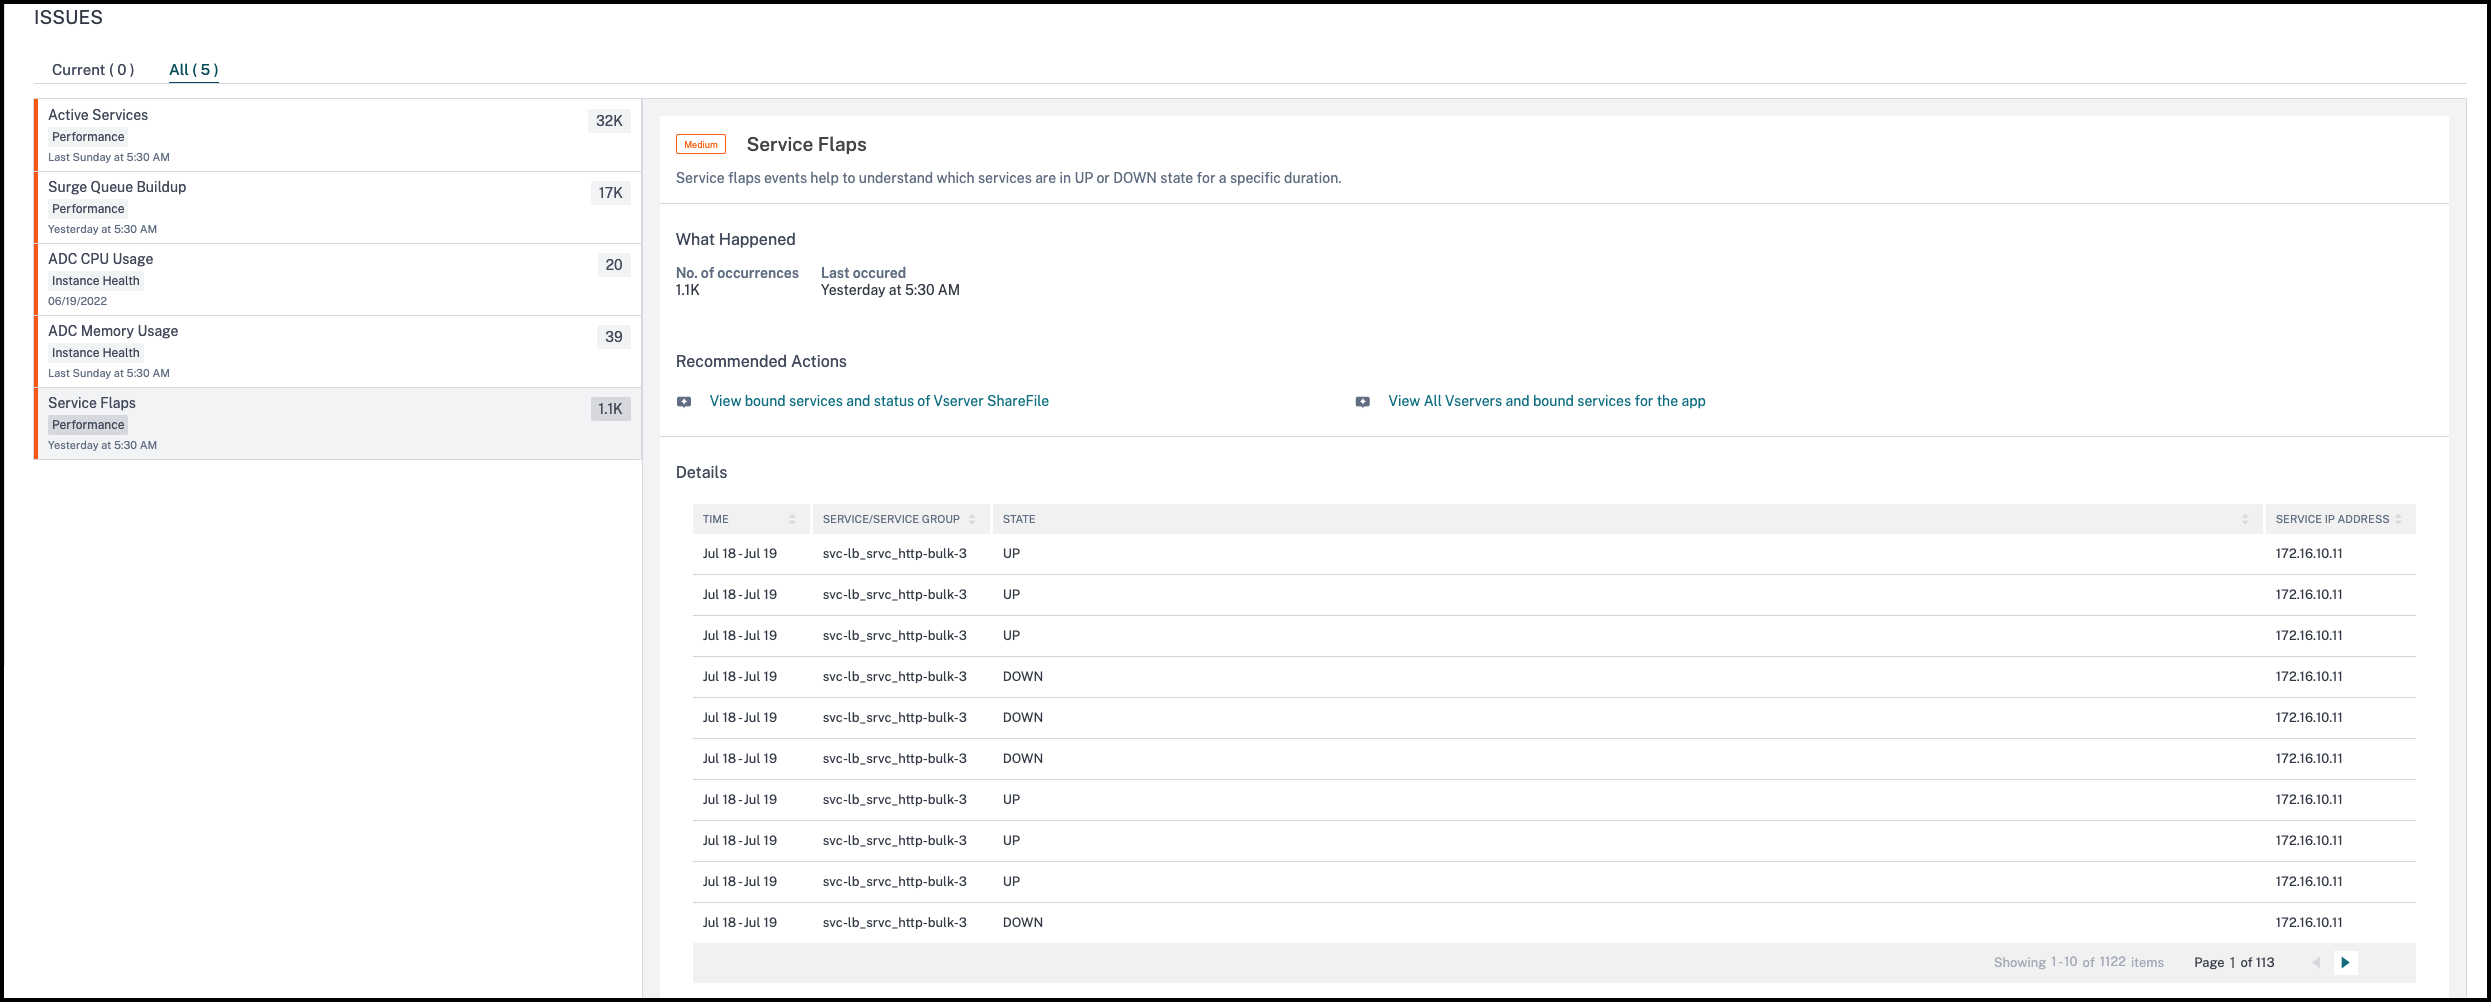
In the Recommended Actions, click to view the details of services that are bound to the virtual server.
You can view details such as number of occurrences and the time of last occurrence.
Under Details, you can view:
-
The time that occurred the service flap anomaly
-
The service/service group name
-
The service IP address
-
The current service status
Low session reuse
NetScaler instances process SSL transactions by offloading SSL handshake process from the server. Upon receiving the response from the server, the NetScaler instance completes the secure transaction with the client. Using the cached session parameters, NetScaler instance completes the SSL handshake process for the consecutive requests.
If in case these sessions are not reused, they become an overhead for the NetScaler instances. Using the Low Session Reuse indicator, you can identify if the actual number of sessions being reused is less.
Click the Low Session Reuse tab to view the issue details.
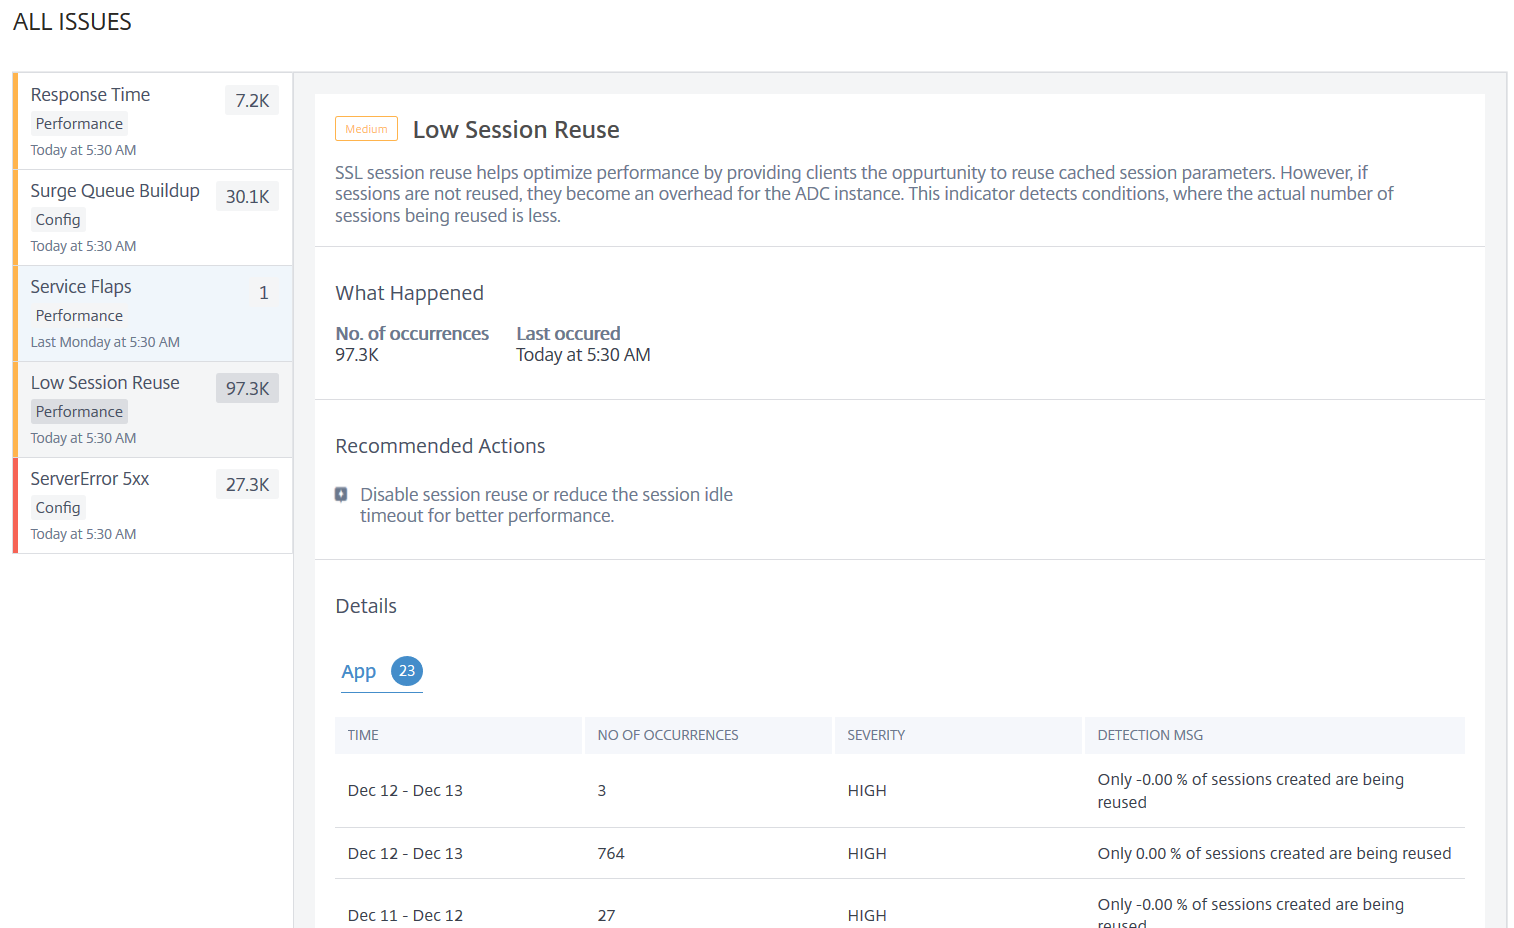
The Recommended Action to troubleshoot the issue is to either disable the session reuse or reduce the session timeout. For more information, see Session Reuse.
Under Details, you can view:
-
Total applications that have Low session reusage
-
The time that occurred the low session reuse anomaly
-
Total occurrences
-
The anomaly severity such as high, low, and medium
-
The detection message indicating only % of the configured sessions are being reused
Improper persistence type
You must configure persistence on a virtual server if you want to maintain the states of connections on the servers represented by that virtual server (for example, connections used in e-commerce). The appliance then uses the configured load balancing method for the initial selection of a server, but forwards to that same server all subsequent requests from the same client.
Persistence is effective when existing sessions are reused to serve subsequent requests. If persistence session reuse is low, sessions created on NetScaler are just an overhead.
Using the Improper Persistence Type indicator, you can determine if the persistence usage on a virtual server is low. Click the Improper Persistence Type tab to view the issue details.
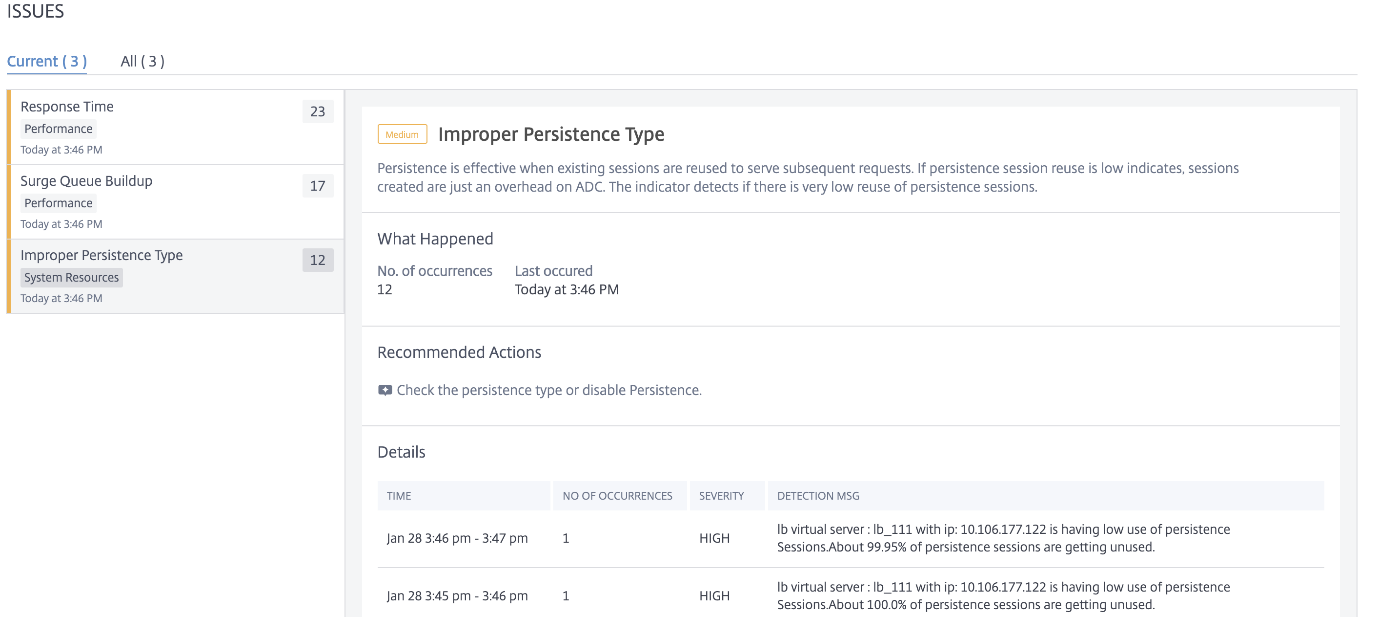
The Recommended Action to troubleshoot the issue is to check the persistence type or disable persistence. For more information, see Persistence Settings.
Under Details, you can view:
-
The time that occurred the anomaly
-
Total occurrences
-
The anomaly severity such as high, low, and medium
-
The detection message indicating the % of sessions that are unused
Unstable Server
In some scenarios, the web server responds with status codes when it is unable to handle the requests for reasons such as invalid requests, temporary overloading, or server maintenance. These errors are displayed with error codes, which define various scenarios of the errors. For example,
-
502 Bad Gateway The server is acting as a gateway or proxy and received an invalid response from the upstream server.
-
503 Service Unavailable The server is unavailable. The servers might be overloaded or down for maintenance.
-
504 Gateway Time-out The server is acting as a gateway or proxy and did not receive a timely response from the upstream server.
These can be temporary conditions, but sometimes you have to implement a corrective measure on the webservers to make the webpages up and available.
Using the Unstable Server indicator, you can view these failures and take decisions about corrective actions to overcome the issues and ensure the client requests are served and the webpages are always available.
Select the Unstable server tab to view the issue details.
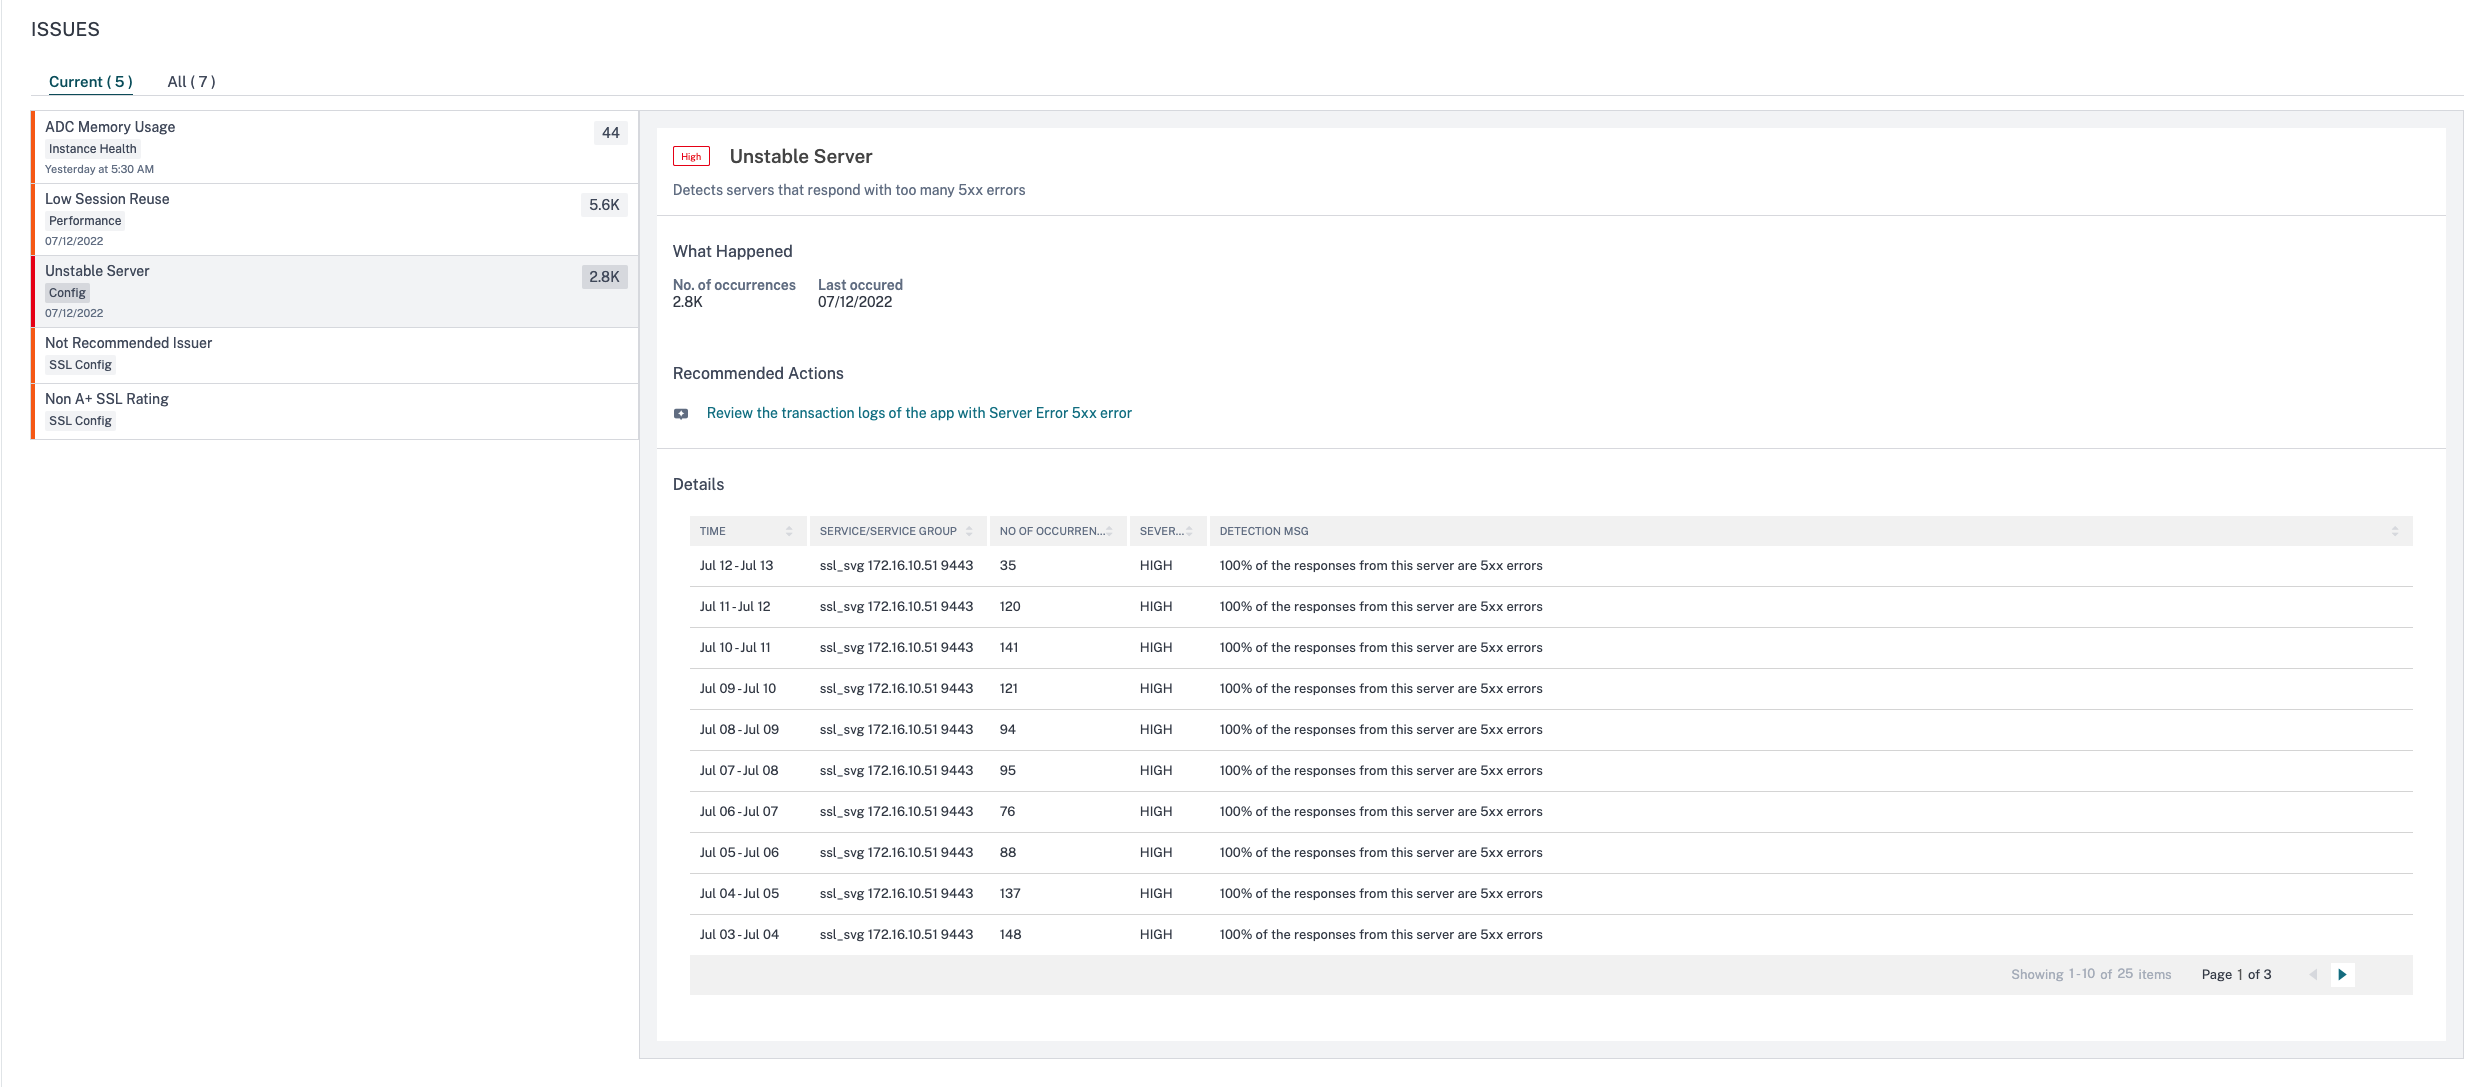
In the Recommended Actions, click to view the Transaction Logs that show the application with Response code 5xx error.
You can also try the following troubleshooting methods:
-
Configure L7 monitors with appropriate parameters for the server that responds with 5xx errors. A monitor is an entity that tracks the service health. The appliance periodically probes the servers using the monitor bound to each service. If a server does not respond within a specified response timeout, and the specified probes fail, the service is marked DOWN. The appliance then performs load balancing among the remaining services. For more information to configure a monitor, see Custom Monitors
-
Troubleshoot the server
Under Details, you can view:
-
The time that occurred the unstable server anomaly
-
The service/service group name
-
Total occurrences
-
The anomaly severity such as high, low, and medium
-
The detection message indicating % of the responses from this service reporting 5xx errors
For detailed information on server error web transaction, see Web transaction analytics for server errors
SSL Real Time Traffic
In NetScaler instance, you can use an SSL profile for processing SSL traffic. The SSL profile comprises certain SSL parameters for virtual servers, services, and service groups. The SSL Real Time Traffic indicator analyzes the SSL traffic to identify real time traffic and suggests optimal configuration settings for improving latency.
Click the SSL Real Time Traffic tab to view the issue details.
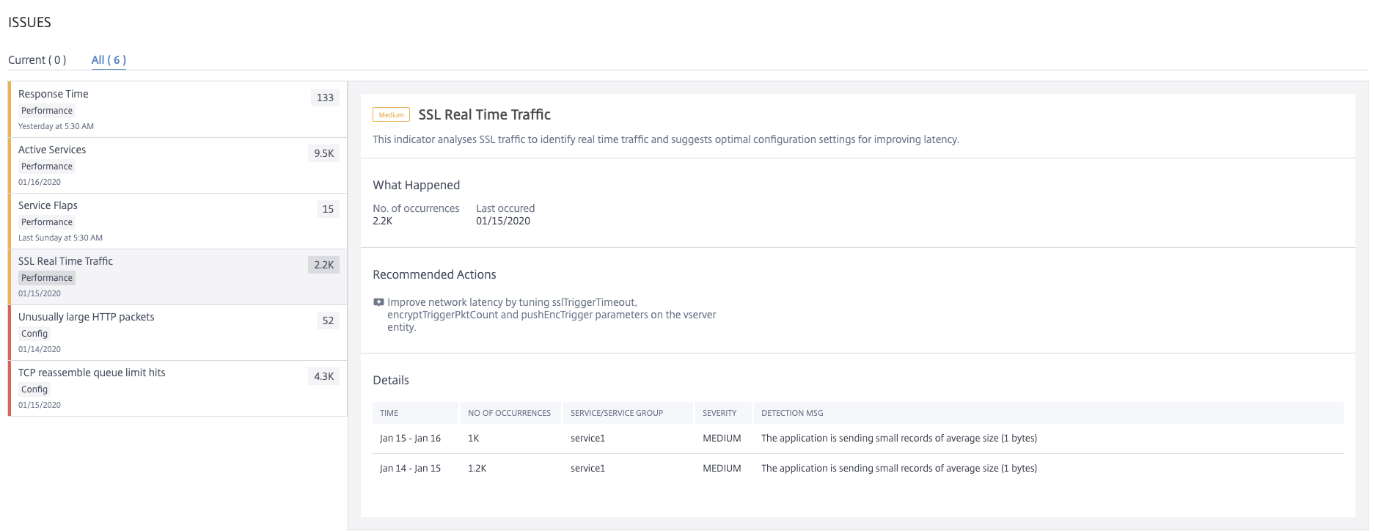
The Recommended Action to troubleshoot the issue is to improve the network latency by updating SSL parameters. For more information, see Global SSL Parameters.
Under Details, you can view:
-
The time that occurred the anomaly
-
The service/service group name
-
The anomaly severity such as low, medium, and high
-
The detection message with the current setting on the application
Unusually Large HTTP packets
An HTTP transaction uses request-response messages between the client and the server. In the request and response messages, HTTP headers are the values that are displayed in the HTTP protocol. You can configure the HTTP header length in virtual server, service, or service group to avoid 4xx errors.
When an HTTP request/response exceeds the maximum header length, it can be a possible attack. Using the Unusually large HTTP packets indicator, you can view the occurrences where the HTTP messages with HTTP header size exceed the configured values.
Click the Unusually large HTTP packets tab to view the issue details.
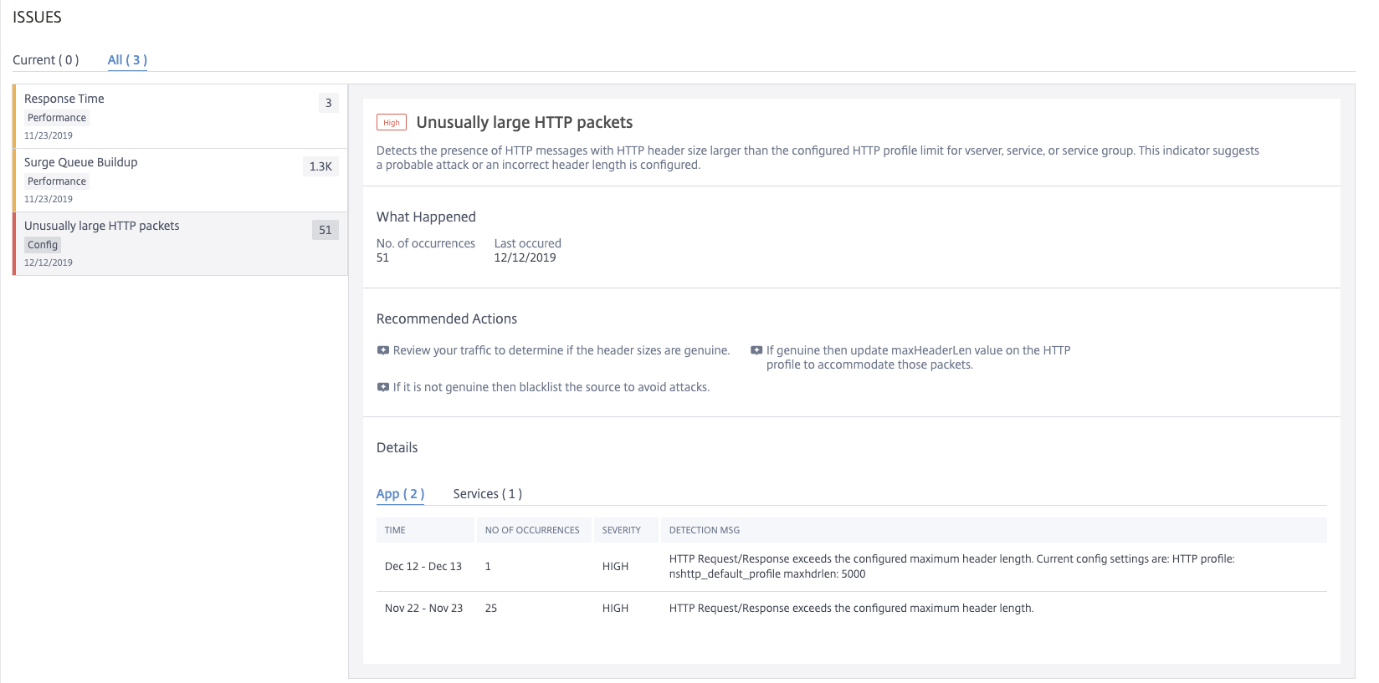
The Recommended Actions to troubleshoot the issue are:
-
Review the traffic to determine the header size is genuine. If the header size is genuine, then update the header value on the HTTP profile. For more information, see Buffer Overflow Check.
-
If the header size is not genuine, add the source to the block list to avoid attacks.
Under Details, you can view:
-
The time that occurred the anomaly
-
Total occurrences
-
The anomaly severity such as high, low, and medium
-
The detection message indicating the current HTTP header length configured on the virtual server, server, or service group
TCP reassembly queue limit hits
TCP maintains an Out-of-Order queue to keep the OOO packets in the TCP communication. This setting impacts NetScaler memory if the queue size is long as the packets need to be kept in runtime memory.
This needs to be kept at an optimized level based on the kind of network and application characteristics.
Using the TCP reassemble queue limit hits indicator, you can view if the Out-of-Order packets on a TCP connection exceed the configured out of order packet queue size.
Click the TCP reassemble queue limit hits tab to view the issue details.
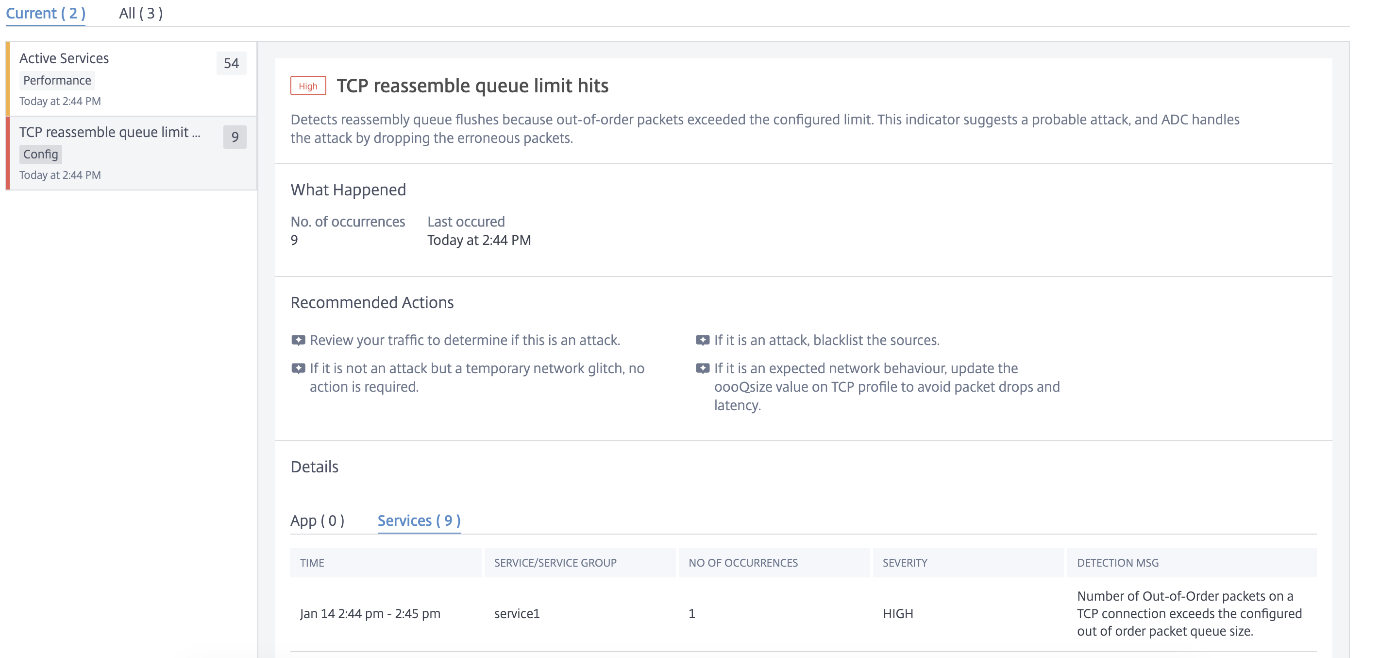
The Recommended Actions to troubleshoot the issue are:
-
Review the traffic and add the source to block list if it is an attack
-
If this is an expected network behavior, then update the out-of-order packets size value on TCP profile. For more information, see TCP Optimization
-
If it is just a temporary network glitch, then no further action is required
Under Details, you can view:
-
The time that occurred the anomaly
-
Total occurrences
-
The anomaly severity such as low, medium, and high
-
The detection message indicating the current TCP profile and oooQsize settings
Surge Queue Buildup
When a server receives a surge of requests, the server becomes slow to respond to the clients. Often, the overload also causes clients to receive error pages. A virtual server needs to have enough back end servers configured to handle the incoming requests.
Using the Surge Queue Buildup indicator, you can view the virtual servers that have surge queue buildup. Click the Surge Queue Buildup tab to view the issue details.
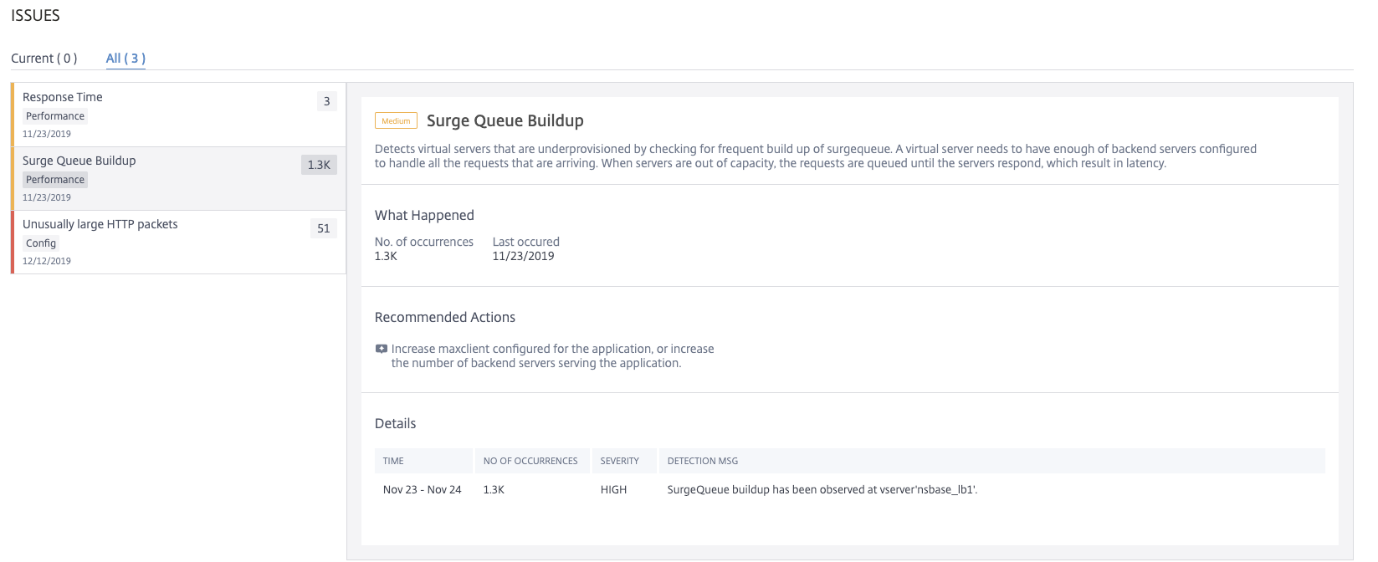
The Recommended Actions to troubleshoot the issue are:
-
Increase the number of client connections limit. For more information, see Set a limit on the number of client connections
-
Increase the back-end servers to serve the application requests
Under Details, you can view:
-
The time that occurred the surge queue buildup anomaly
-
Total occurrences
-
The anomaly severity such as high, low, and medium
-
The detection message indicating the surge queue buildup on the virtual server
SSL rating
When an application is not having an A+ SSL rating, the app score gets impacted. Using the Non A+ SSL Rating indicator, you can analyze the reasons for the application not having an A+ SSL rating. Click the Non A+ SSL Rating tab to view the issue details.
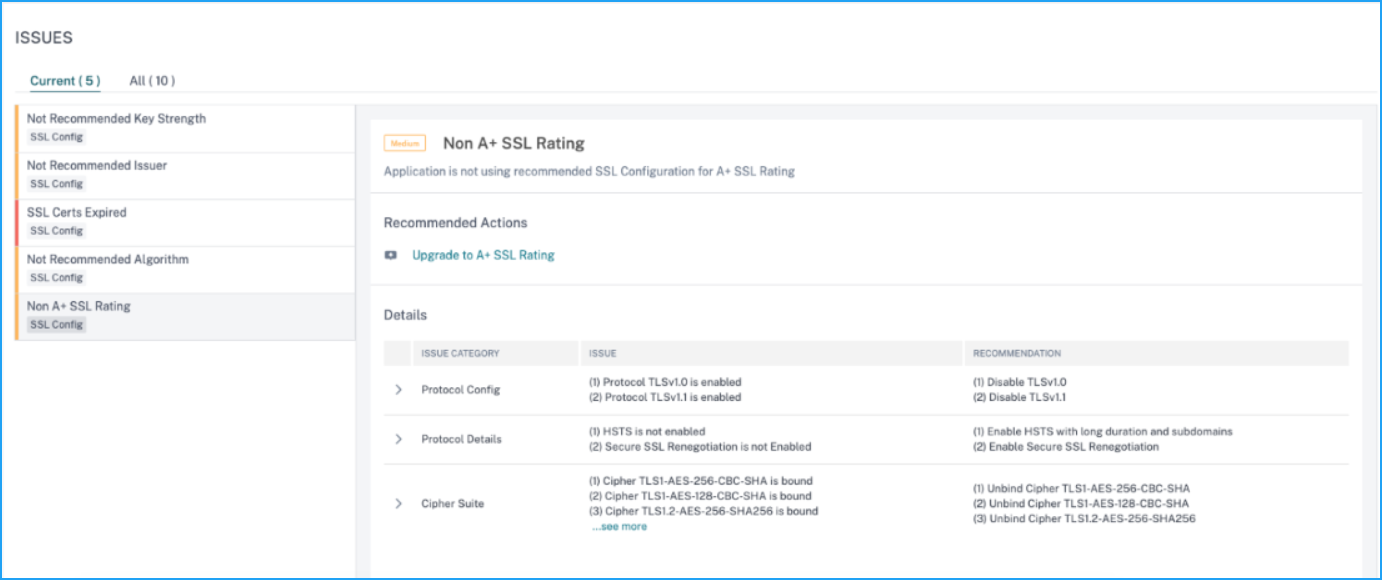
The Recommended Action to troubleshoot the issue is to upgrade it to A+ SSL rating. For more information, see Upgrade to A+ SSL Rating.
Under Details, you can view the issue details such as issue category, issue, and recommendation.