
View events summary
You can now view an Events Summary page to monitor the events and traps received on your {{page.adm-product-name-short}}. Navigate to Infrastructure > Events. The Events Summary page displays the following information in a tabular format:
-
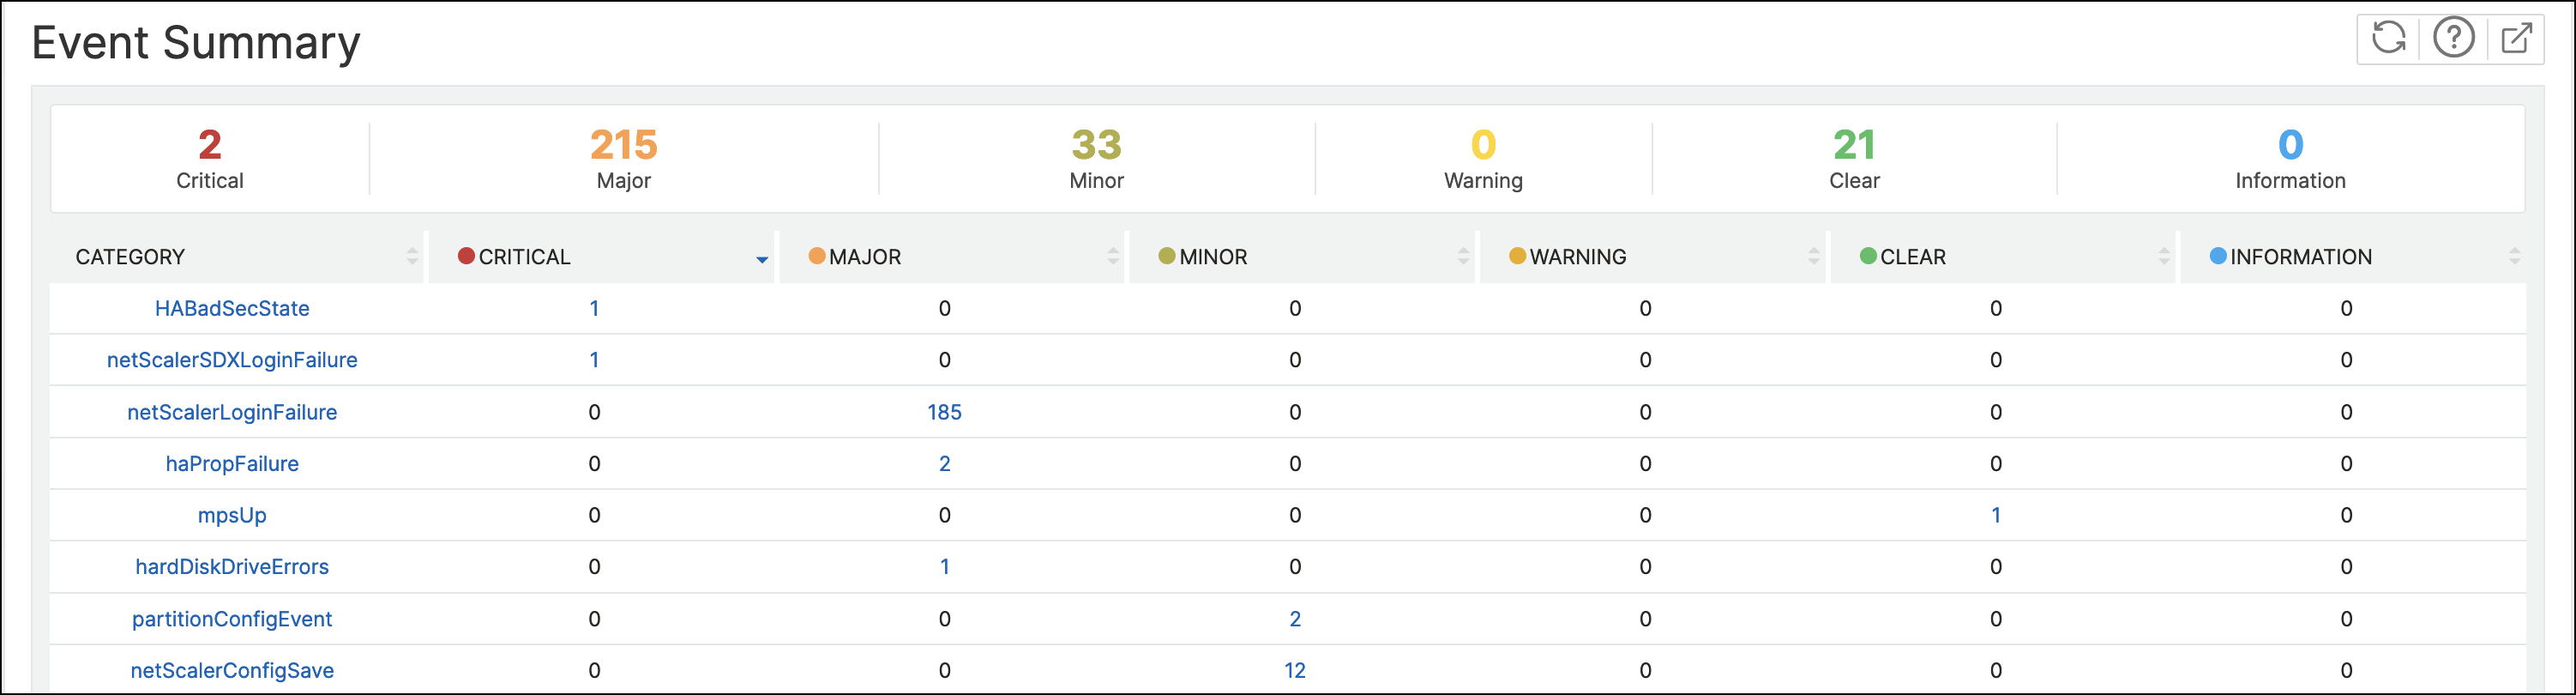
Summary of all the events received by {{page.adm-product-name-short}}. The events are listed by category, and the different severities are displayed in different columns: Critical, Major, Minor, Warning, Clear, and Information. For example, a Critical event would occur when a Citrix Application Delivery Controller ({{page.citrix-adc-generic}}) instance goes down and stops sending information to the {{page.adm-product-name-short}}. During the event, a notification is sent to an administrator, explaining the reason for why the instance is down, the time for which it had been down, and so on. The event is then recorded on the Events Summary page, on which you can view the summary and access the details of the event.
-
Number of traps received for each category. The number of traps received, categorized by severity. By default, each trap sent from {{page.citrix-adc-generic}} instances to {{page.adm-product-name-short}} has an assigned severity, but as the network administrator, you can specify its severity in the {{page.adm-product-name-short}} GUI.
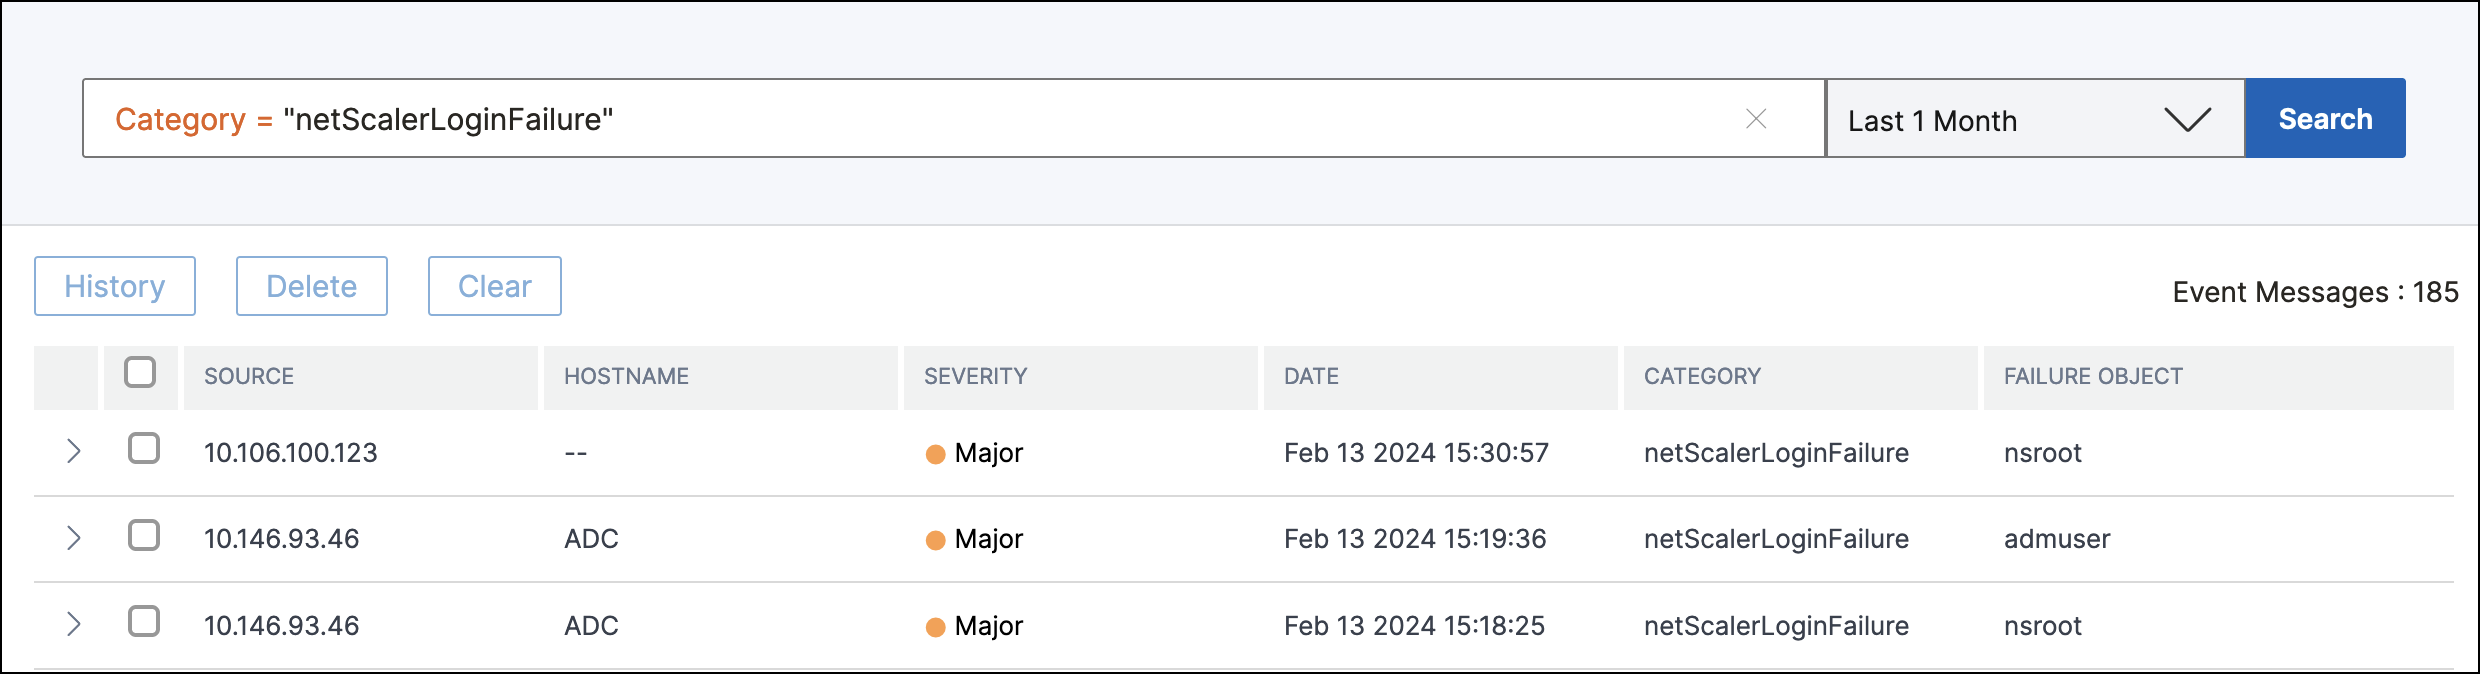
If you click a category type or a trap, you are taken to the Events page, on which filters such as the Category and Severity are preselected. This page displays more information about the event, such as the IP address and host name of a {{page.citrix-adc-generic}} instance, date on which the trap was received, category, failure objects, configuration command run, and the message notification.
You can configure the number of days between 1 and 40, for which you want to view the events in {{page.adm-product-name-short}}. For example, if you select 30 days, {{page.adm-product-name-short}} displays the events for 30 days and after 30 days, the events are cleared. To configure this event setting, navigate to Settings > Global Settings > Data Rentention Policy. For more information, see Data retention policy.
To export the report of this dashboard:
To export the report of this page, click the Export icon on the top right side of this page. On the Export page, you can do one of the following:
-
Select Export Now tab. To view and save the report in PDF, JPEG, PNG, or CSV format.
-
Select Schedule Export tab. To schedule the report daily, weekly, or monthly and send the report over an email or a slack message.
Note:
-
If you select Weekly recurrence, ensure that you select the weekdays on which you want the report to be scheduled.
-
If you select Monthly recurrence, ensure that you enter all the days that you want the report to be scheduled separated by commas.
Related information