
Create custom dashboards to view instance key metric details
Similar to the unified dashboard (Overview > Dashboard), you can view instance metric details based on your choice by creating custom dashboards. You can create up to 30 dashboards by using a unique name for each dashboard. As an administrator, this enhancement enables you to create multiple dashboards and monitor only the required instance insights.
To get started, consider that you want to monitor the key metrics for Applications and Application Security:
-
Navigate to Overview > Custom Dashboard.
-
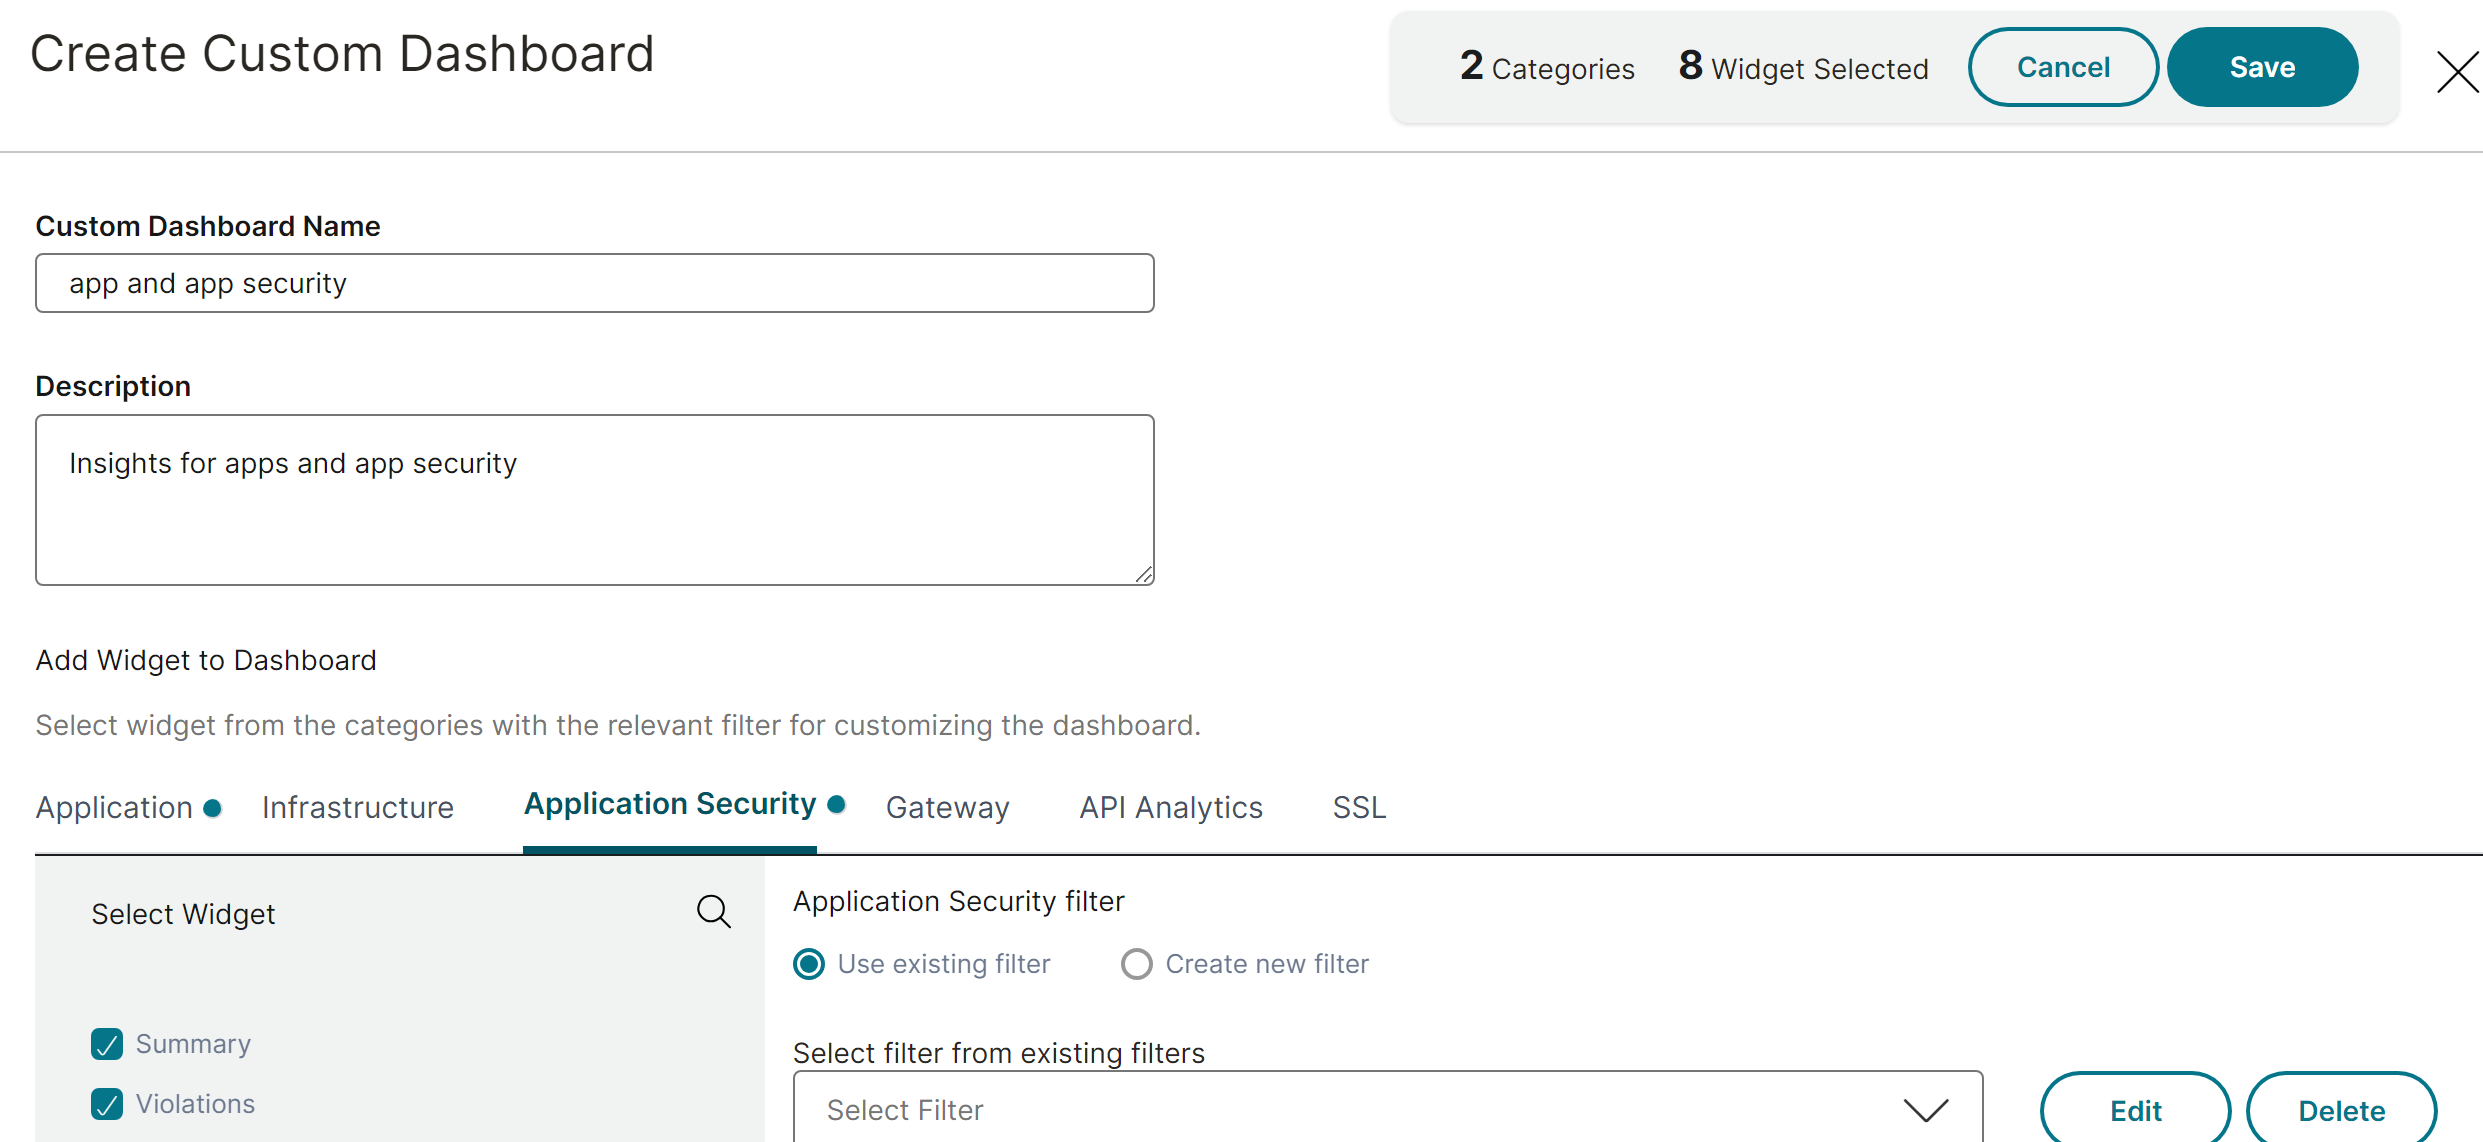
Click + to create a new dashboard.In the Create Custom Dashboard page:
-
Custom Dashboard Name - Specify a unique name for the dashboard.
-
Description - Provide a brief description to have additional details.
-
Add Widget to Dashboard - In this example, the requirement is to add widgets for applications and application security. Select the widgets that you want to monitor from Application and Application Security categories.
-
Application filter - By default, the filter is applied to all applications. You can also create a filter and select only specific applications. For more information, see Create and apply filters.
-
Click Save.
-
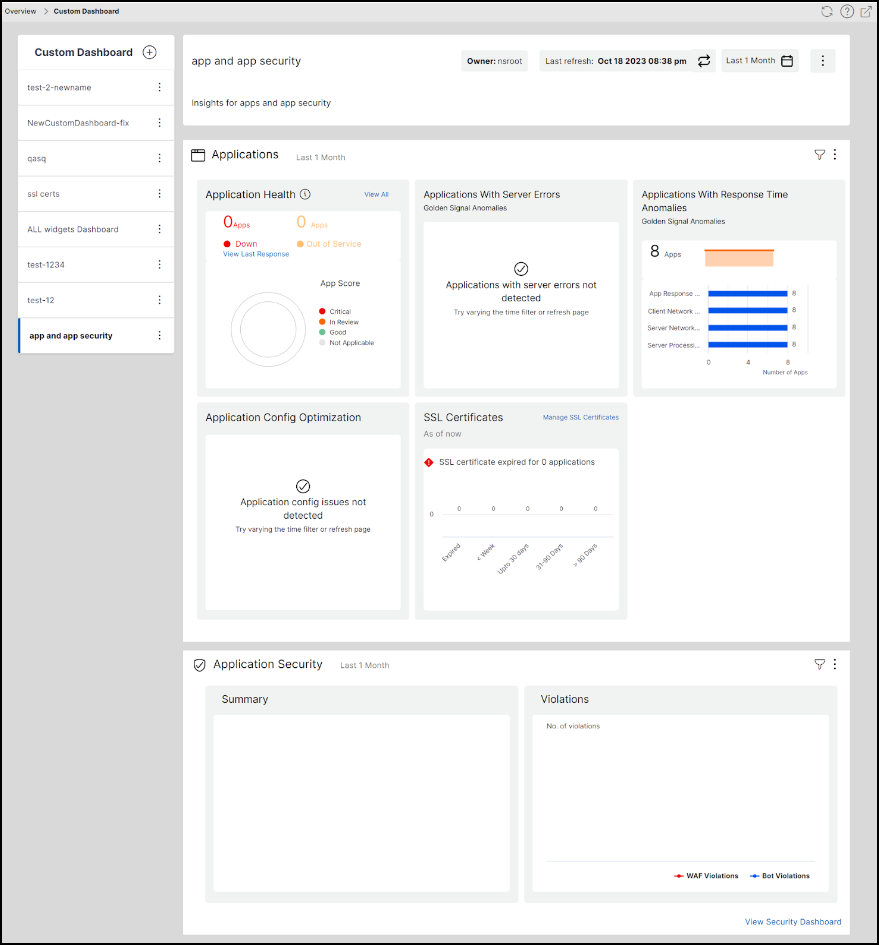
The dashboard is successfully created. Similarly, you can create up to 20 dashboards and select categories based on your choice by specifying a unique name for each dashboard.
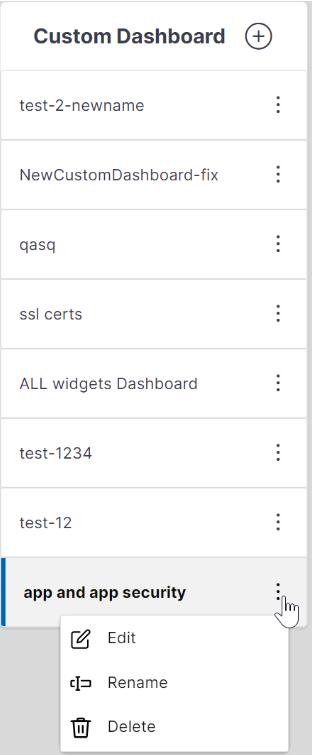
You can use the following options after you create a custom dashboard:
-
Edit: You can edit the dashboard by adding more widgets or removing widgets, applying filters, and so on.
-
Rename: You can change the dashboard name.
-
Delete: You can delete the dashboard.
Related information
More options in the dashboard
In the custom dashboard that you have created, you can use the following options:

-
Edit Configuration: You can also use this option to edit the dashboard by adding more widgets or removing widgets, applying filters, and so on.
-
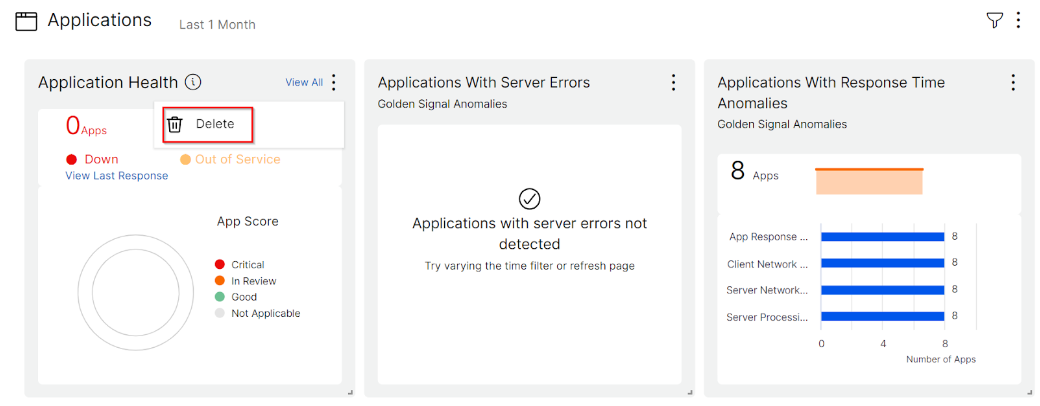
Edit Layout: You can use this option to have additional customization to the dashboard.
-
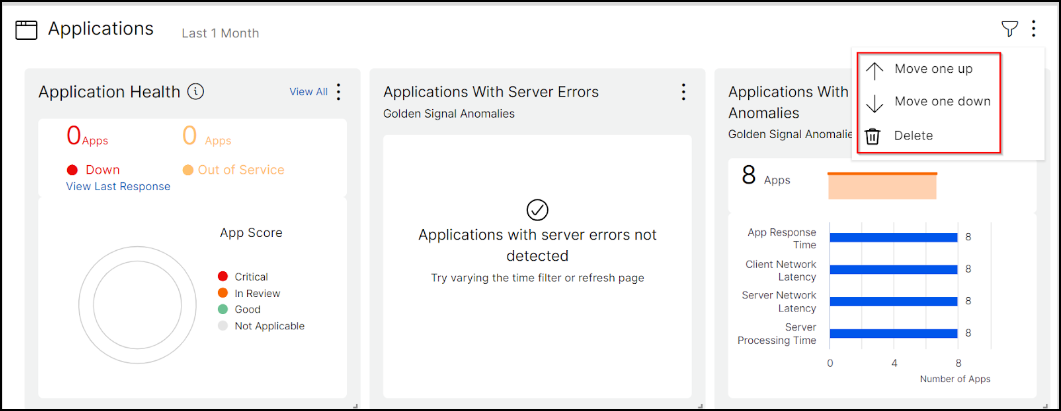
You can select to move up, down, or delete.
-
In the Widgets, you can delete any widget by selecting the Delete option.
-
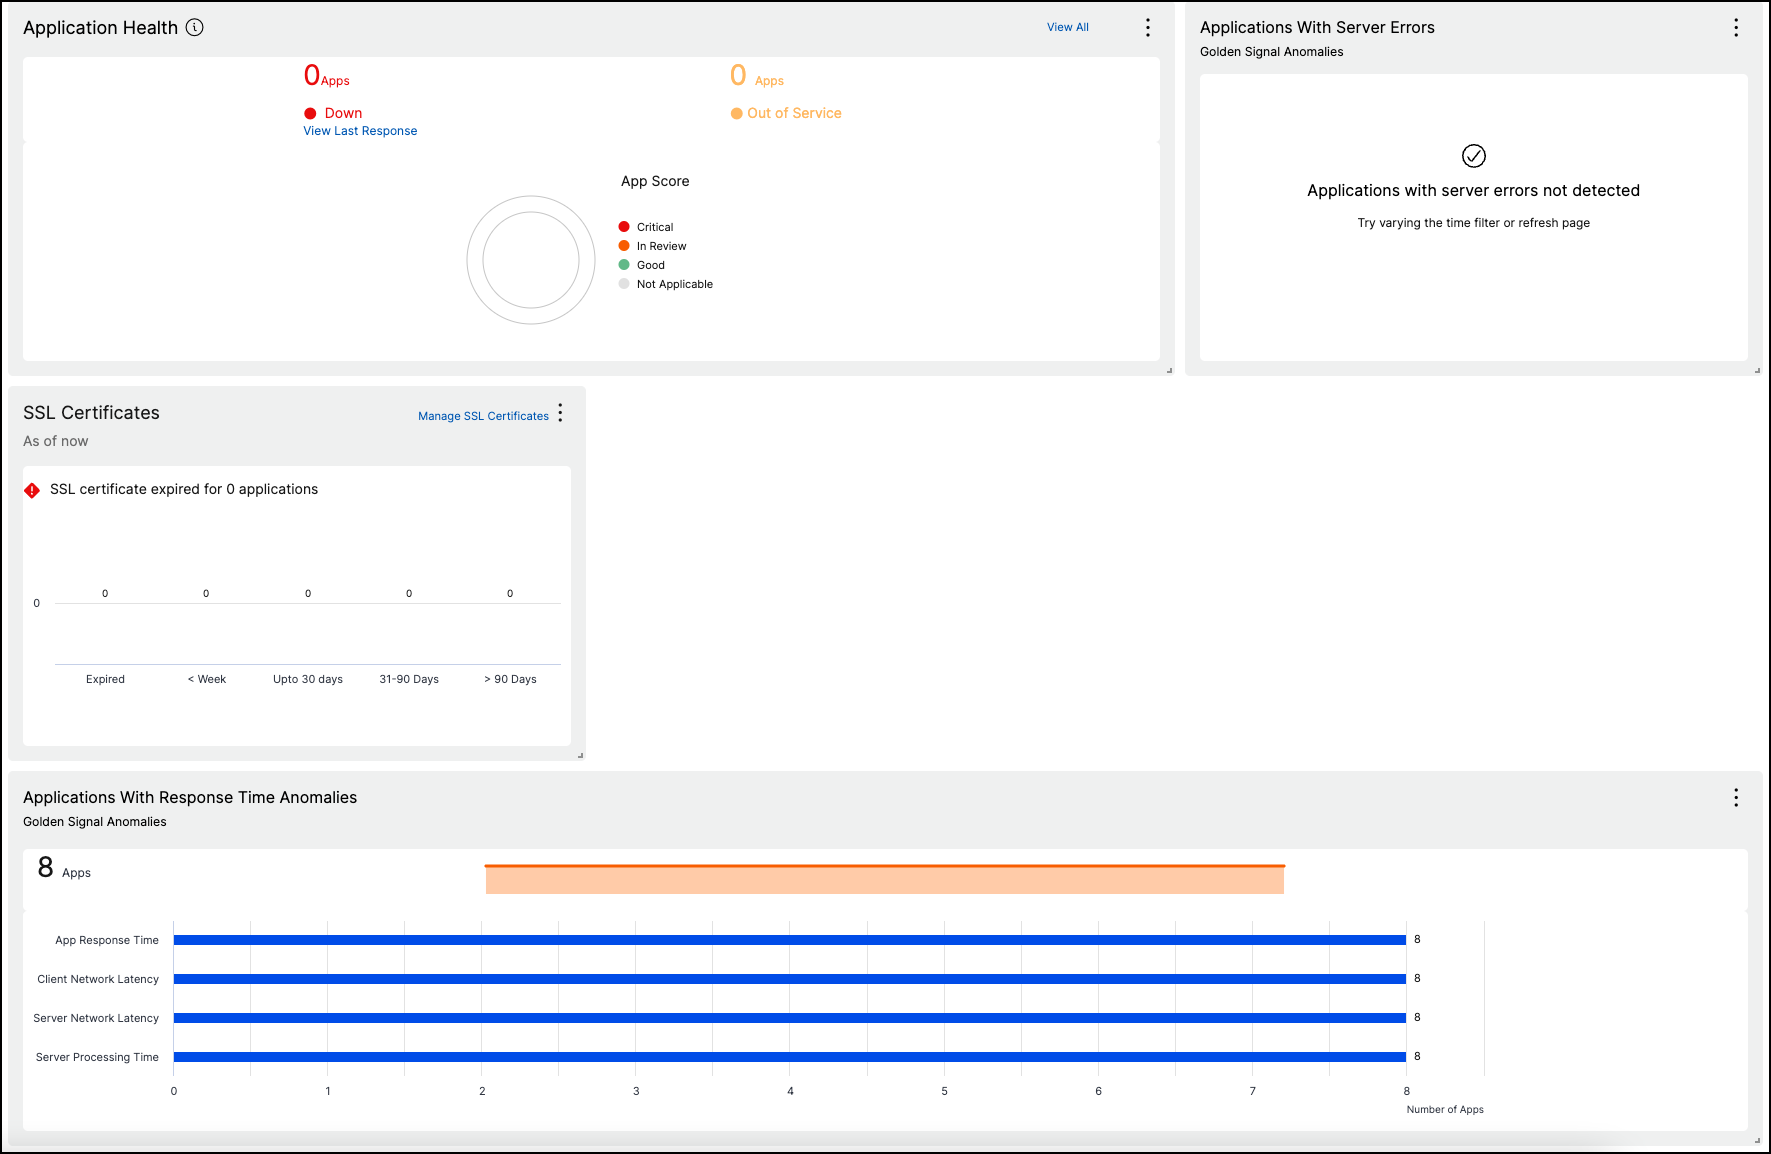
Drag to place the widgets wherever you want.
-
Increase or decrease the widget size to have a better visibility for certain insights.
-
After you make changes, click Save to see the updated dashboard.
Share dashboard to other users
You can share the dashboard to other users. Select an existing dashboard and click Share. Type the user name and click Invite to share the dashboard. The assigned user can view the dashboard in read-only mode.