Holistic view of all applications in service graph
Navigate to Applications > Service Graph and then click Global.
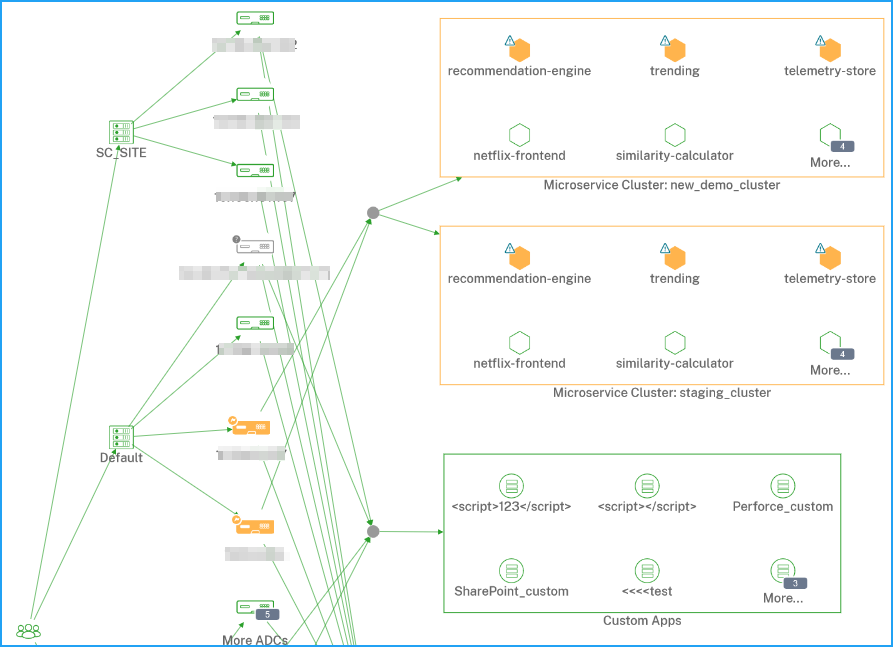
The service graph displays the following for the selected time duration:
-
The region from where the users access the specific application
-
Data centers where the NetScaler instances are hosted
-
The total discrete applications from all NetScaler instancesNoteIf a NetScaler instance does not have discrete applications, the arrow edge towards the Discrete virtual server from the NetScaler instance is not visible
-
The total custom applications from all NetScaler instances
-
The total microservice applications from the NetScaler CPX instance
View client metrics
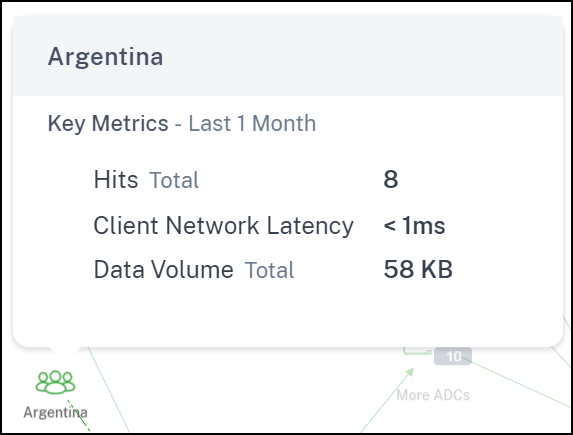
Hover the mouse pointer on a client region to view the metrics.
-
Hits - Total requests received by the client.
-
Client Network Latency – Indicates the network latency from the client.
-
Data Volume - Indicates the total data processed by the client.
View NetScaler details
The service graph enables you to view:
-
The data center grouped with its total NetScaler instances
-
Only the top 4 low-scored NetScaler instances from each data center
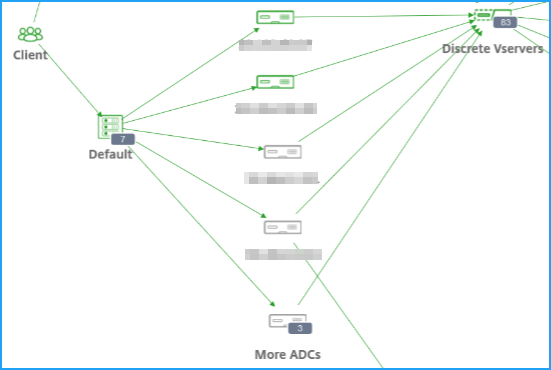
Click More NetScaler instances to view all NetScaler instances by selecting the respective status (Critical, Review, Good, and Not Applicable) tabs.
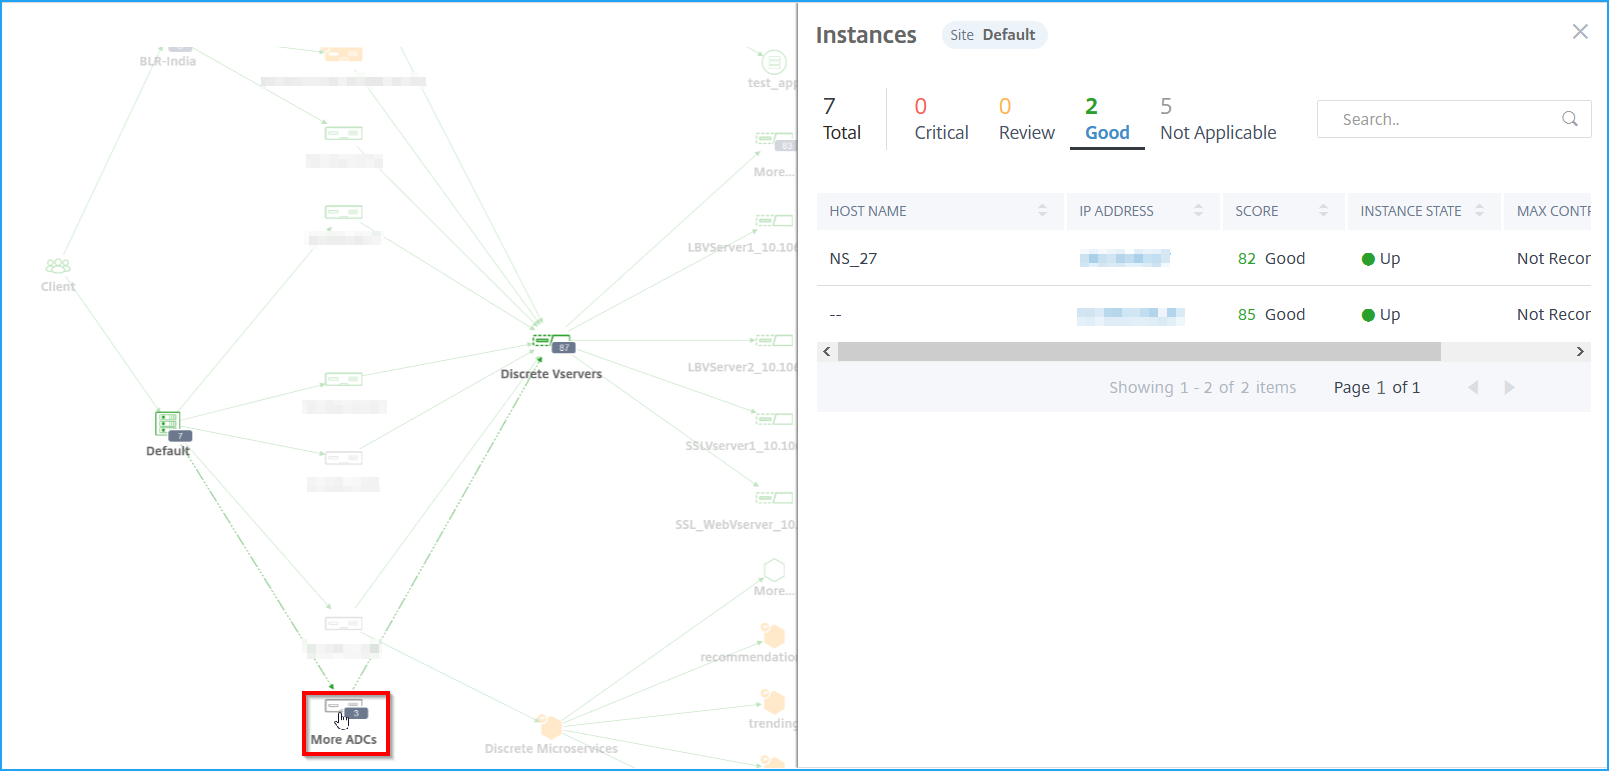
Hover the mouse pointer on a NetScaler instance to view the metrics.
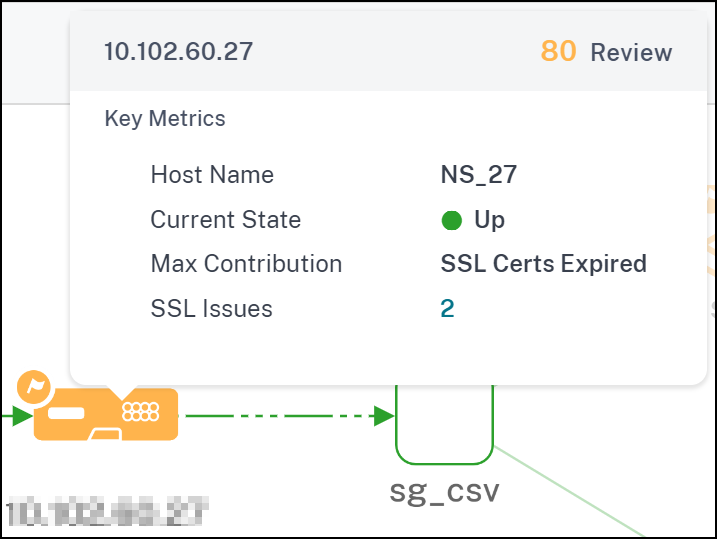
You can view:
-
NetScaler instance IP address and score
-
Host Name – Indicates the host name that is assigned to the NetScaler instance
-
Current State – Indicates the current status of the NetScaler instance such as Up, down, out-of-service.
-
Max Contribution – Indicates the top issue that affects the current NetScaler score.
-
SSL Issues – Indicates the total SSL issues from the NetScaler instance. Click the error count to drill down and view the SSL error details.
Click the NetScaler instance to view the instance details such as instance score, key metrics, and issues associated with the NetScaler instance. For more information, see View instance details in Infrastructure Analytics.
View discrete applications
The service graph displays the top 4 low scored discrete applications.
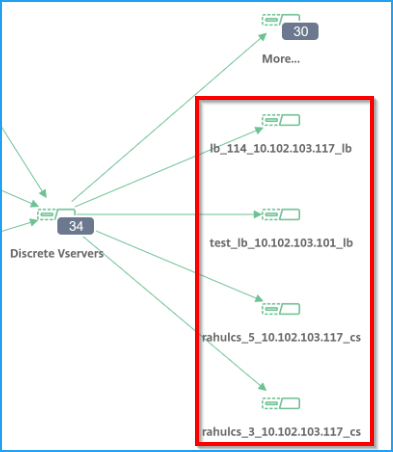
Consider that you have the following discrete applications:
| App Name | NetScaler | App Score | App Status |
|---|---|---|---|
| App1 | 10.102.29.50 | 35 (Critical) | Up |
| App2 | 10.102.29.90 | 100 (Good) | Down |
| App 3 | 10.102.32.40 | 49 (Review) | Up |
| App4 | 10.102.113.208 | 92 (Good) | Down |
| App5 | 10.102.25.25 | 86 (Good) | Up |
| App6 | 10.102.29.41 | 77 (Good) | Up |
| App7 | 10.102.29.102 | 41 (Review) | Up |
In this scenario, you can view App1, App3, App6, and App 7 as the top 4 low-scored applications in service graph.
Similarly, you can also view the top 4 low-scored applications for Custom and Microservices applications.
Hover the mouse pointer on a service to view the metrics information.
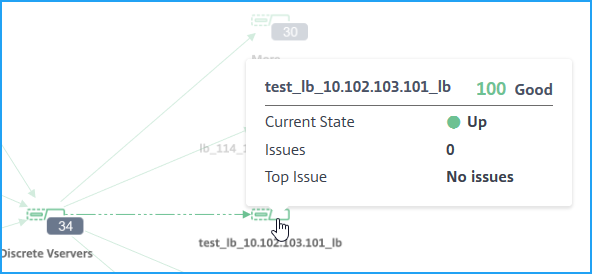
You can view:
-
The application name and score
-
Current State – Indicates the application current status such as Up or Down
-
Issues – Indicates the total issues applicable for the application
-
Top Issue – Indicates the top issue that impacts the overall application score
Click More to view all discrete applications. The Discrete virtual server page is displayed as shown in the following image:
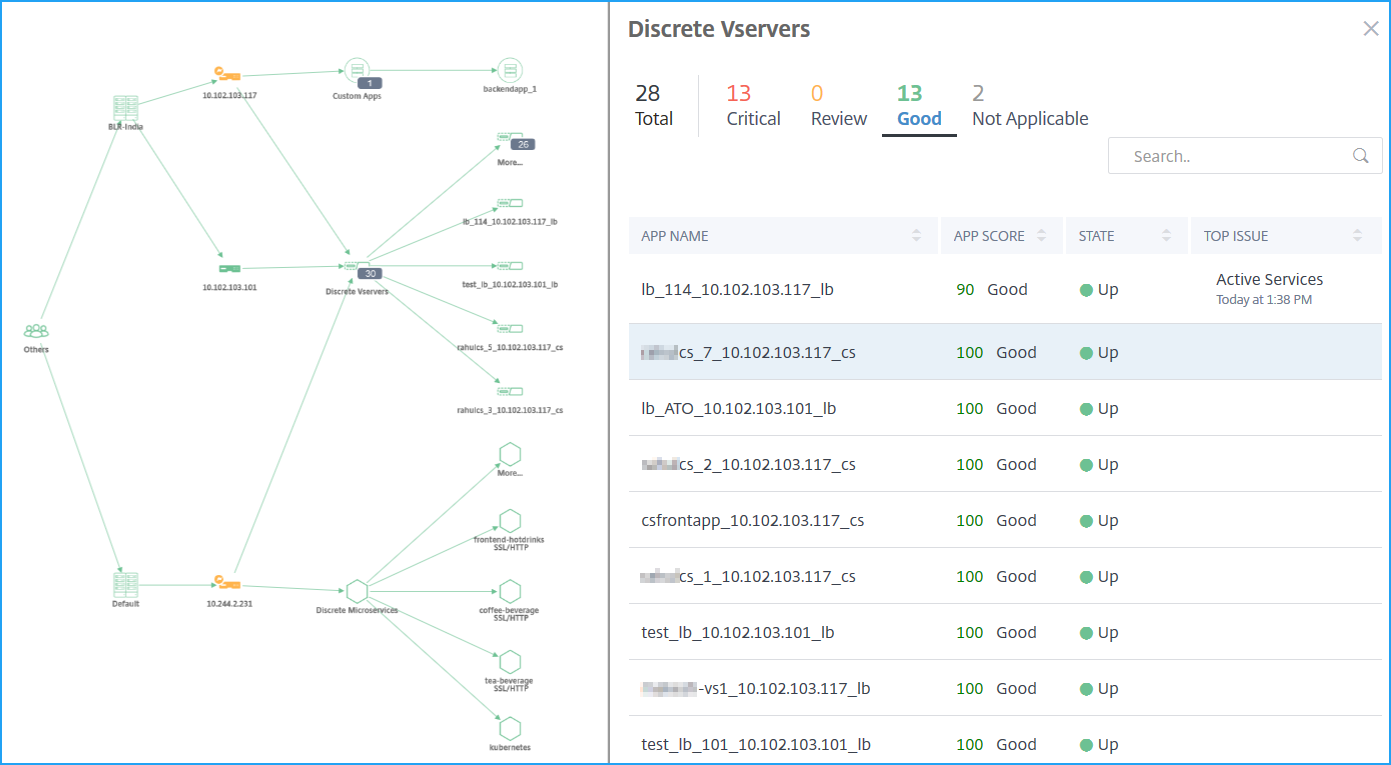
The virtual servers are displayed according to the status.
-
Total – Total discrete applications
-
Critical – App score is between 0 and < 40
-
Review – App score is between 40 and < 75
-
Good – App score is > 75
-
Not Applicable – App is not bound to any virtual server
You can click each tab to view the virtual servers. When you click an application, the service graph for the selected application is displayed.
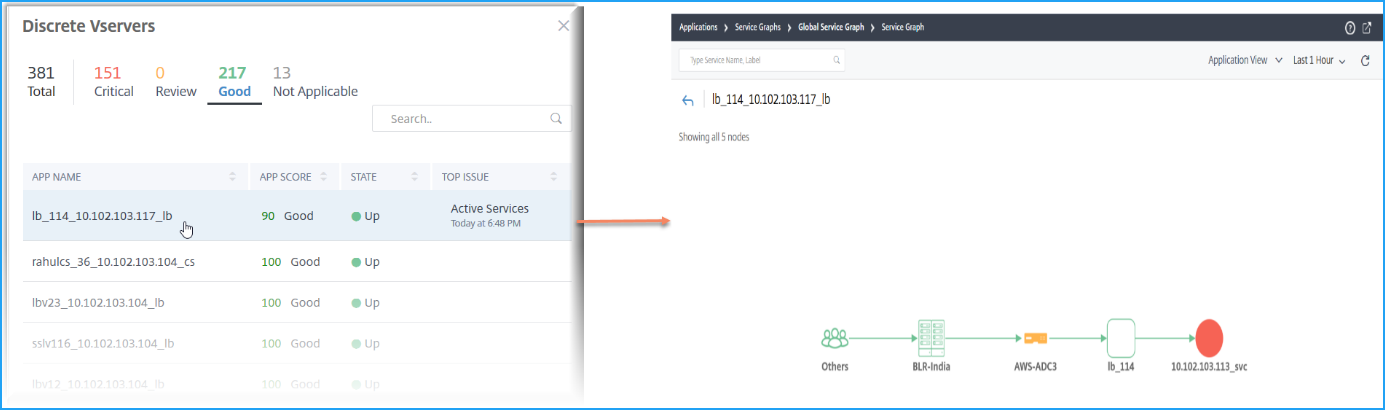
For more information, see Service Graph for applications.
View microservice applications
The service graph also displays all microservice applications that belong to the Kubernetes clusters. Hover the mouse pointer on a service to view the metrics details.
You can view:
-
The service name
-
The protocol used by the service such as SSL, HTTP, TCP, SSL over HTTP
-
Hits – The total number of hits received by the service
-
Service Response Time – The average response time taken from the service.(Response time = Client RTT + request last byte – request first byte)
-
Errors – The total errors such as 4xx, 5xx, and so on
-
Data Volume – The total volume of data processed by the service
-
Namespace – The namespace of the service
-
Cluster Name – The cluster name where the service is hosted
-
SSL Server Errors – The total SSL errors from the service
When you click a service, the Kubernetes service graph for the selected service is displayed, along with the service namespace and cluster name filters applied.
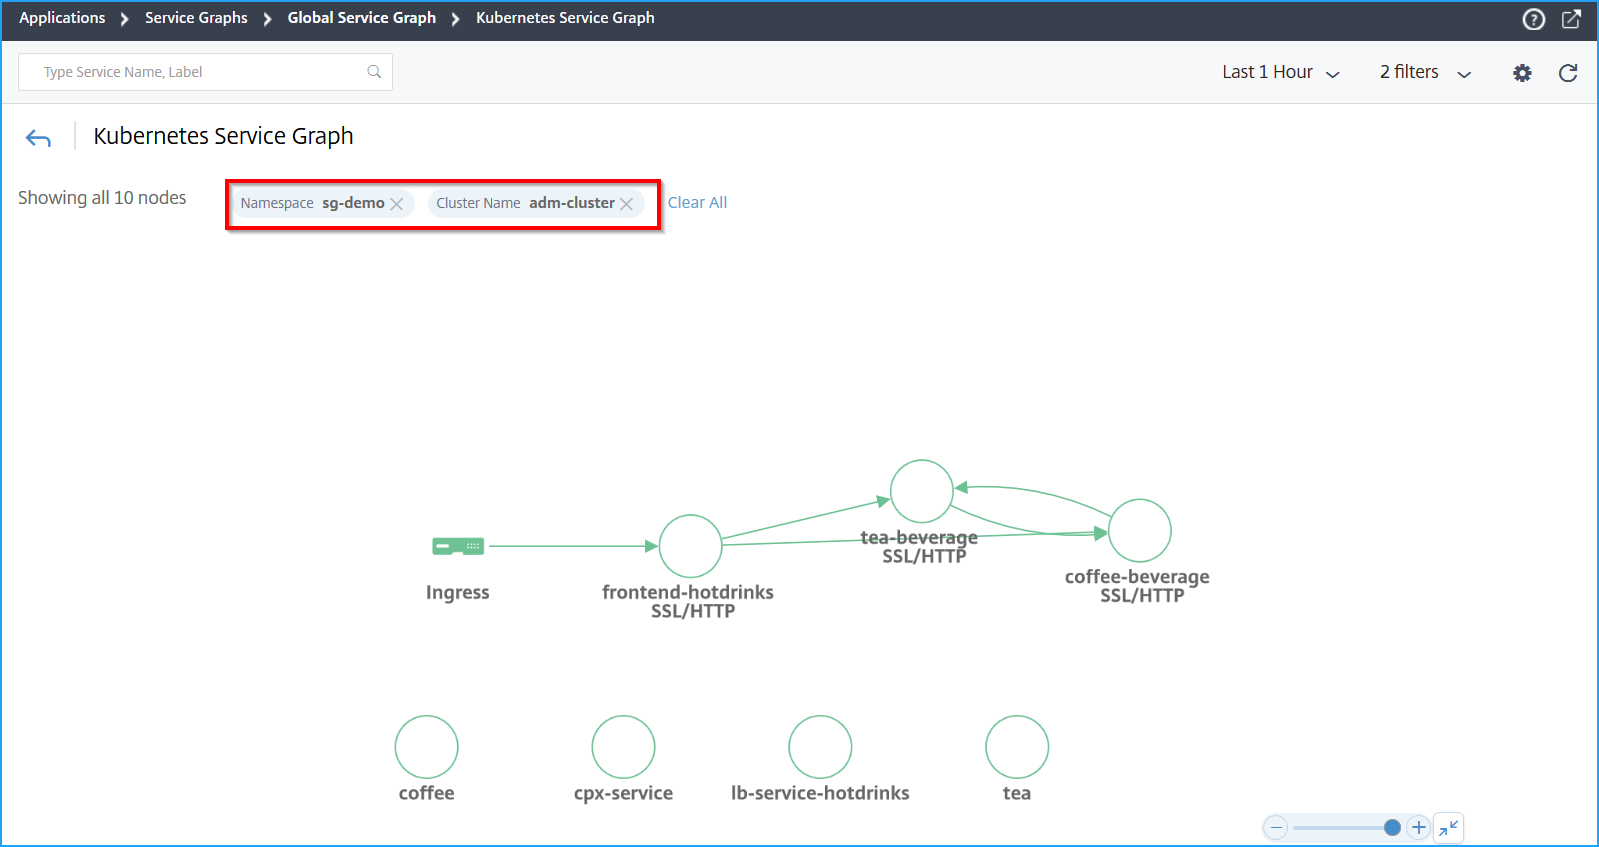
Click More to view the Kubernetes service graph that has all services. For more information on Kubernetes service graph, see Service graph for cloud native applications.
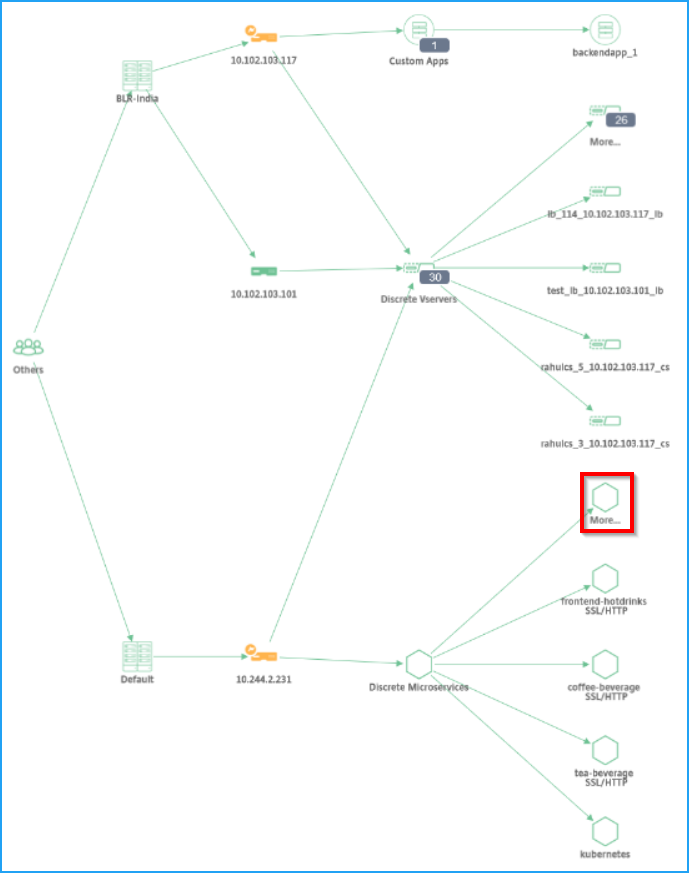
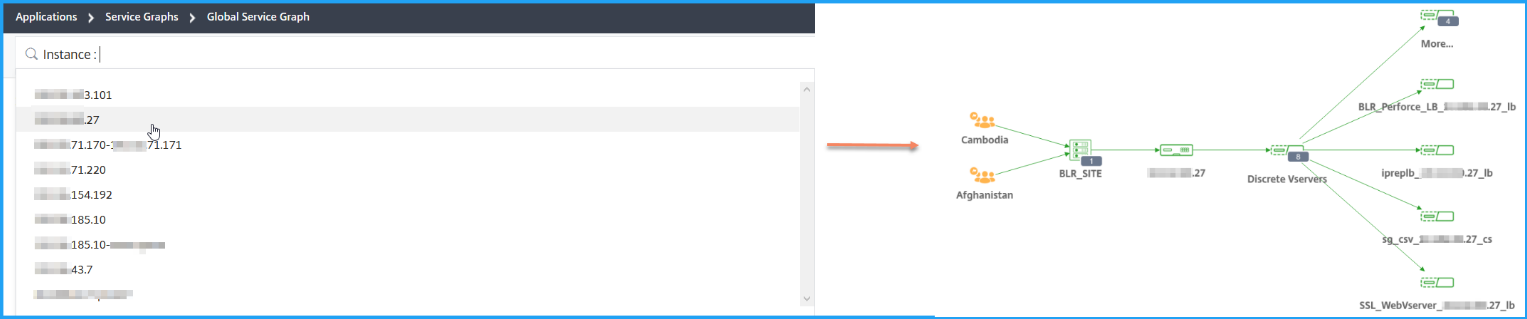
Search bar to filter results
You can use the search bar to filter results. As an administrator, this search bar enables you to narrow-down quickly to a particular instance/client/application/data center, when you have:
-
A large enterprise with many data centers
-
Configured many NetScaler instances for each data center
-
Configured many applications deployed or accessed through each NetScaler instance
-
Clients accessing the application from different locations
Place the mouse pointer on the search bar and select the category that you want to create the filter.
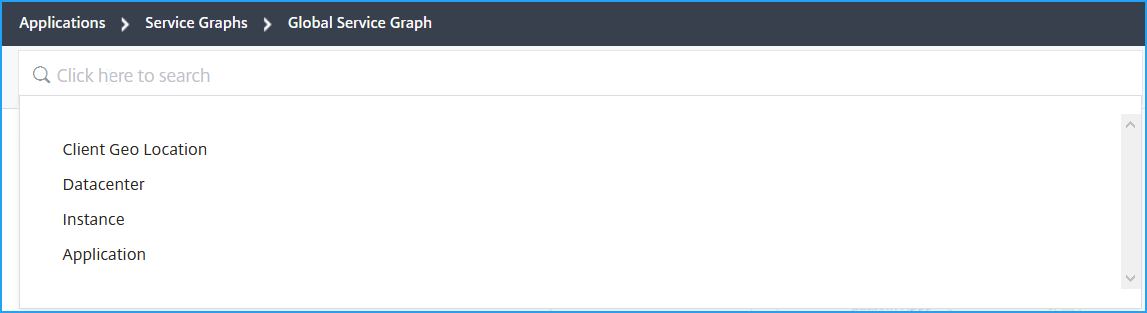
For example, if you want to view a particular NetScaler instance, select Instance from the search bar and select the instance IP address. The global service graph displays the selected instance and its associated applications, data centers, and client locations.