
Integration with New Relic
You can now integrate {{page.adm-product-name-short}} with New Relic to view analytics for WAF, Bot, SSL, Gateway Insights, and NetScaler Console audit logs in your New Relic dashboard. With this integration, you can:
-
Combine all other external data sources in your New Relic dashboard.
-
Get visibility of analytics in a centralized place.
{{page.adm-product-name-short}} collects Bot, WAF, SSL, Gatewat Insights, and NetScaler Console audit logs events, and sends them to New Relic immediately. As an administrator, you can also view these events in your New Relic dashboard.
Related information
Prerequisites
For a successful integration, you must:
-
Obtain a New Relic event endpoint in the following format:
https://insights-collector.newrelic.com/v1/accounts/<account_id>/eventsFor more information on configuring an event endpoint, see New Relic documentation.For more information on getting an account ID, see New Relic documentation. -
Obtain a New Relic key. For more information, see New Relic documentation.
-
Add the key details in {{page.adm-product-name-short}}
Add the key details in
After you generate a token, you must add details in {{page.adm-product-name-short}} to integrate with New Relic.
-
Log on to {{page.adm-product-name-short}}.
-
Navigate to Settings > Observability Integration.
-
In the Integrations page, click Add.
-
In the Create Subscription page, specify the following details:
-
Specify a name of your choice in the Subscription Name field.
-
Select NetScaler® Console as the Source and click Next.
-
Select New Relic and click Configure. In the Configure Endpoint page:
-
End Point URL – Specify the New Relic end point details. The end point must be in the
https://insights-collector.newrelic.com/v1/accounts/<account_id>/eventsformat.
Note:It is recommended to use HTTPS for security reasons. -
-
Authentication token – Copy and paste the authentication token from New Relic.
-
Click Submit.
-
-
Click Next.
-
Click Add Insights and in the Select Feature tab, you can select the features that you want to export and click Add Selected.Note:If you have selected NetScaler Console Audit Logs, you can select Daily or Hourly for the frequency to export audit logs to New Relic.
-
Click Next.
-
In the Select Instance tab, you can either choose Select All Instances or Custom select, and then click Next.
-
Select All Instances - Exports data to New Relic from all the {{page.citrix-adc-generic}} instances.
-
Custom select - Enables you to select the {{page.citrix-adc-generic}} instances from the list. If you select specific instances from the list, then the data is exported to New Relic only from the selected {{page.citrix-adc-generic}} instances.
-
-
Click Submit.Note:
-
The data for the selected insights gets pushed to New Relic immediately after the violations are detected in {{page.adm-product-name-short}}.
-
-
The configuration is complete. You can view details in the Subscriptions page.
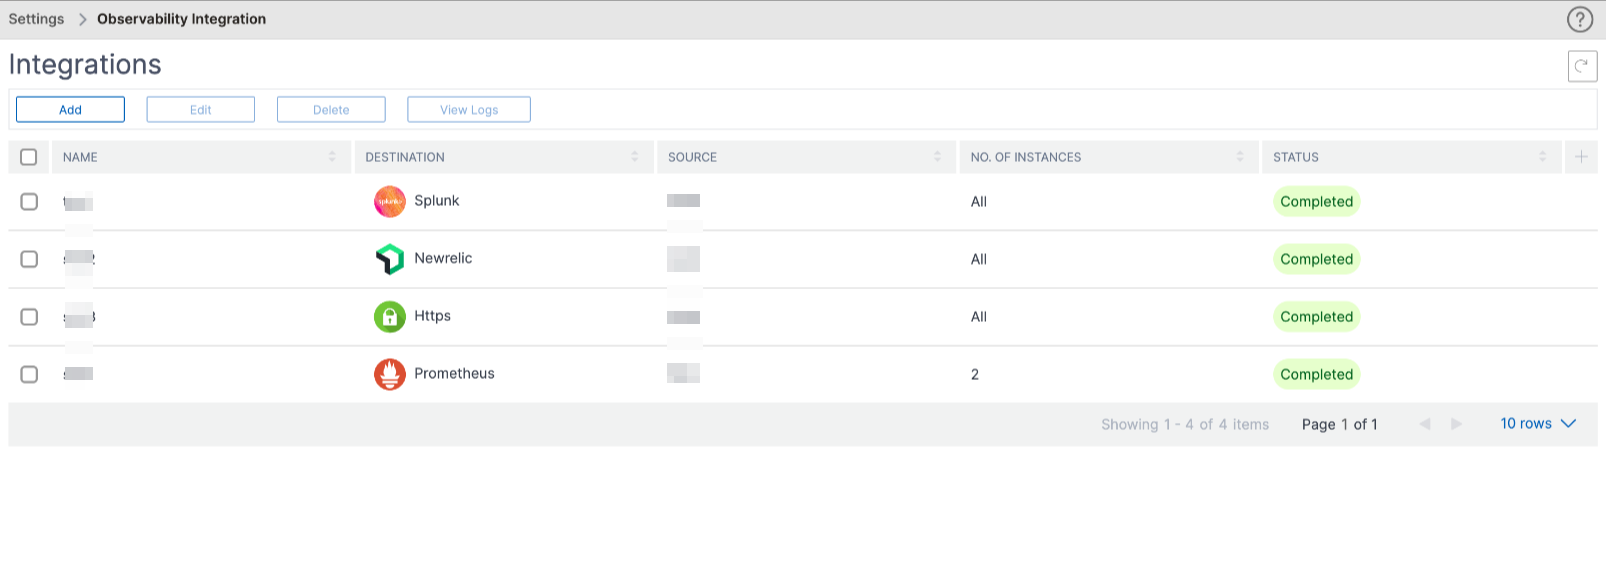
New Relic dashboard
When the events are exported in New Relic, you can view event details under Metrics & events in the following JSON format:
<subsription_name>_adm_<event name> where event name can be Bot, WAF, and so on.
In the following example, ADMSTAGING is the
<subscription_name> and bot is the <event_name>.
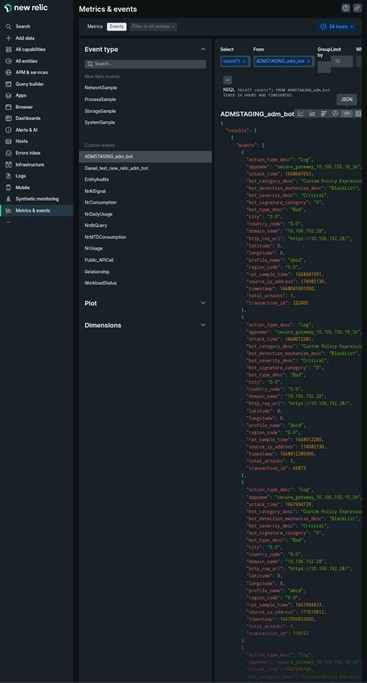
Once you get the JSON data ingested into your New Relic dashboard, as an administrator, you can use the NRQL (New Relic Query Language) and create a custom dashboard with facets and widgets based on your choice by constructing queries around the ingested data. For more information, see
https://docs.newrelic.com/docs/query-your-data/nrql-new-relic-query-language/get-started/introduction-nrql-new-relics-query-language/
The following is an example dashboard created using the NRQL:
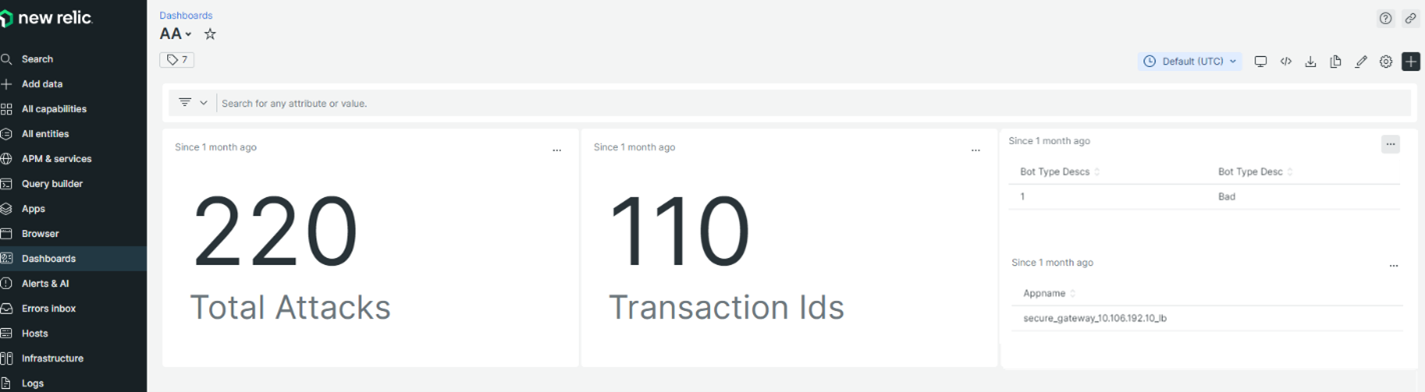
To create this dashboard, the following queries are required:
-
Widget 1: Total Unique Attacks in events table
SELECT count(total_attacks) from <event_name> since 30 days ago -
Widget 2: Unique Transaction IDs in event table
SELECT uniqueCount(transaction_id) from <event_name> since 30 days ago -
Widget 3: Total Unique Bot Types and their counts
SELECT uniqueCount(bot_type_desc), uniques(bot_type_desc) from <event_name> since 30 days ago -
Widget 4: Total unique App Names seeing Bot Violations
SELECT uniques(appname) from <event_name> since 30 days ago