Application details
Note:
Starting from 14.1 20.x build, you can view metrics details for applications that are created from the NetScaler admin partitions.
Click an application from the dashboard to drill down for further detailed information.
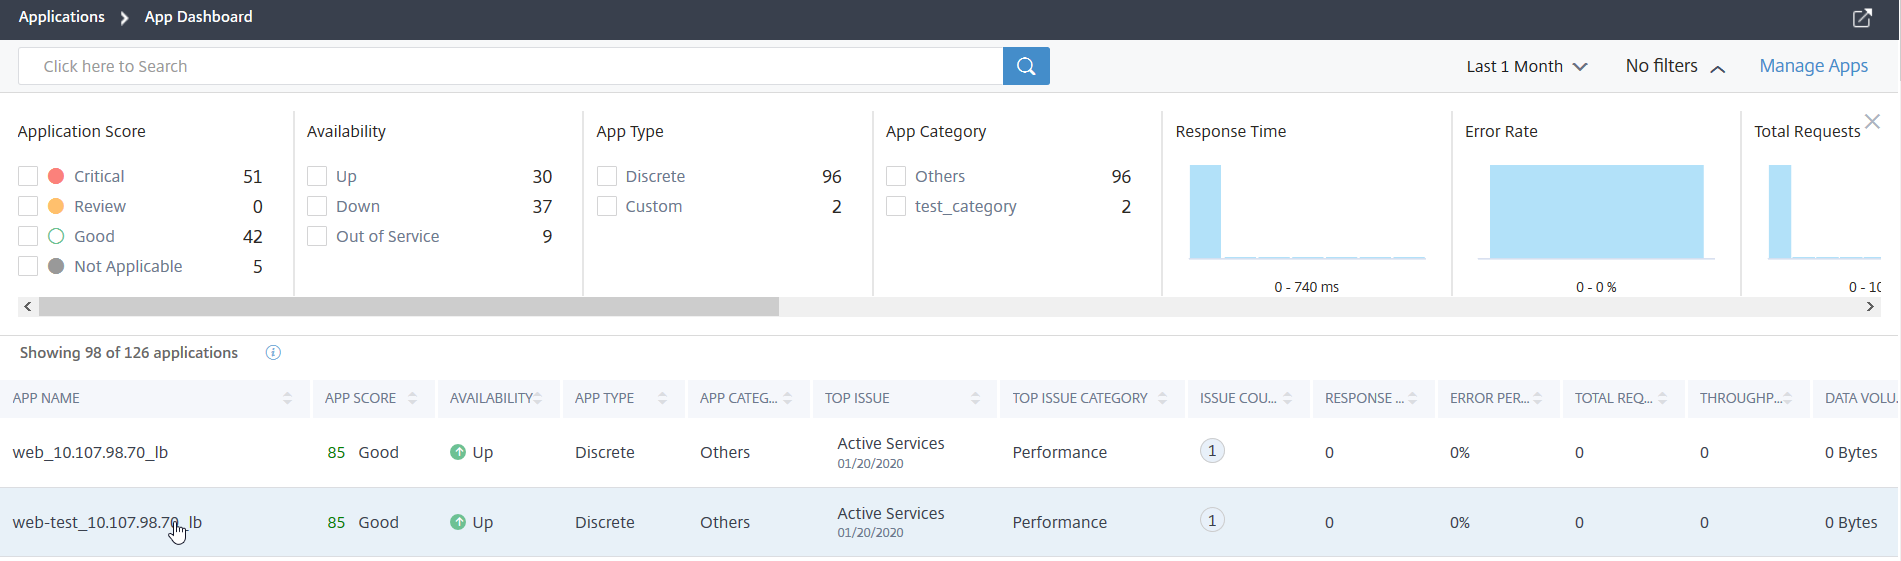
The selected application page is displayed.

From the application details page:
-
Select the time duration from the list to view details for the specific time duration
-
Click Service Graph to view service graph for the selected application. For more information, see Service Graph for Applications
-
Click Transaction Logs to view the detailed transactions for the selected application
-
Click Audit logs to view the detailed audit log information
-
Click Configure to view or edit the service and service group configuration for the selected application
-
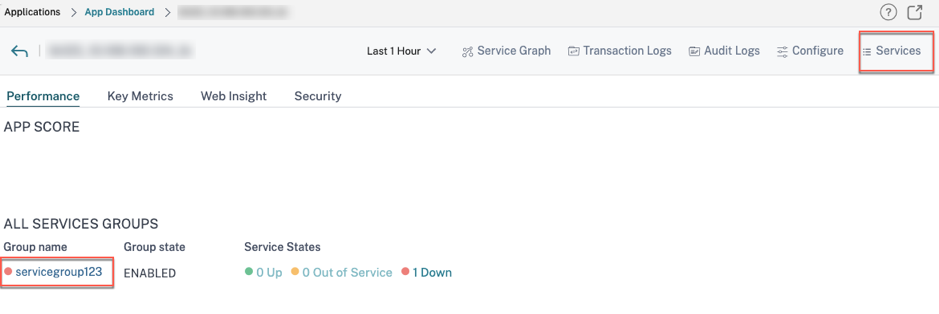
Click Service to view services that bound to the application
After you select the time duration, the following application details are displayed:
-
App Score – The application score for the selected time duration. The final score is calculated as 100 minus total penalty.
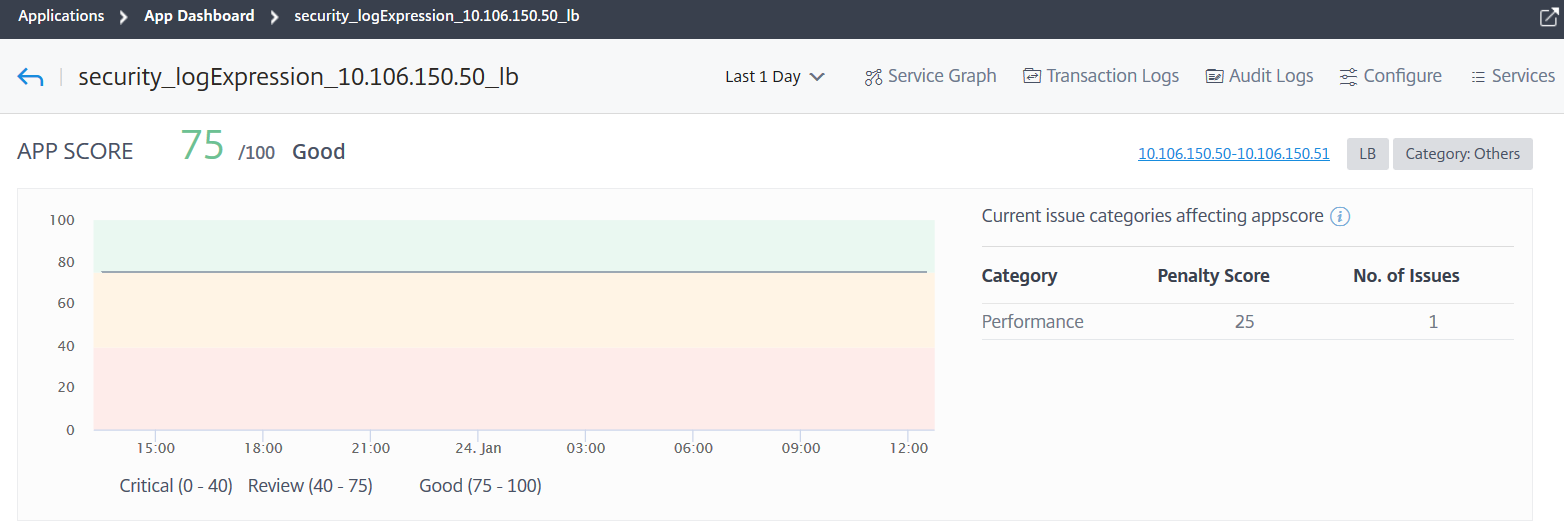 This dashboard also enables you to view the current issues that are affecting the app score. You can view the issues details under Issues.
 -
Virtual Servers –NoteThe Virtual Servers section is displayed only for the custom applications. For discrete applications, click the IP address to view the virtual server details.
 Displays all virtual servers associated with the custom application
 Click View Details to view and manage the virtual server settings.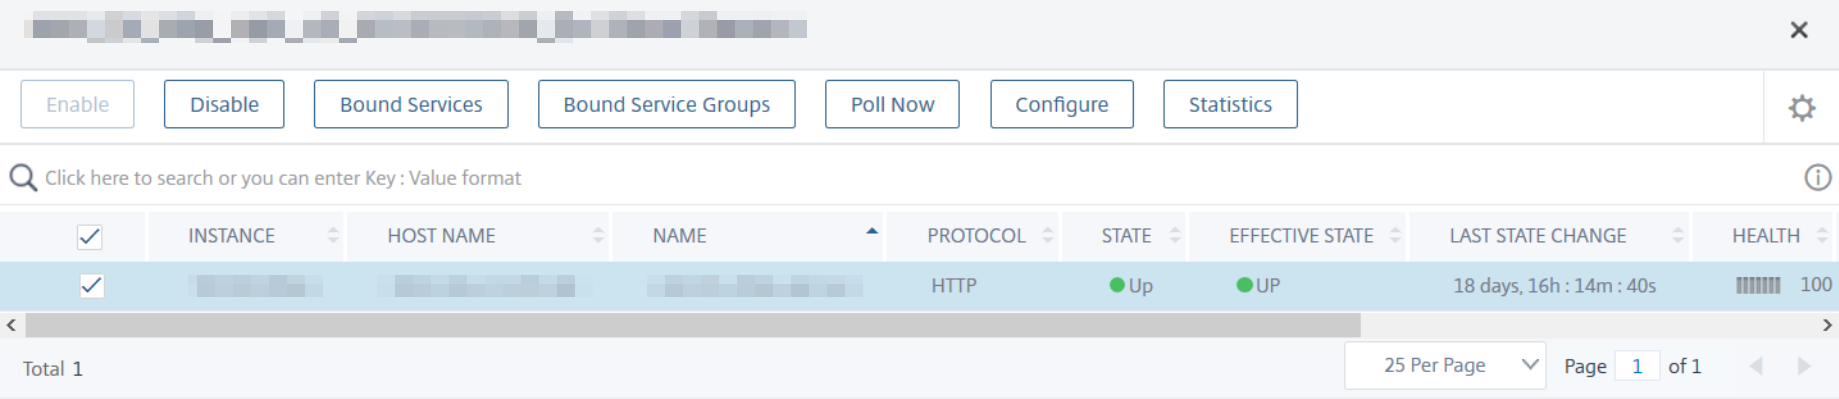
-
All Services – The services that are bound to the application
 Click to view the service details and to manage the service settings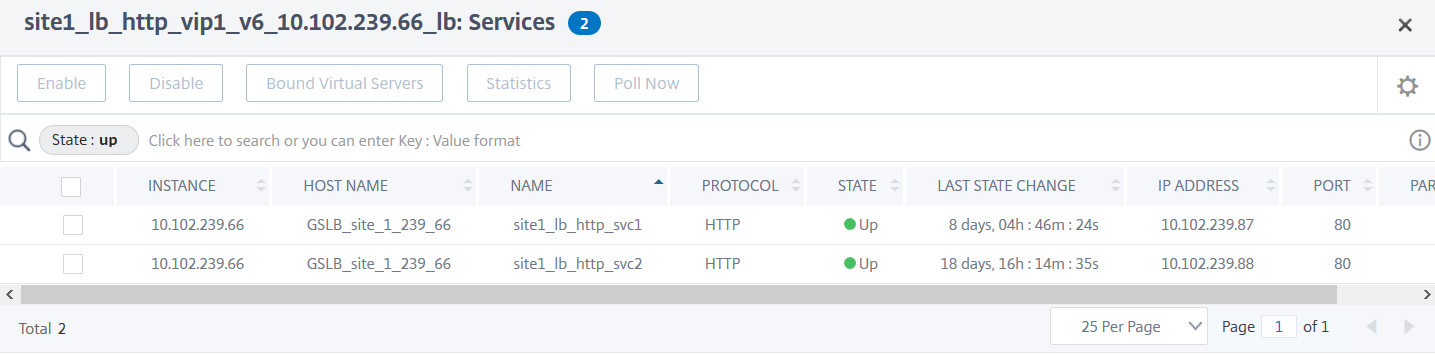
-
Issues – The issues that are applicable for selected application. You can view the following issues along with its category:
Performance Instance Health Config System Resources Response Time Average CPU Usage Unstable Server Improper persistence type Active Services Memory Usage Unusually large HTTP packets NIC Card Saturation Low Session Reuse TCP reassemble queue limit hits App CPU Usage SurgeQueue Buildup SSL Real Time Traffic Session buildup Server response time Service flaps Click each issue to check details such as detection message, when the issue has occurred, Recommended actions, and details.For more information, see Performance indicators for application analytics.The following image is the earlier view of App Activity Investigator page: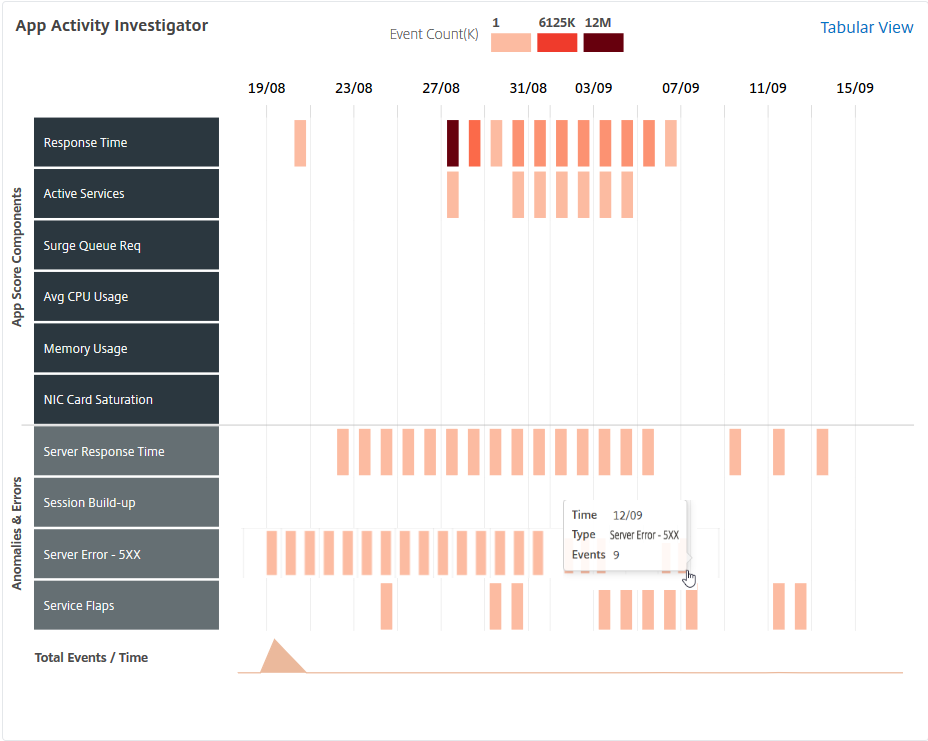 You can now view all issues in the Issues section, along with the category that you were able to view in App Activity Investigator page.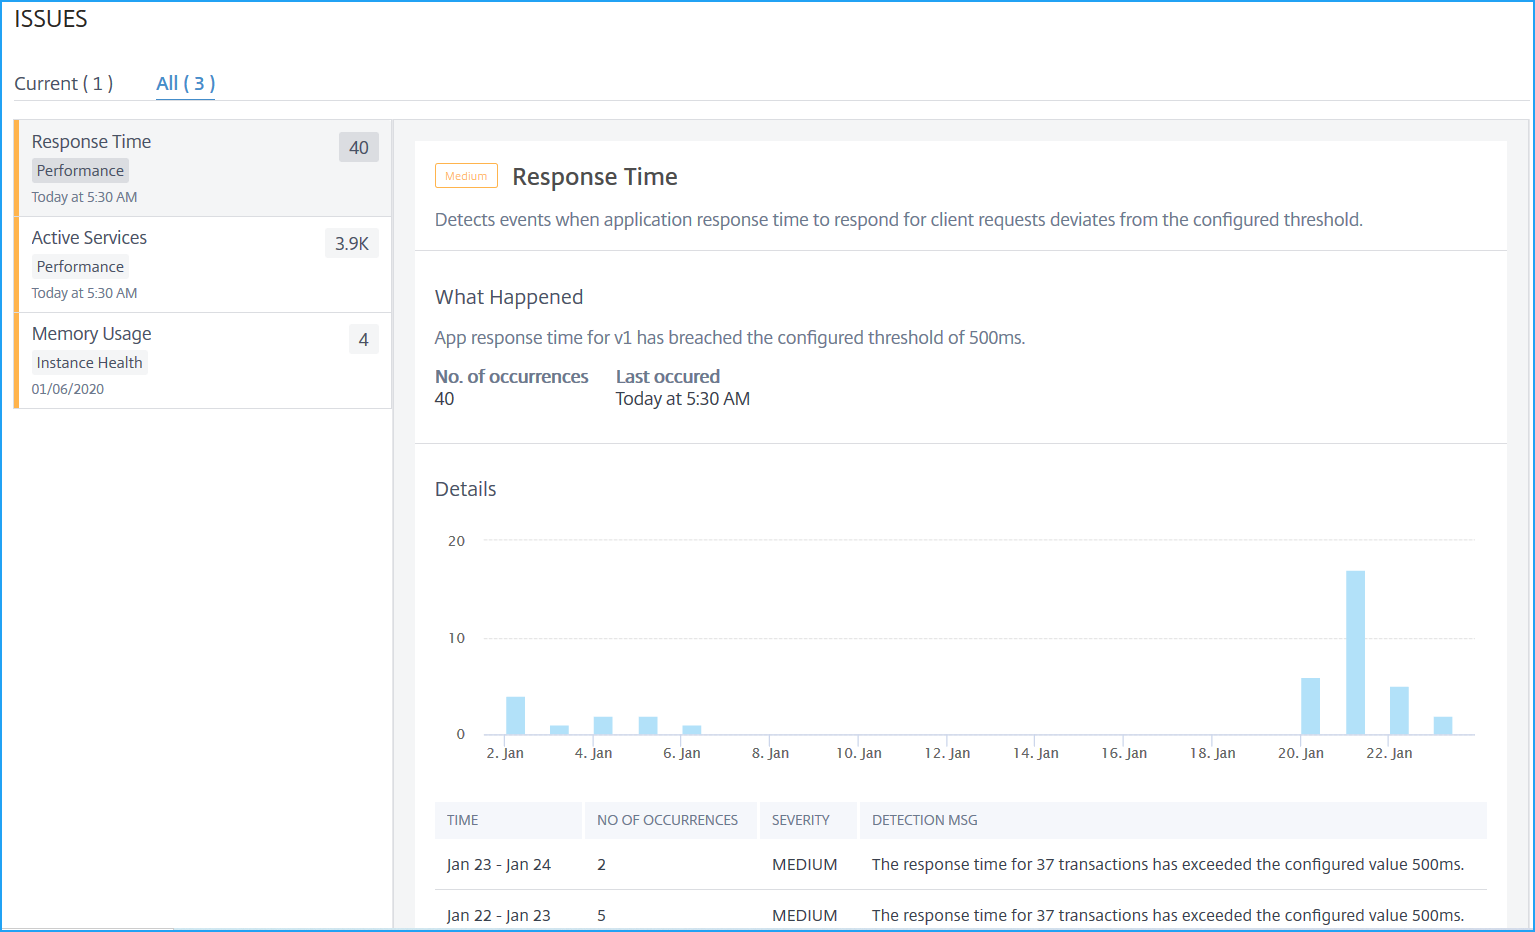
-
The issues that display in Current tab refer to the application issues for the select time duration.
-
The issues that display in All tab refer to total application issues.
The following example is the application issues for 1-day duration. The Current tab indicates no current issues impacting the app score.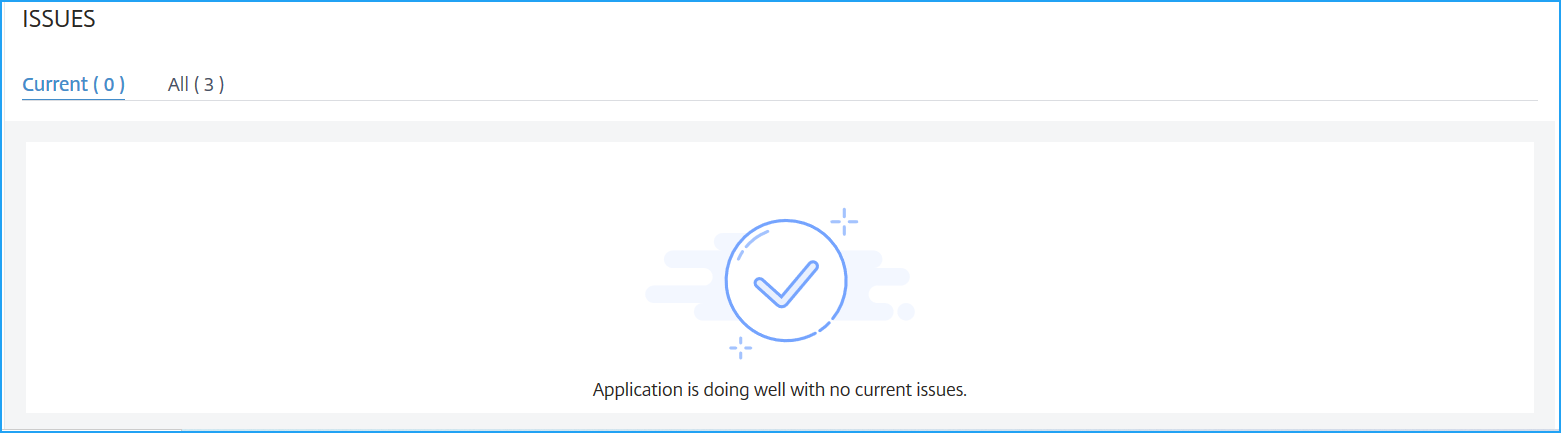 The All tab displays the total issues detected for the 1-day duration.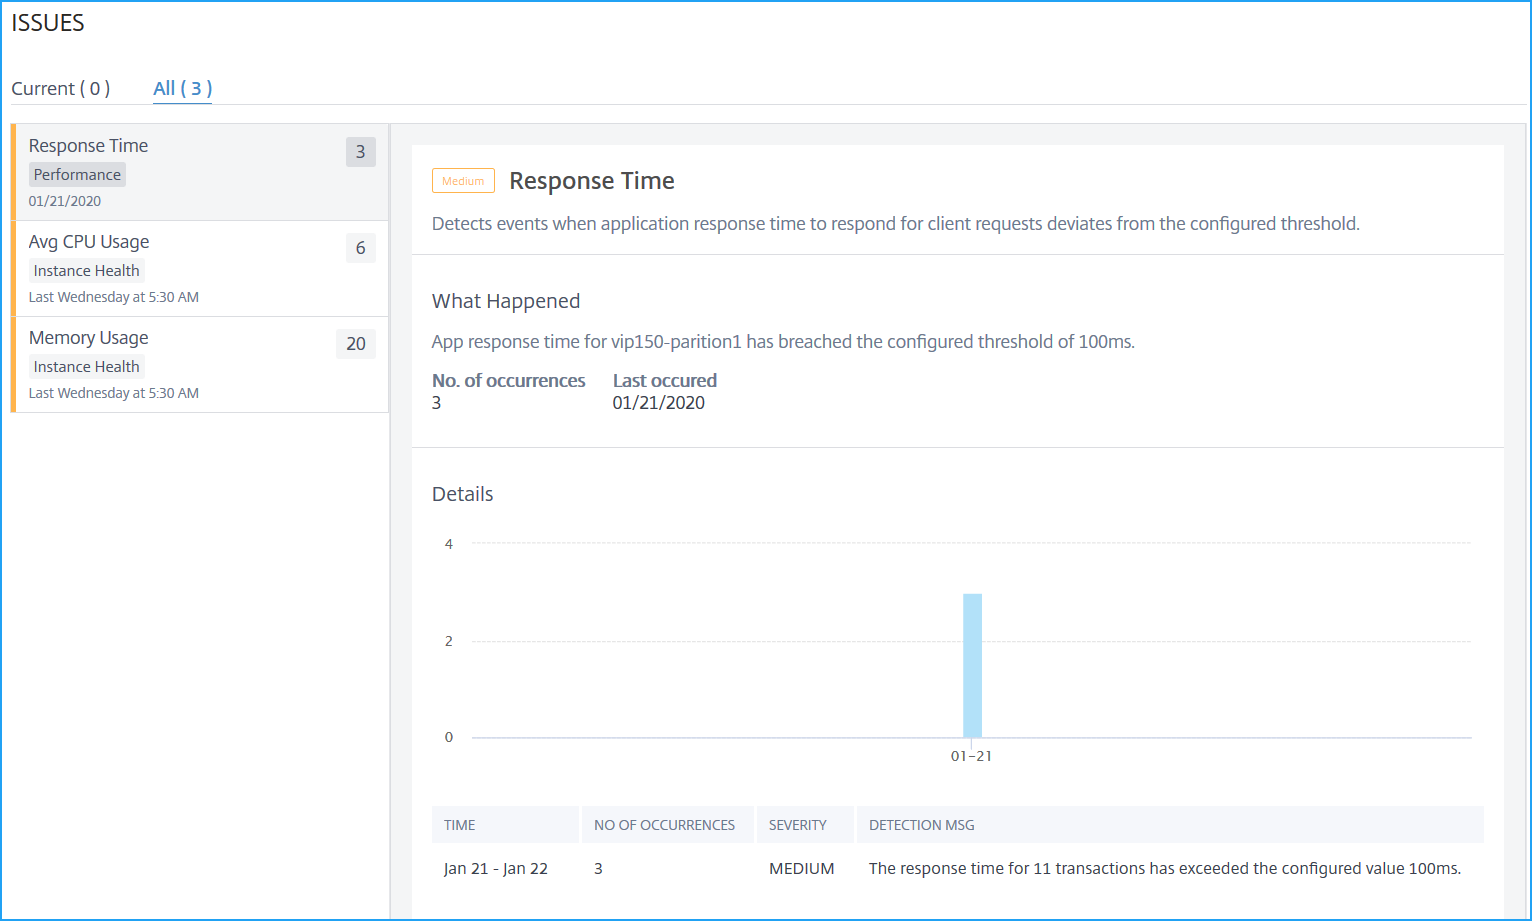
-
Related information
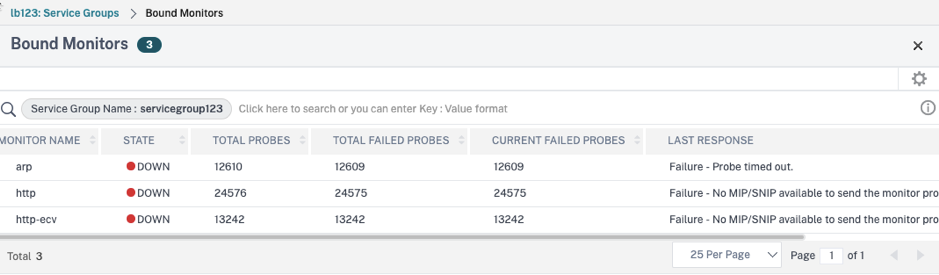
Check monitor status of an application
You can use the application dashboard in the NetScaler Console GUI under Applications > Dashboard, to view the health monitor status of an application and the failure message if any. You can bind health monitors can be bound to service or service group of an application, and a service or service group can have multiple monitors bound to it. Monitors help you monitor your services.
To view the status of the monitors, follow these steps.
-
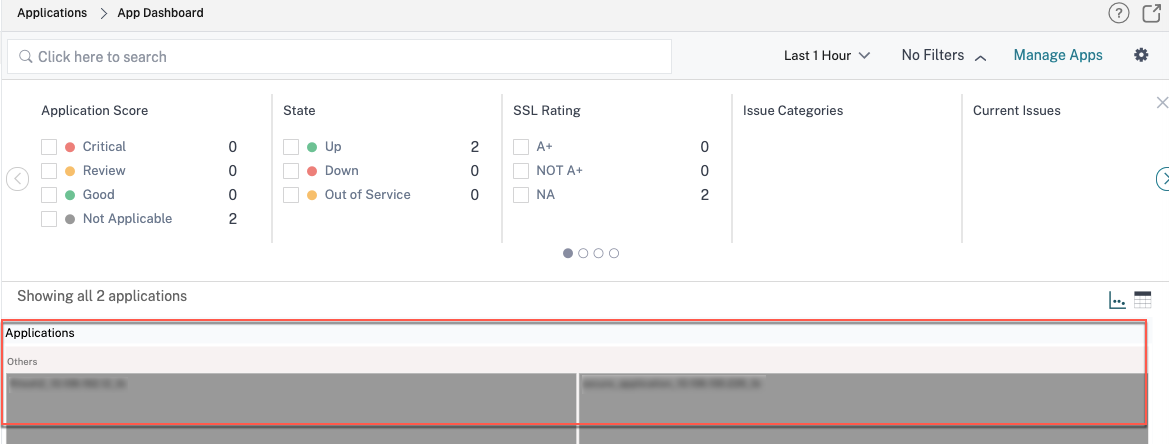
From the NetScaler Console GUI, navigate to Applications > Dashboard. Under Applications, select the application whose health you want to check.
-
Click the application. The app score dashboard appears.
-
Click the Services tab on the upper-right corner or the service group under Group Name.
-
If you click the Services tab, in the next screen, select the service group.
-
If you click the service group, the Service Groups window appears. Select the instance and click Bound Monitors
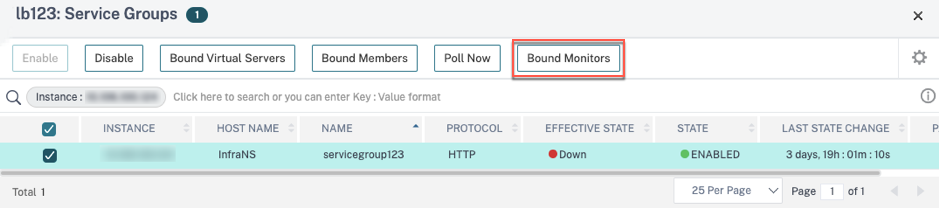 The bound monitor screen appears, showing the health monitor status of the application.