Sample dashboards on Splunk
NetScaler provides sample dashboards on Splunk.
Related information
View a sample dashboard on Splunk
To view sample dashboards on Splunk, do the following:
Prerequisite: Ensure that you have completed the required configurations for export of metrics from NetScaler to Splunk. For more information, see Exporting metrics directly from NetScaler to Splunk.
-
Launch Splunk and navigate to Dashboards.
-
Click Create New Dashboard.
-
Enter a name for the dashboard.
-
Select one of the following options and click Create:
-
Dashboard Studio: Select this option if you are importing a JSON file. Select Absolute layout.
-
Classic Dashboard: Select this option if you are importing an XML file.
-
-
Click the Source icon and remove the default entries (if any).
-
Copy the JSON or XML file content corresponding to the required dashboard and paste it on the Source page. For the list of dashboards supported and its corresponding JSON or XML file name, see List of sample dashboards.
-
Perform one of the following actions based on your selection:
-
If you have pasted JSON file content, then click Back and then Save.
-
If you have pasted XML file content, then click Save.
-
-
Navigate to Dashboards and click the newly created dashboard. Select the required filters such as Index, Time to view the metrics.
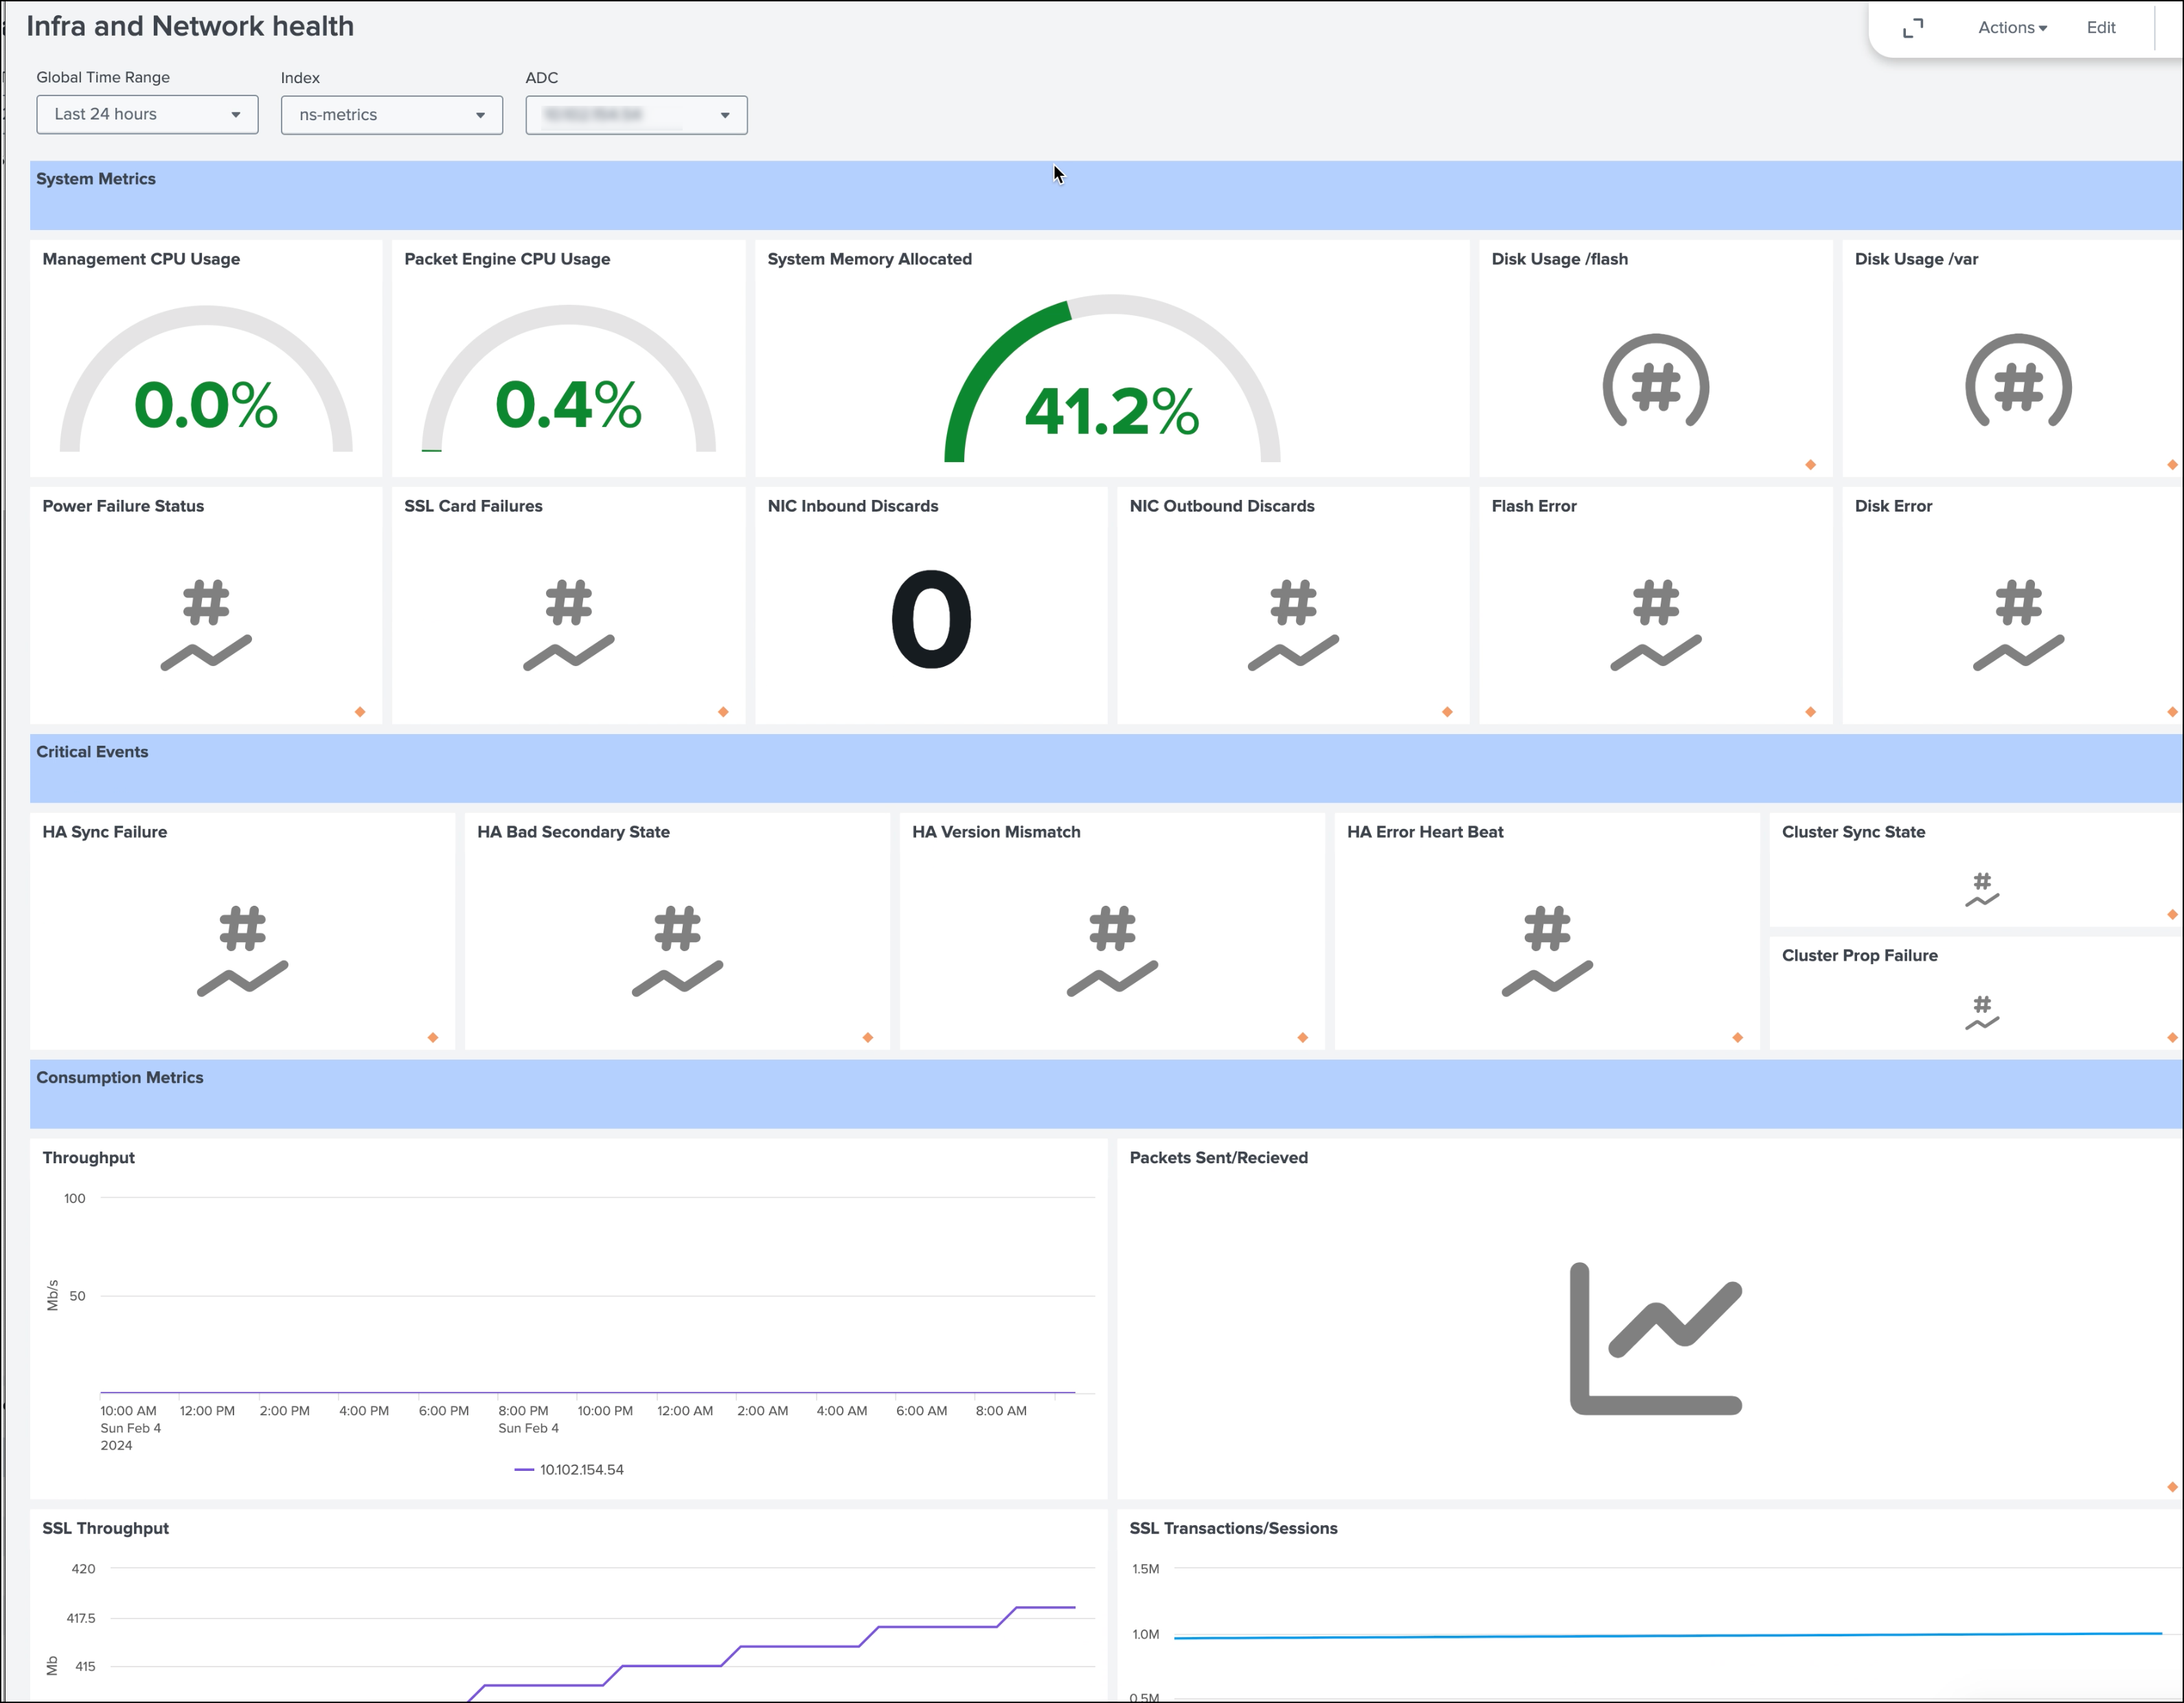
Infra and Network Health Dashboard for NetScaler® ADC
You can use the Infra and Network Health Dashboard for NetScaler ADC dashboard to monitor all the system metrics such as golden signals - latency, traffic, error, saturations, HA sync failures for all NetScalers on a central dashboard to ensure business continuity. The dashboard also helps you assess the health of NetScaler, identify any issues, correlate issues to find the root cause of an issue and probable remediations.
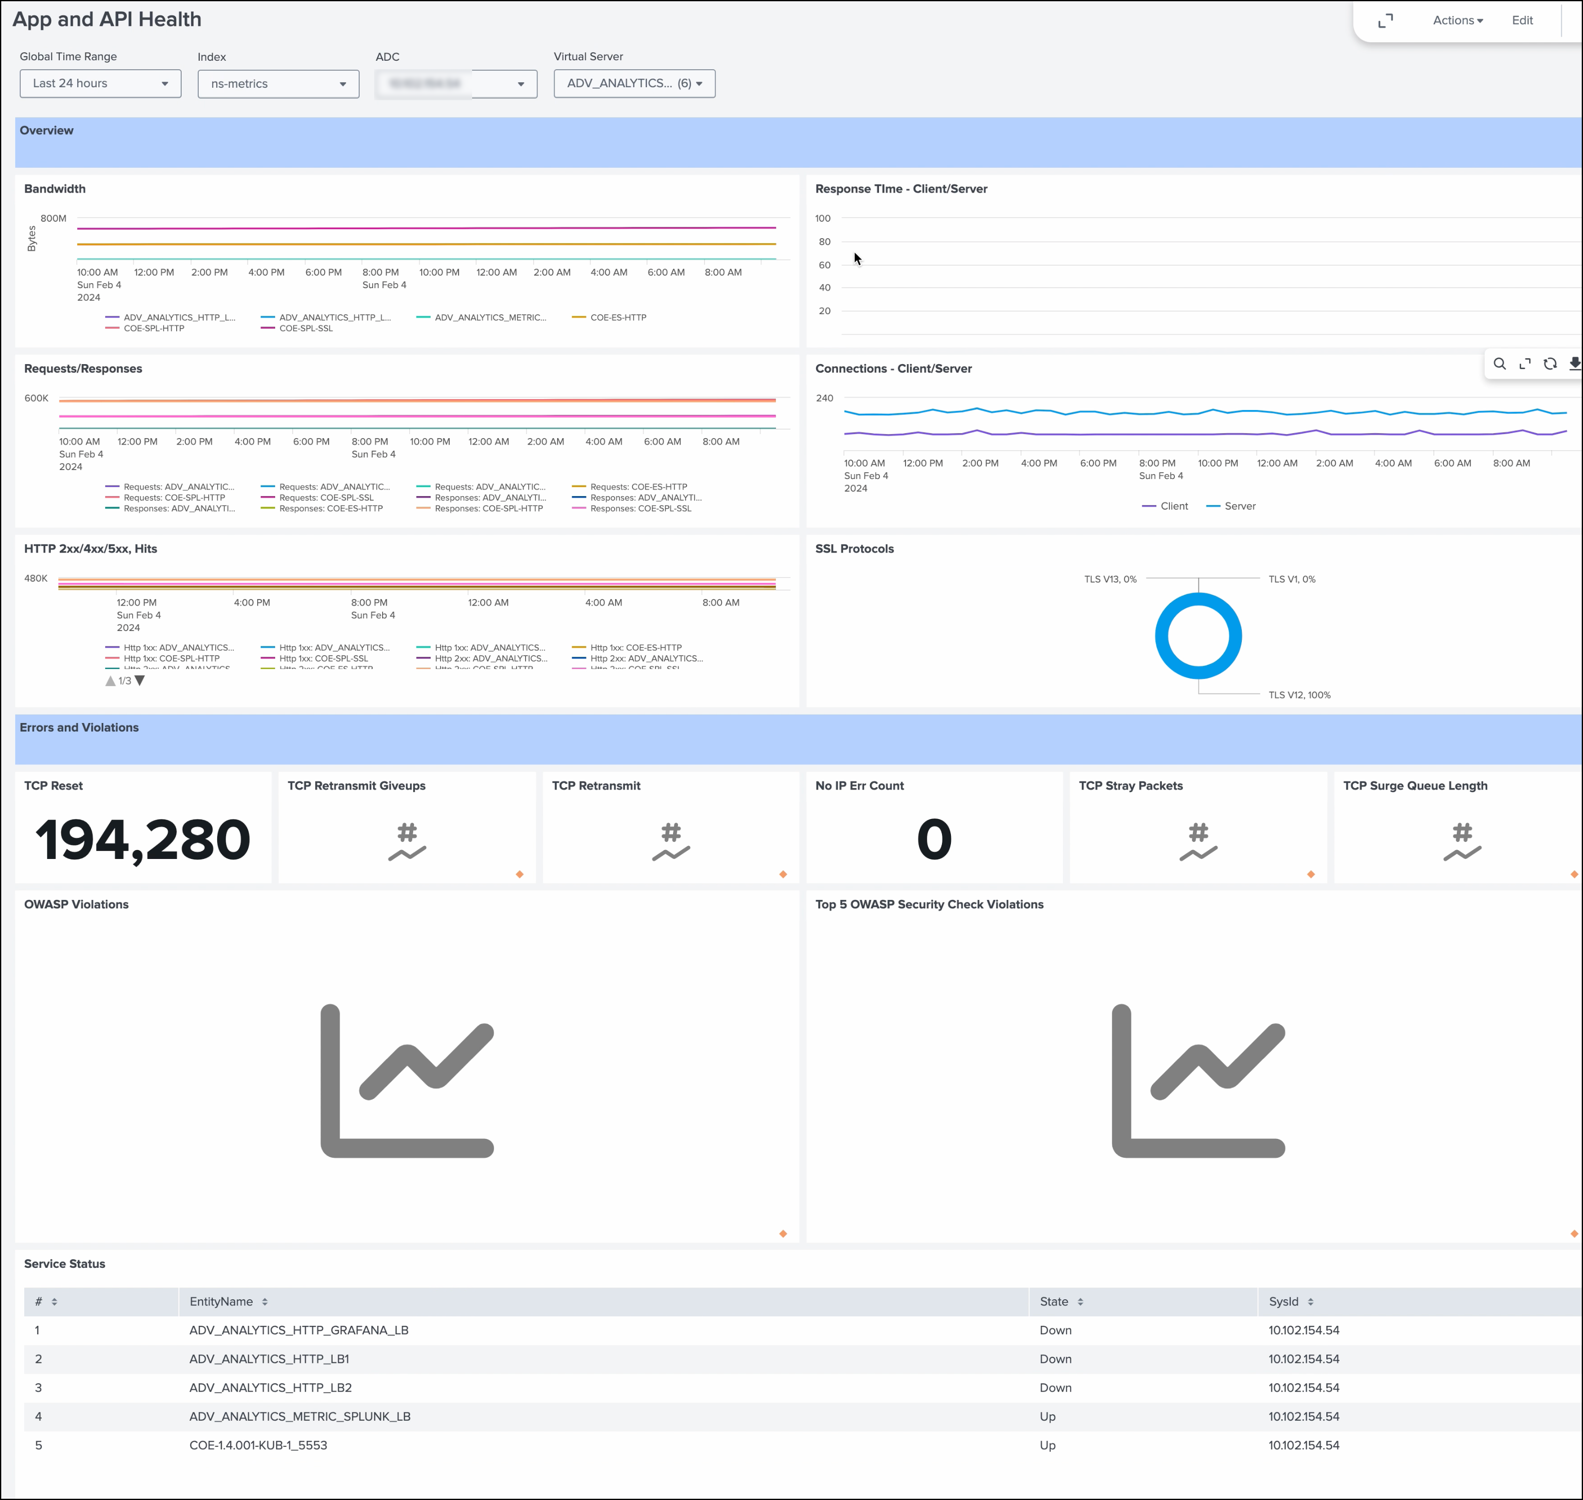
App and API Health Dashboard
You can use the App and API Health Dashboard to monitor the metrics for the web applications and gain clients' insights to ensure a high performing and seamless web experience for end users. With this dashboard, you can understand the average latency for specific apps, major contributors of latency, and back end servers contributing to HTTP errors and so on and correlate these with metrics. Based on the insights, you can decide the actions needed for NetScaler or back-end applications.
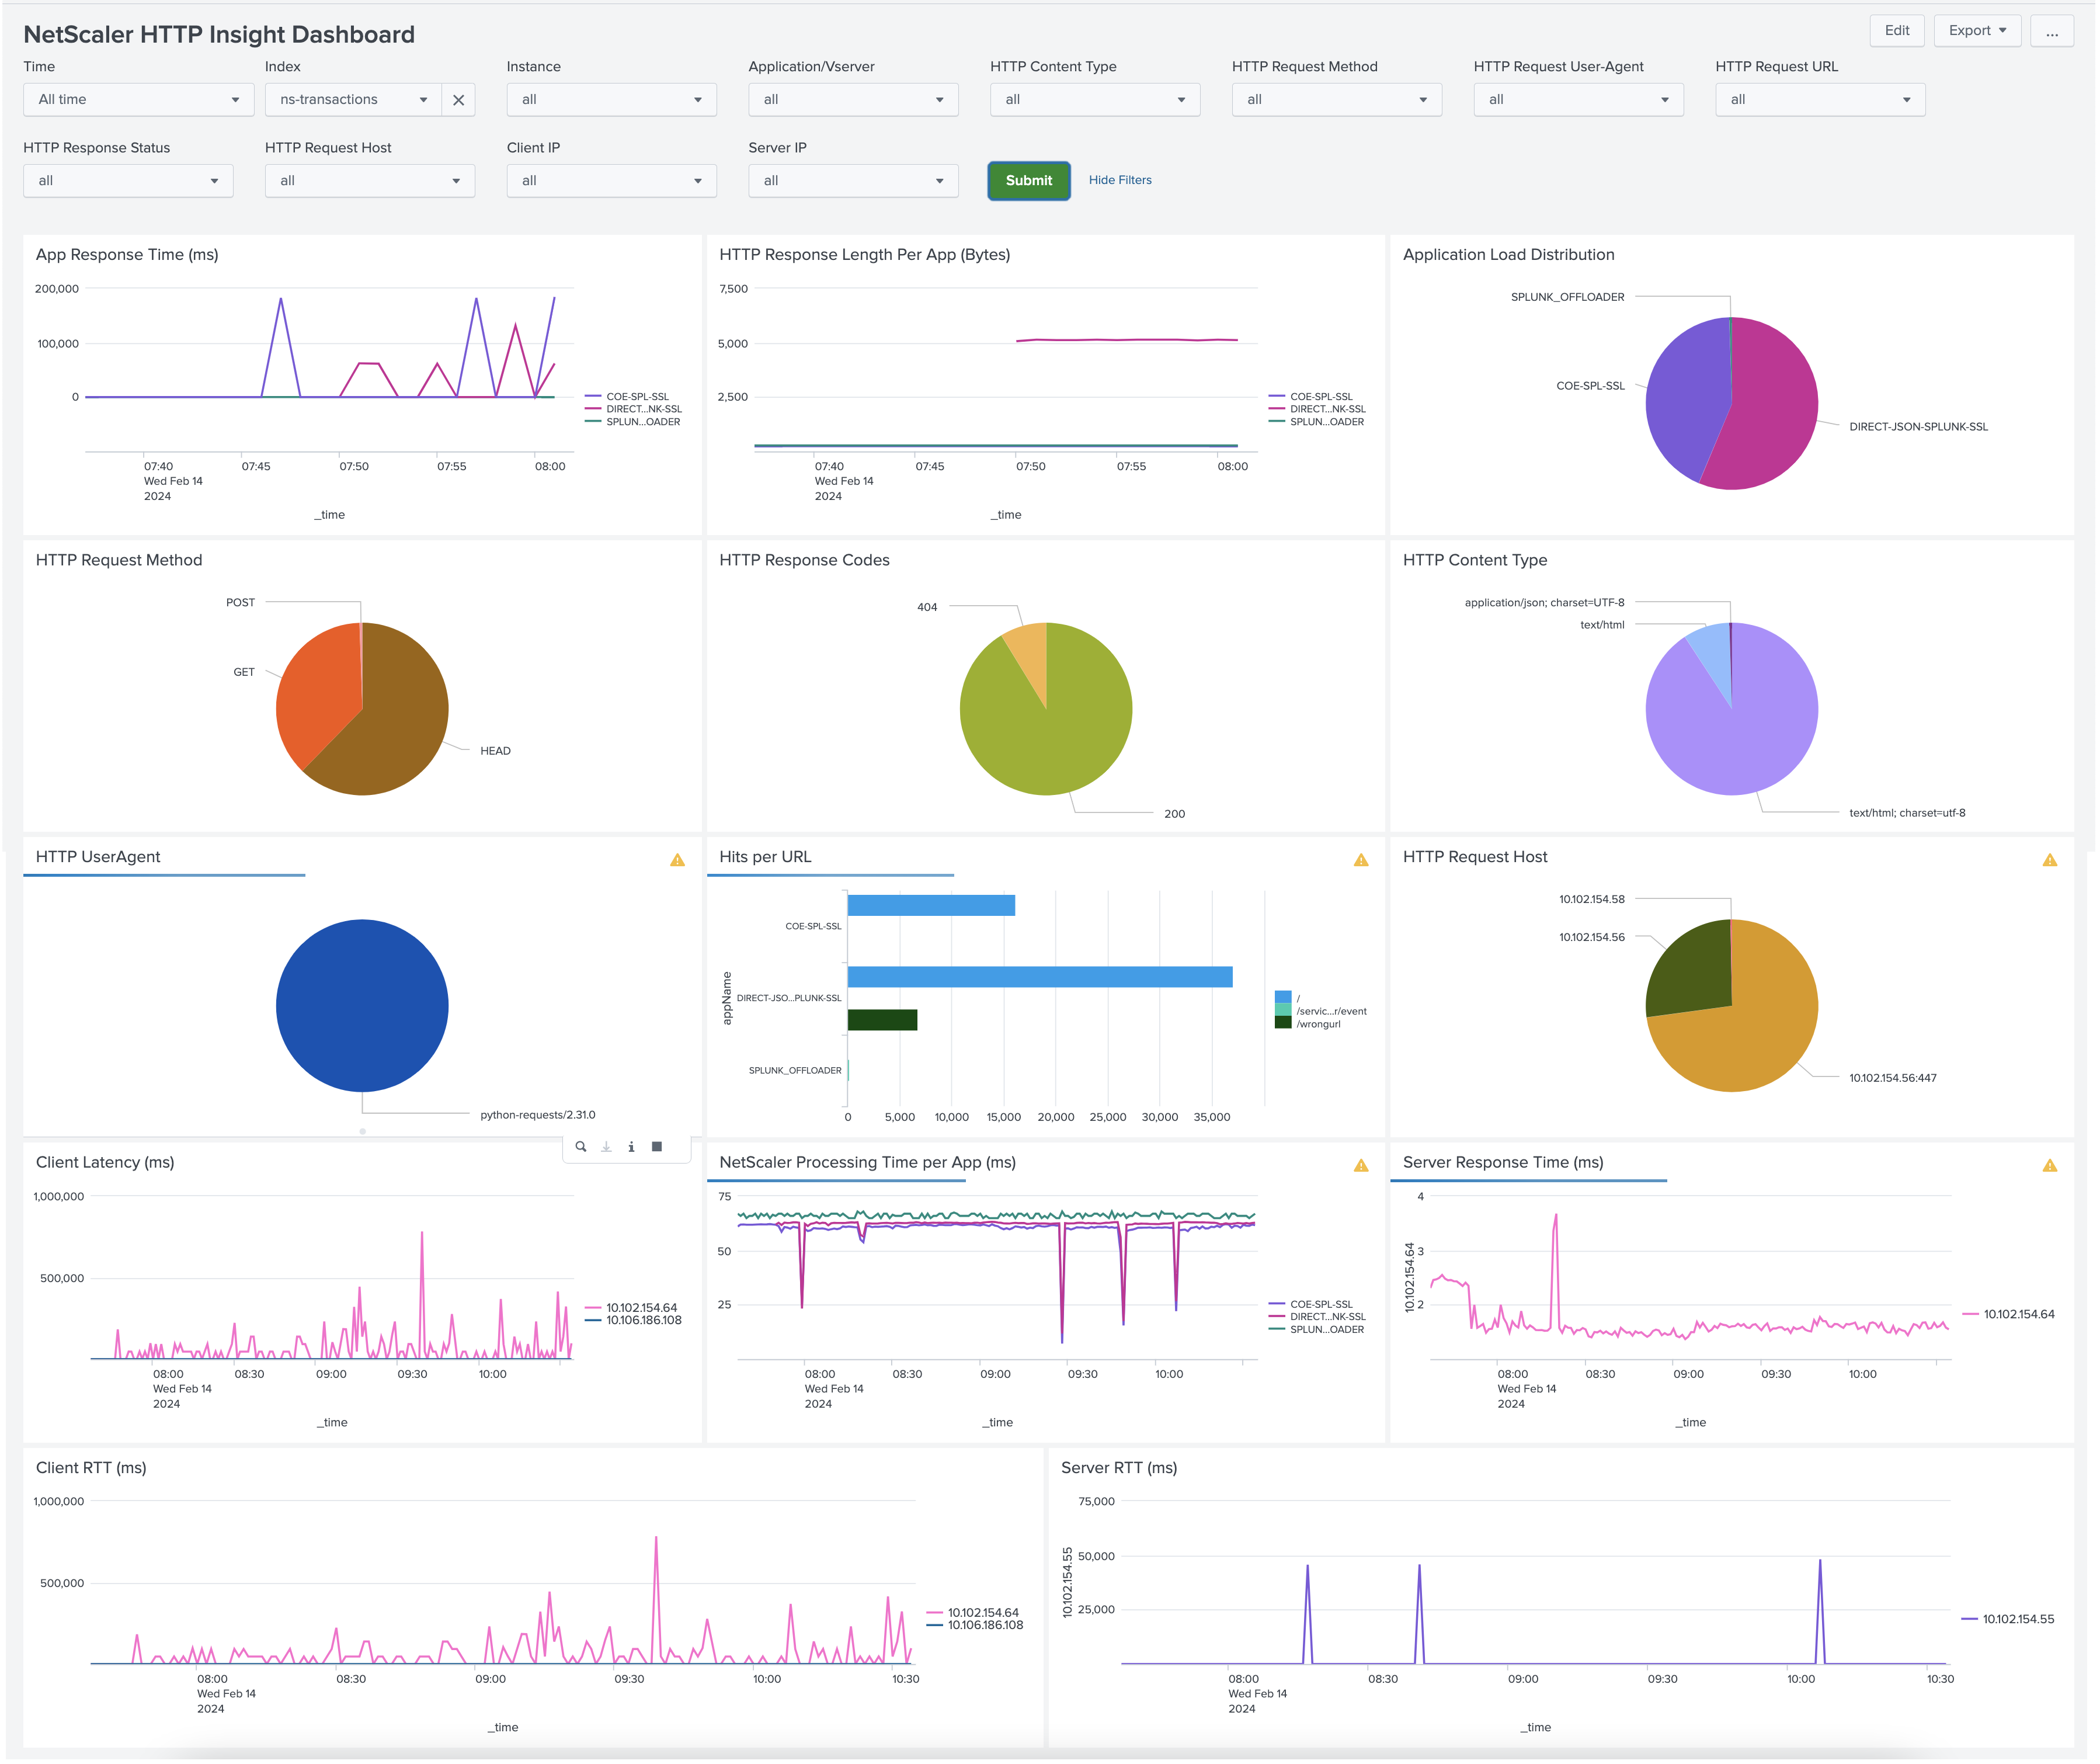
NetScaler HTTP Insight Dashboard
You can use the NetScaler HTTP Insight Dashboard to monitor HTTP traffic. This dashboard is valid for both HTTP and HTTPS traffic, and includes data such as Response Time, Latency, NetScaler Processing Time at Layer 7, distributions such as Application Load, Response Length, Host, URL, Method, and some common HTTP headers.
NetScaler SSL Insight Dashboard
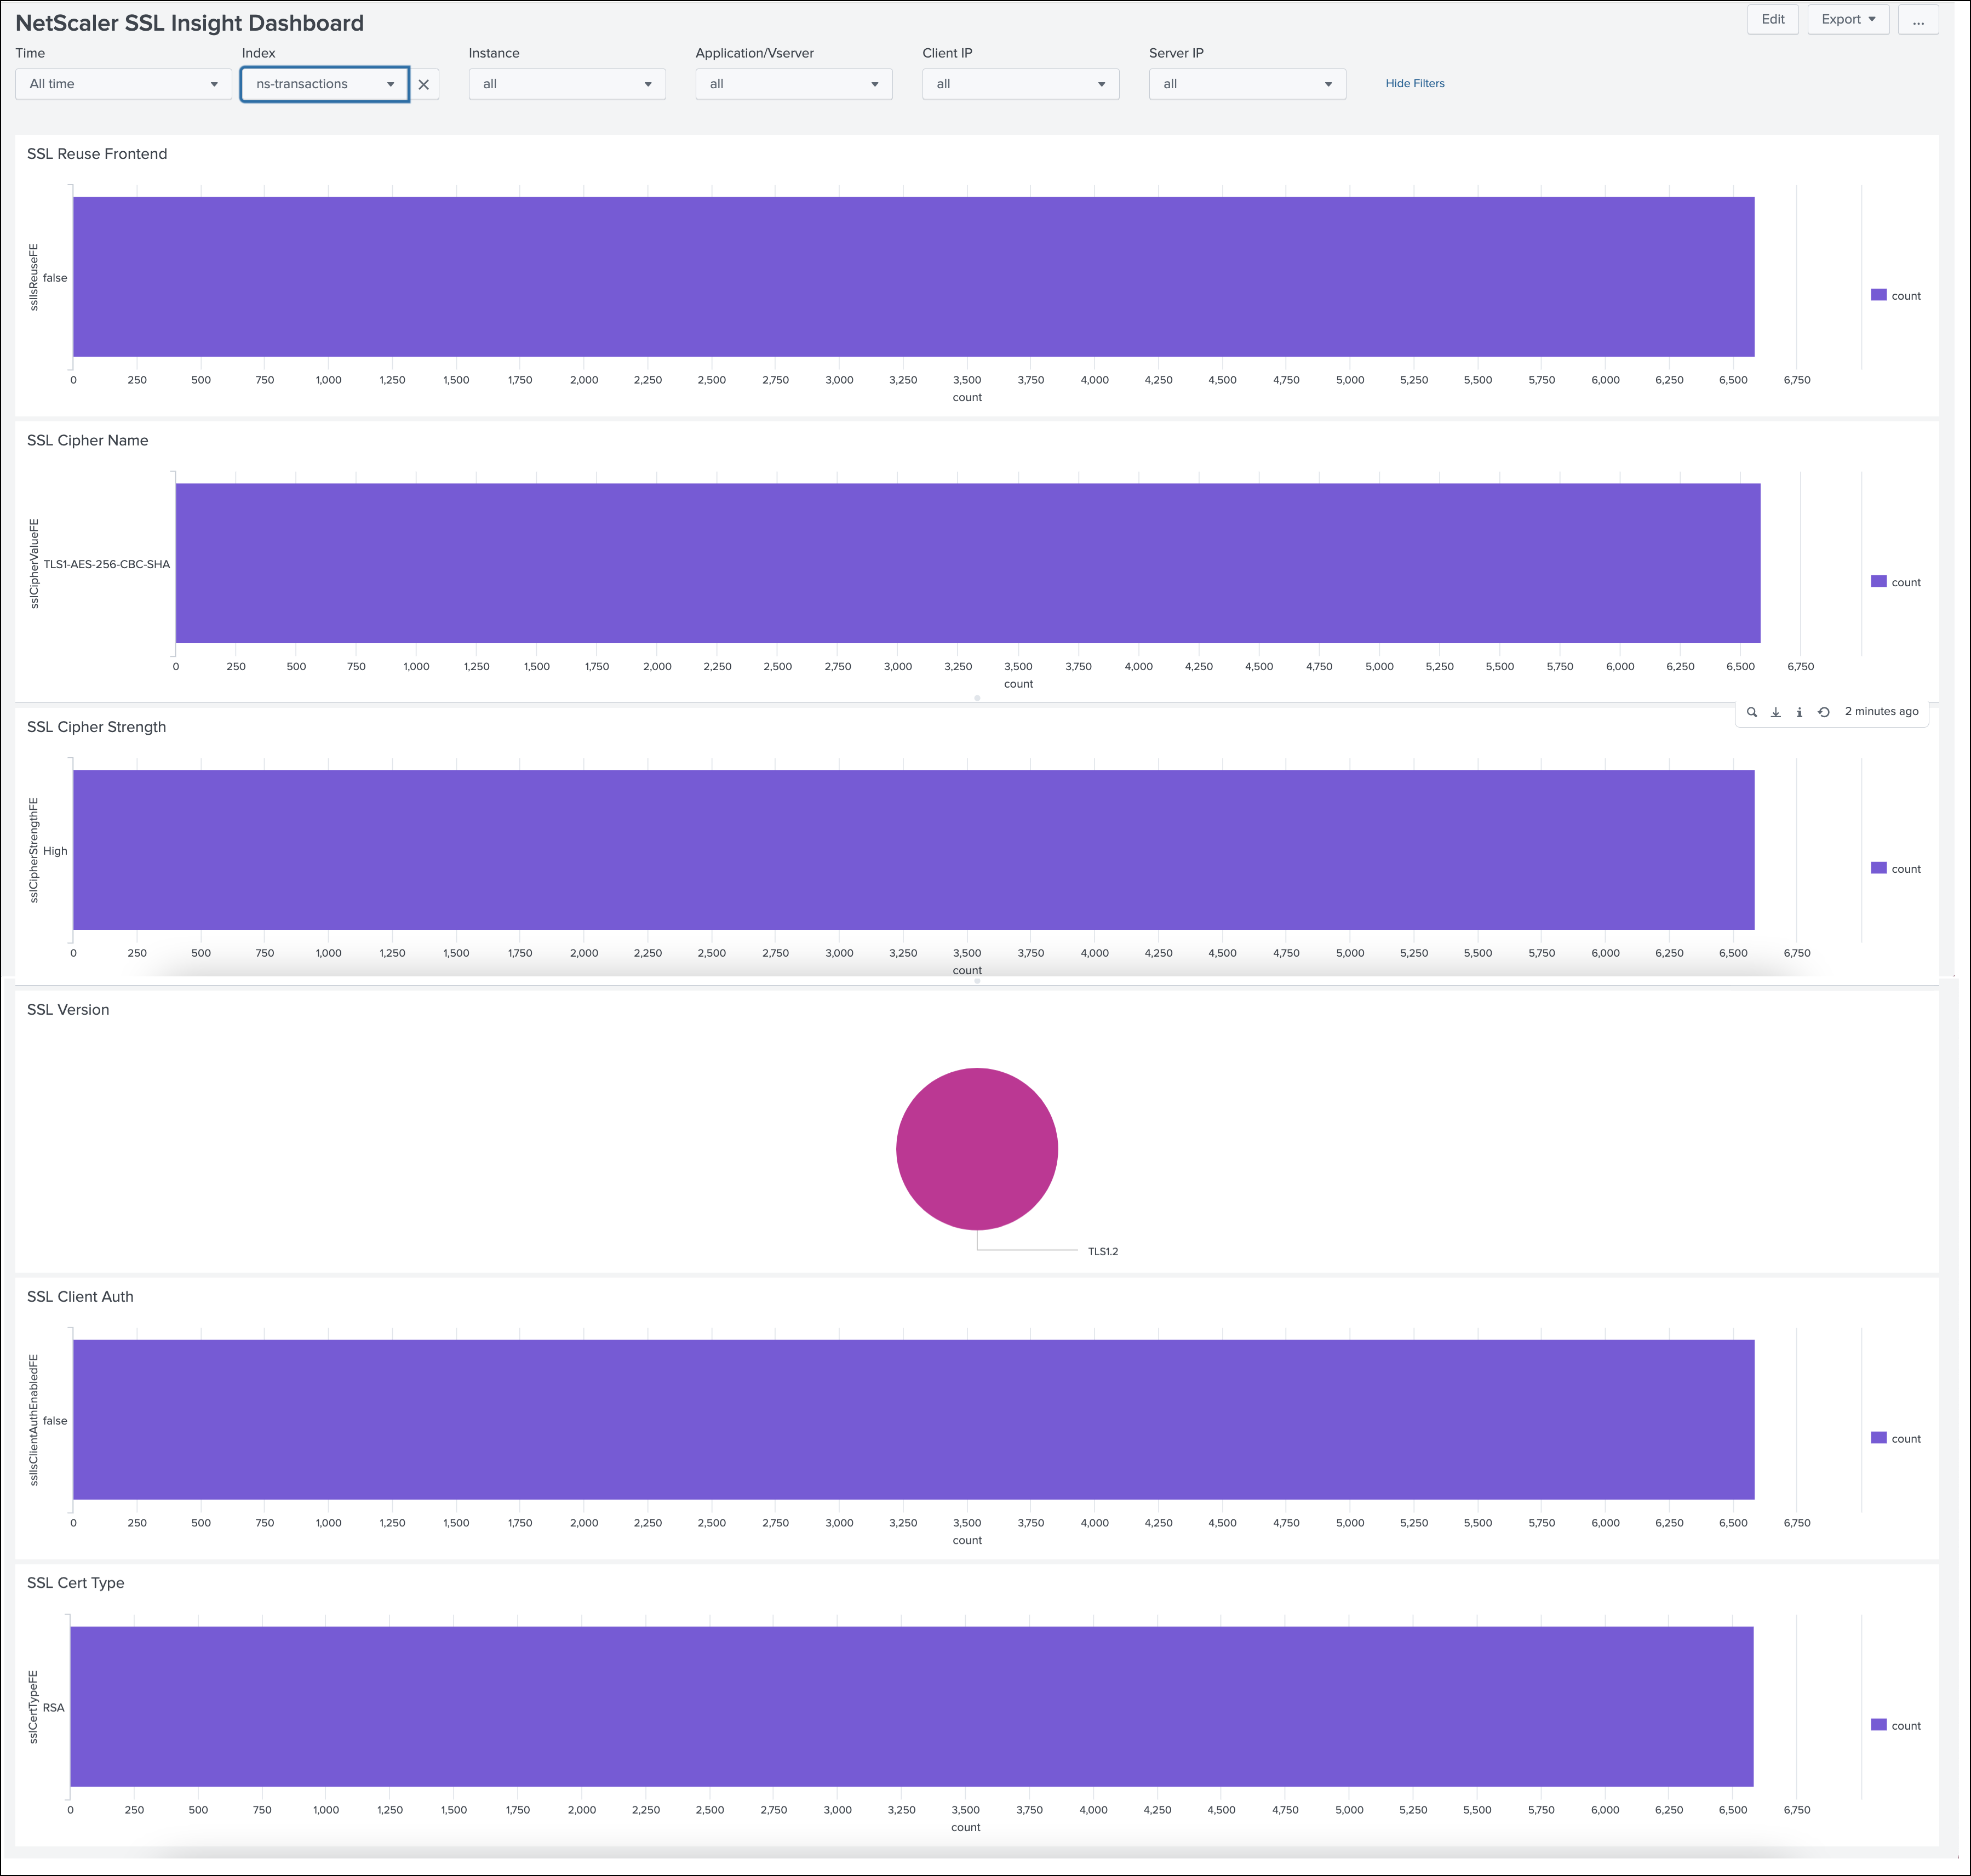
You can use the NetScaler SSL Insight Dashboard to monitor SSL traffic. This dashboard includes TLS/SSL transactions or sessions related fields that are commonly looked for such as ciphers and their strengths, TLS/SSL versions, certificate types. As HTTPS operates on TLS, you can correlate the data in this dashboard with the NetScaler HTTP Insight Dashboard to get holistic insights about the HTTPS traffic.
NetScaler TCP Insight Dashboard
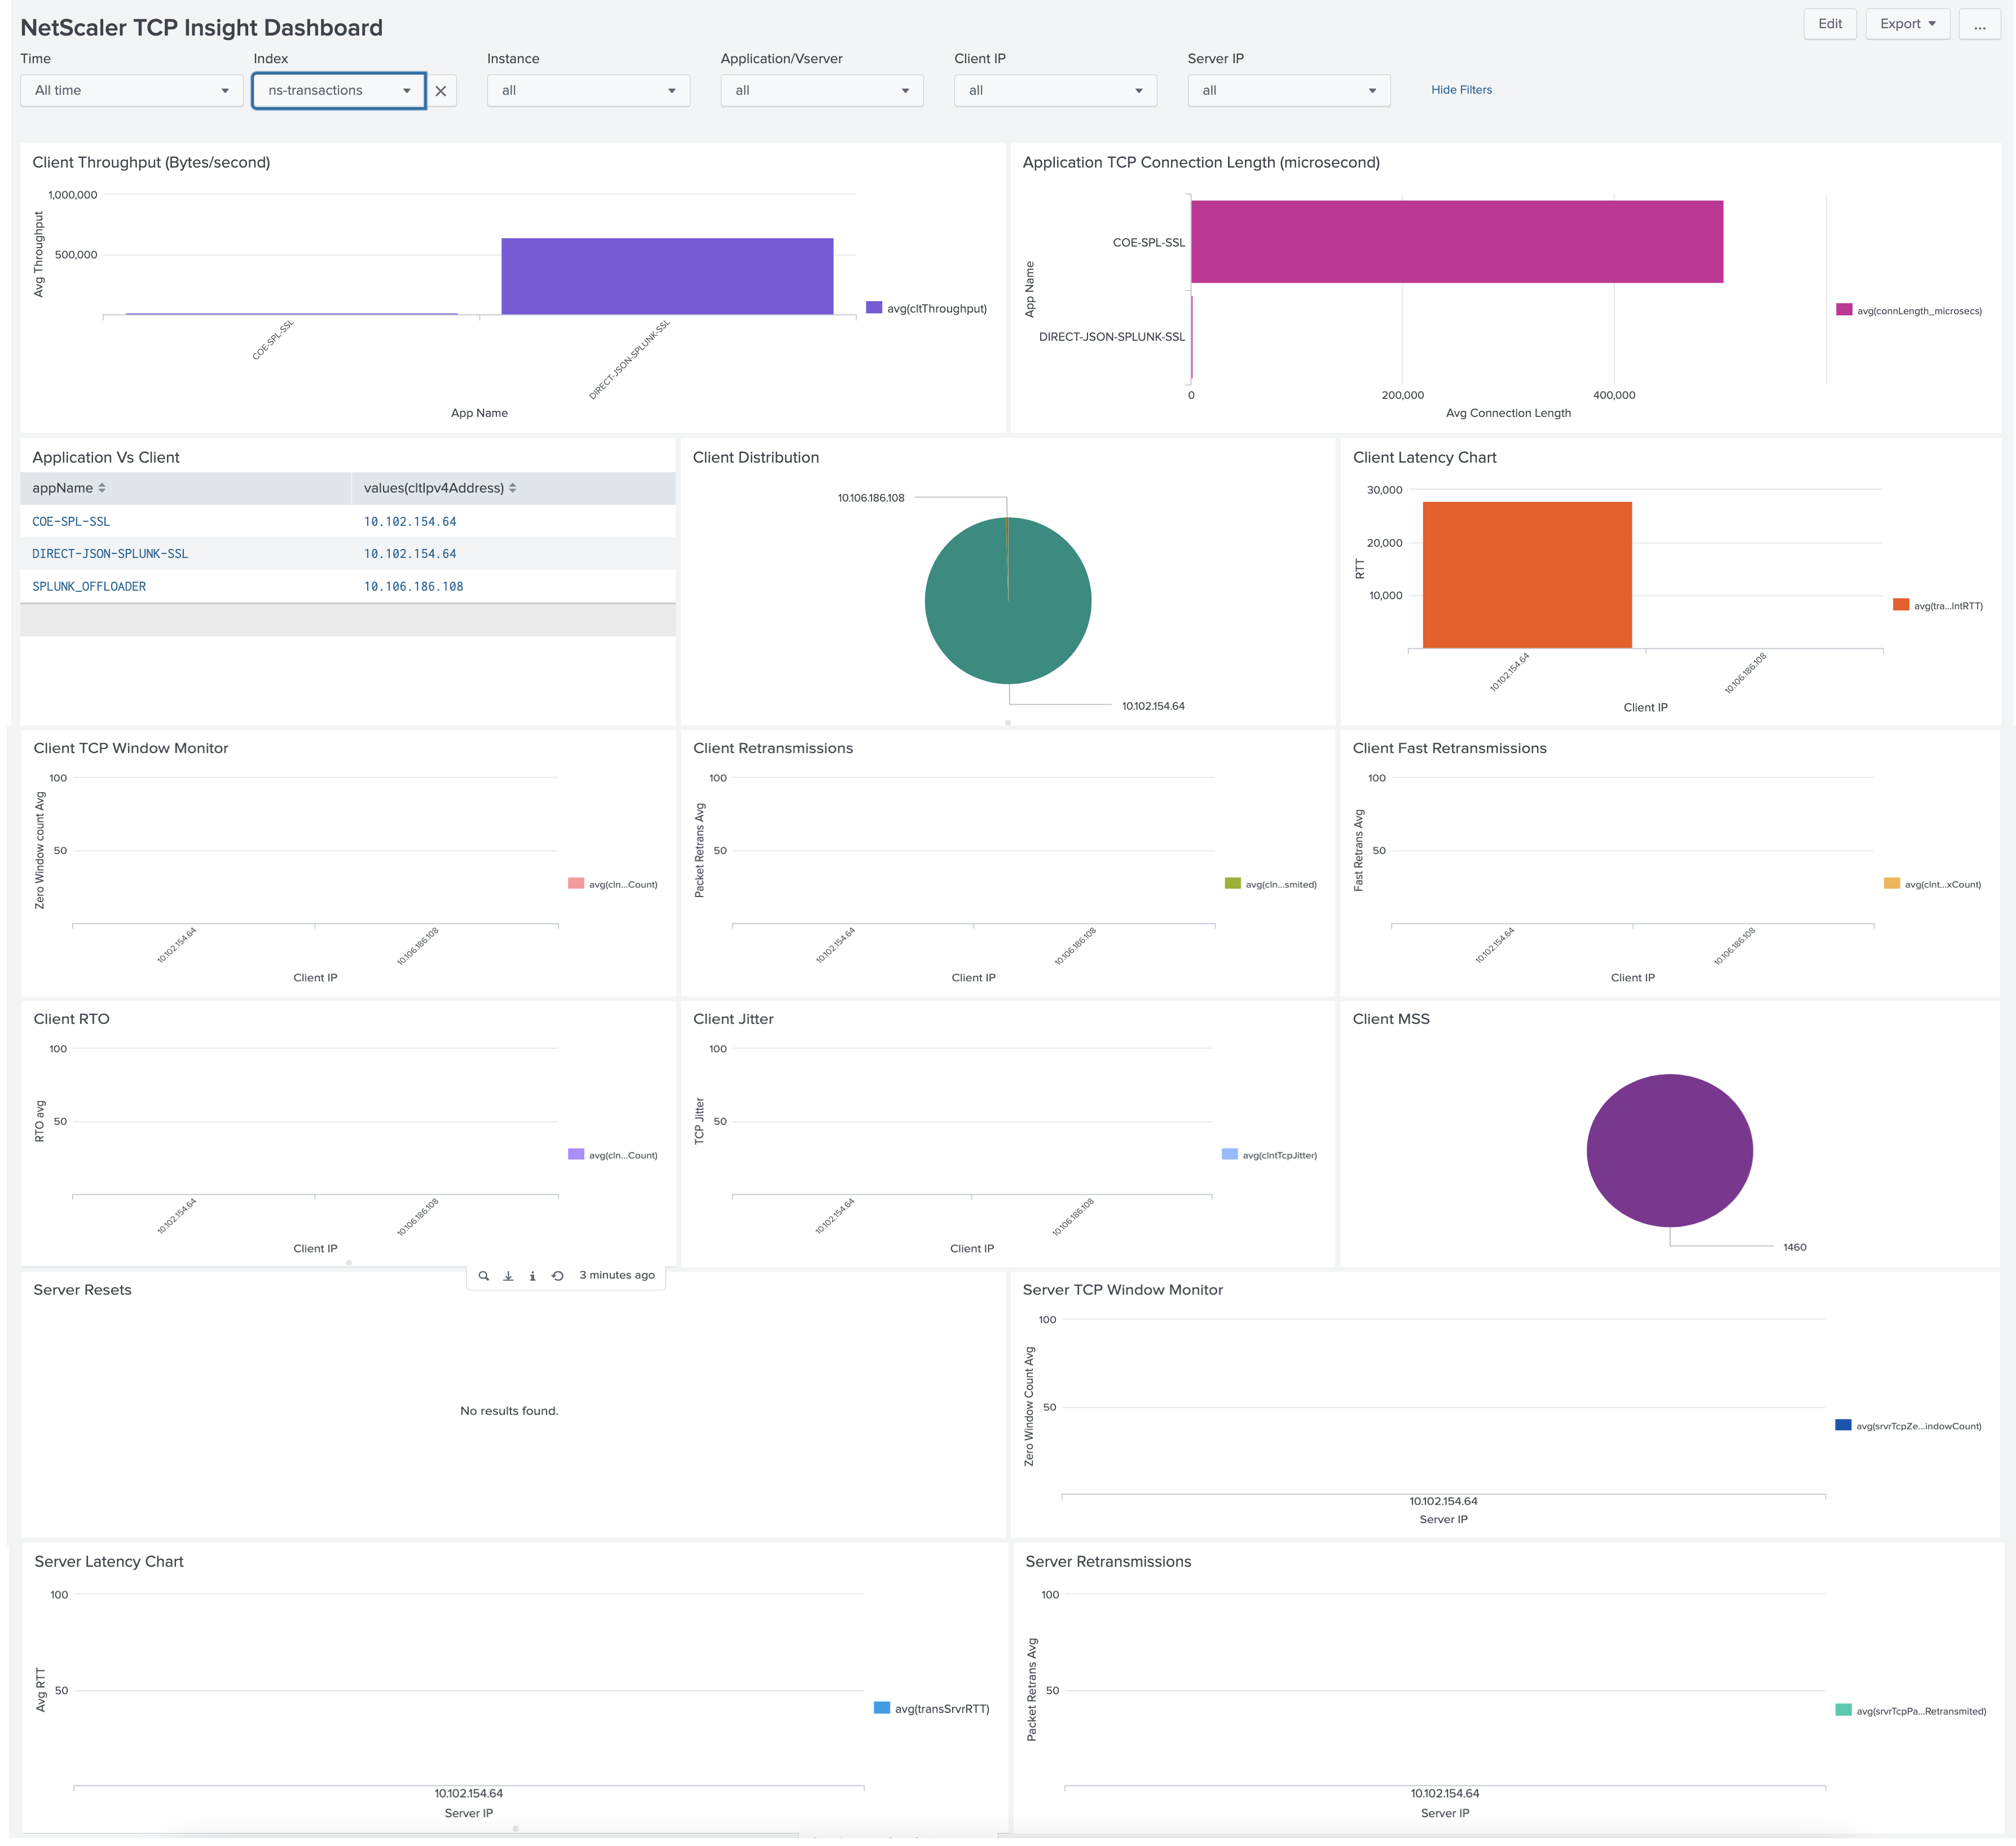
You can use the NetScaler TCP Insight Dashboard to monitor TCP traffic. This dashboard includes data such as Throughput, Connection Length, Latency, Jitter at Layer 4, and events such as Retransmissions, Resets, Zero Windows. As HTTP, HTTPS, SSL operate on TCP, you can correlate the data with the NetScaler HTTP Insight Dashboard and NetScaler SSL Insight Dashboard to get holistic insights about the traffic at Layer 4.
NetScaler Management Logs Dashboard (HEC)
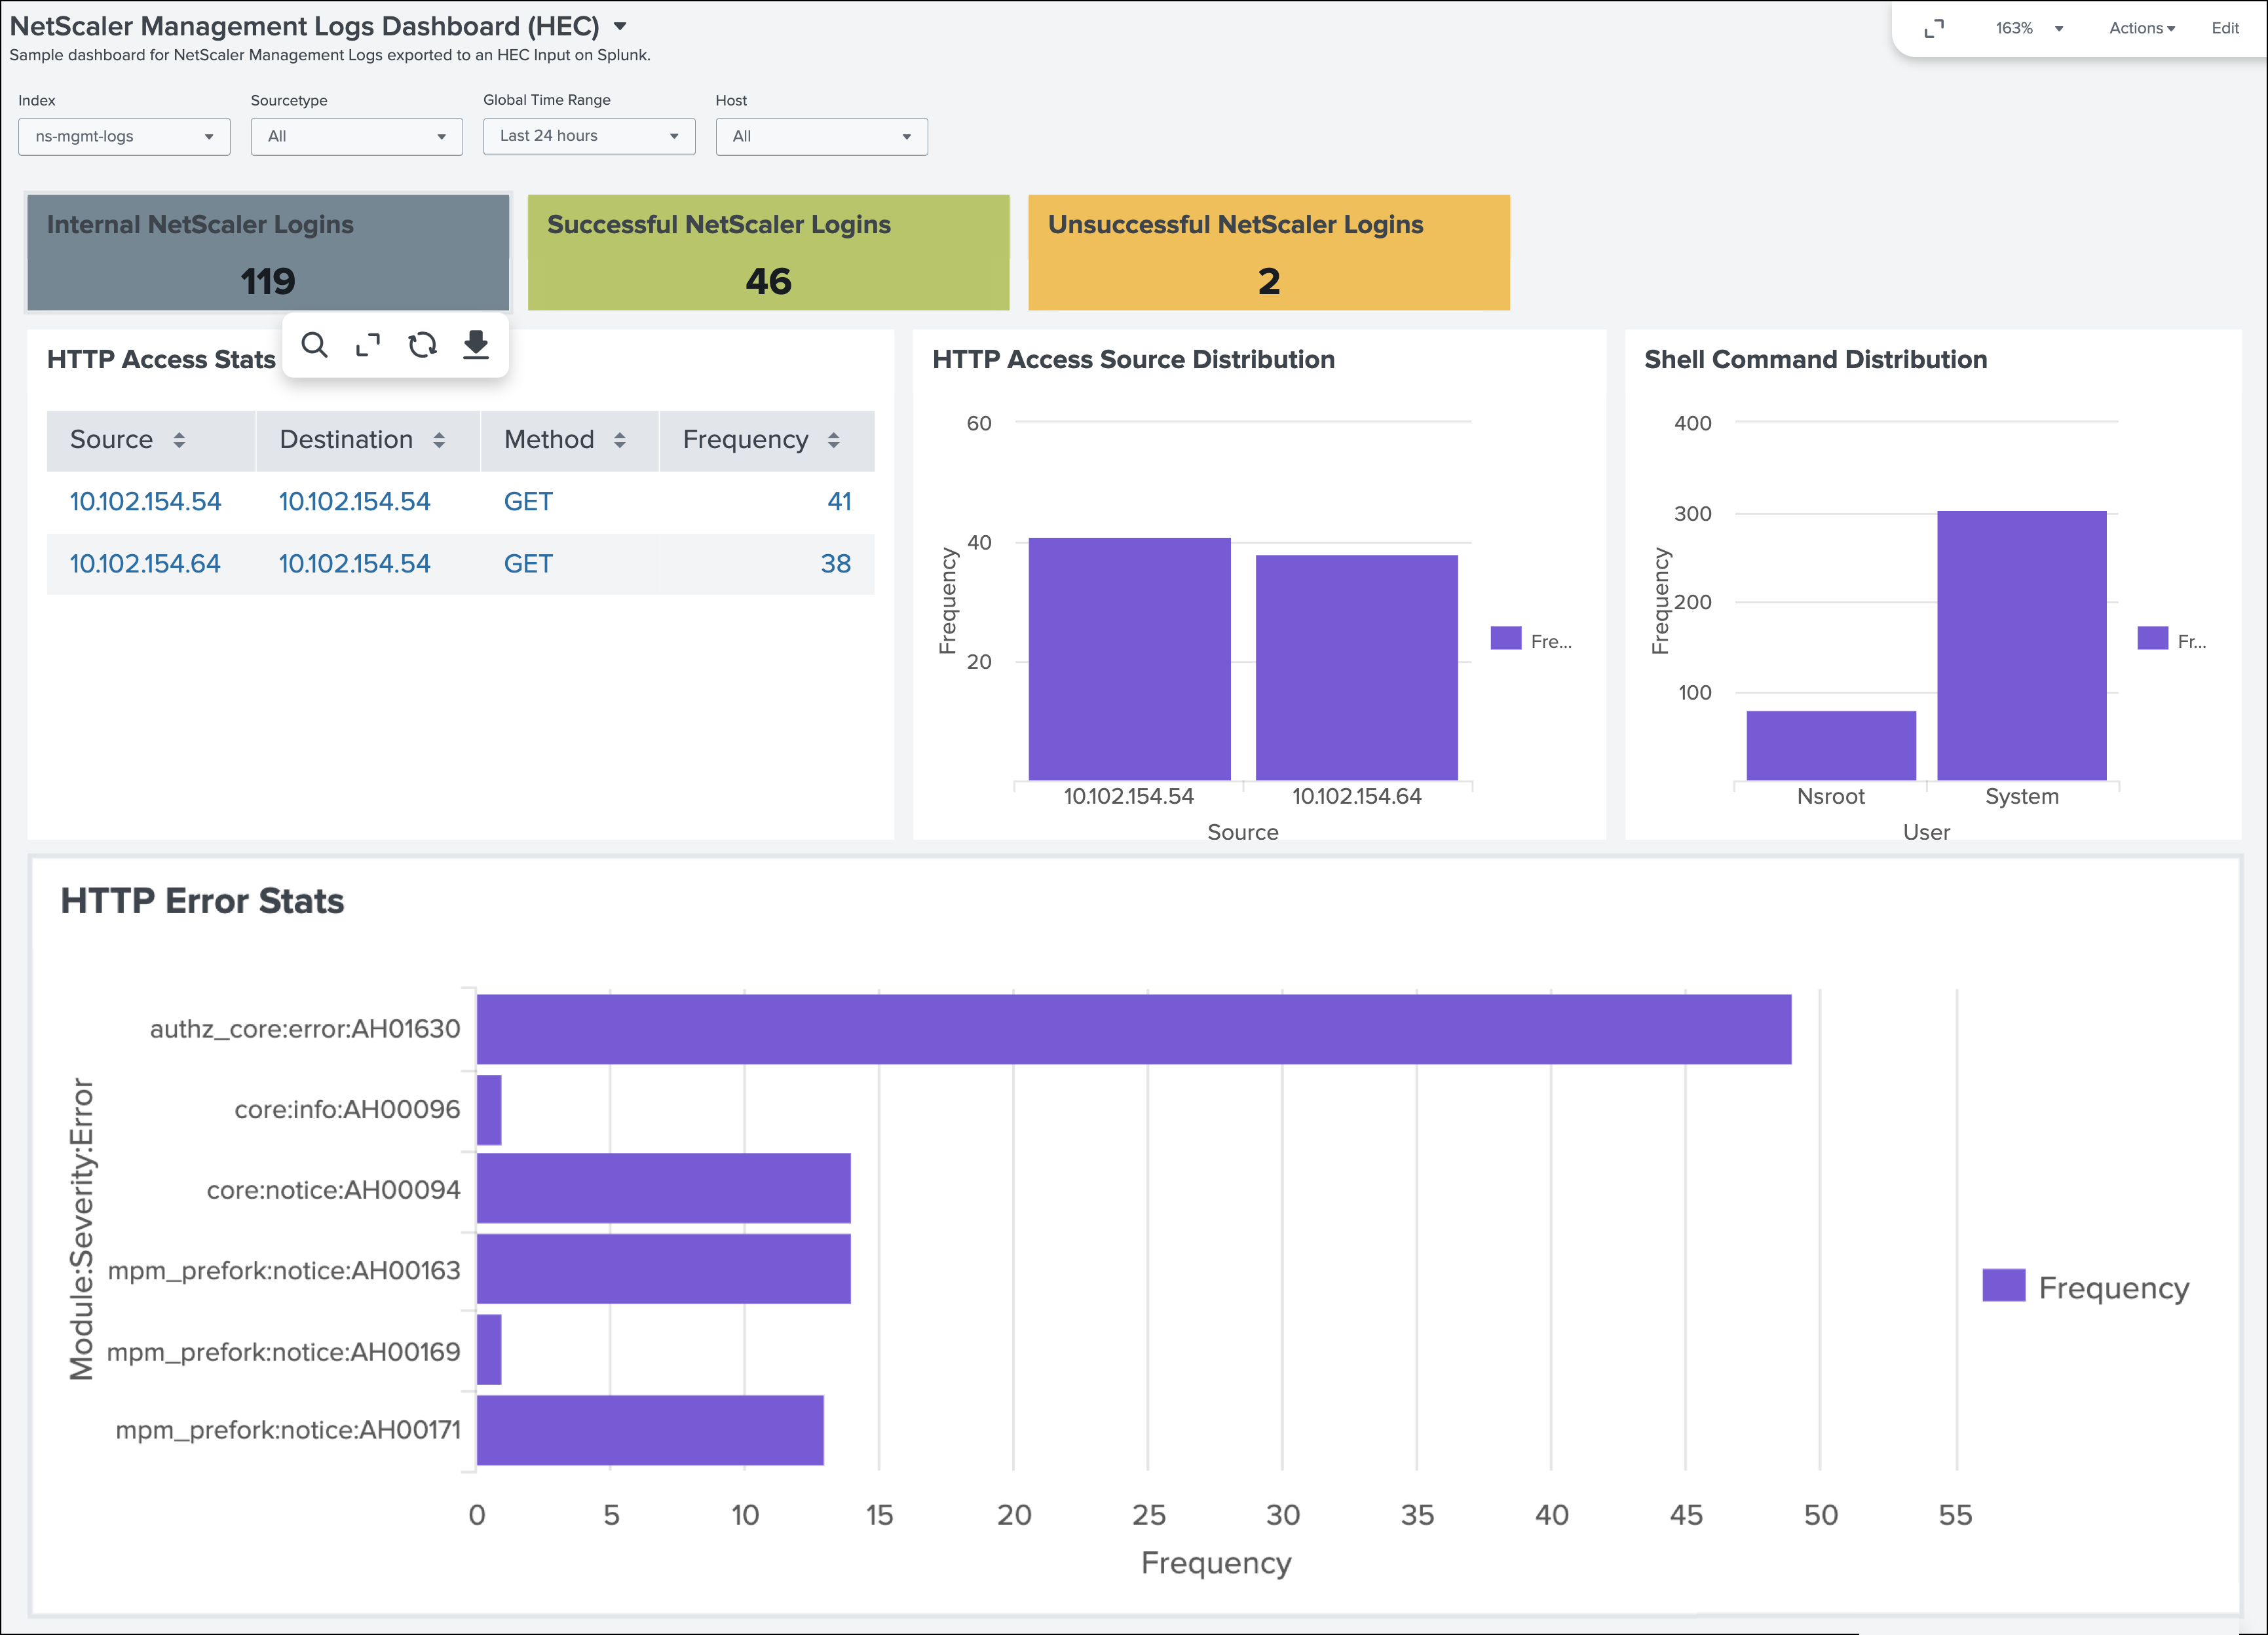
You can use the NetScaler Management Logs Dashboard (HEC) to view the management logs exported to an HTTP Event Collector (HEC) input on Splunk. This dashboard includes management events such as Logins, GUI Access, Shell access. You can also drill down to the finer details of these management events.
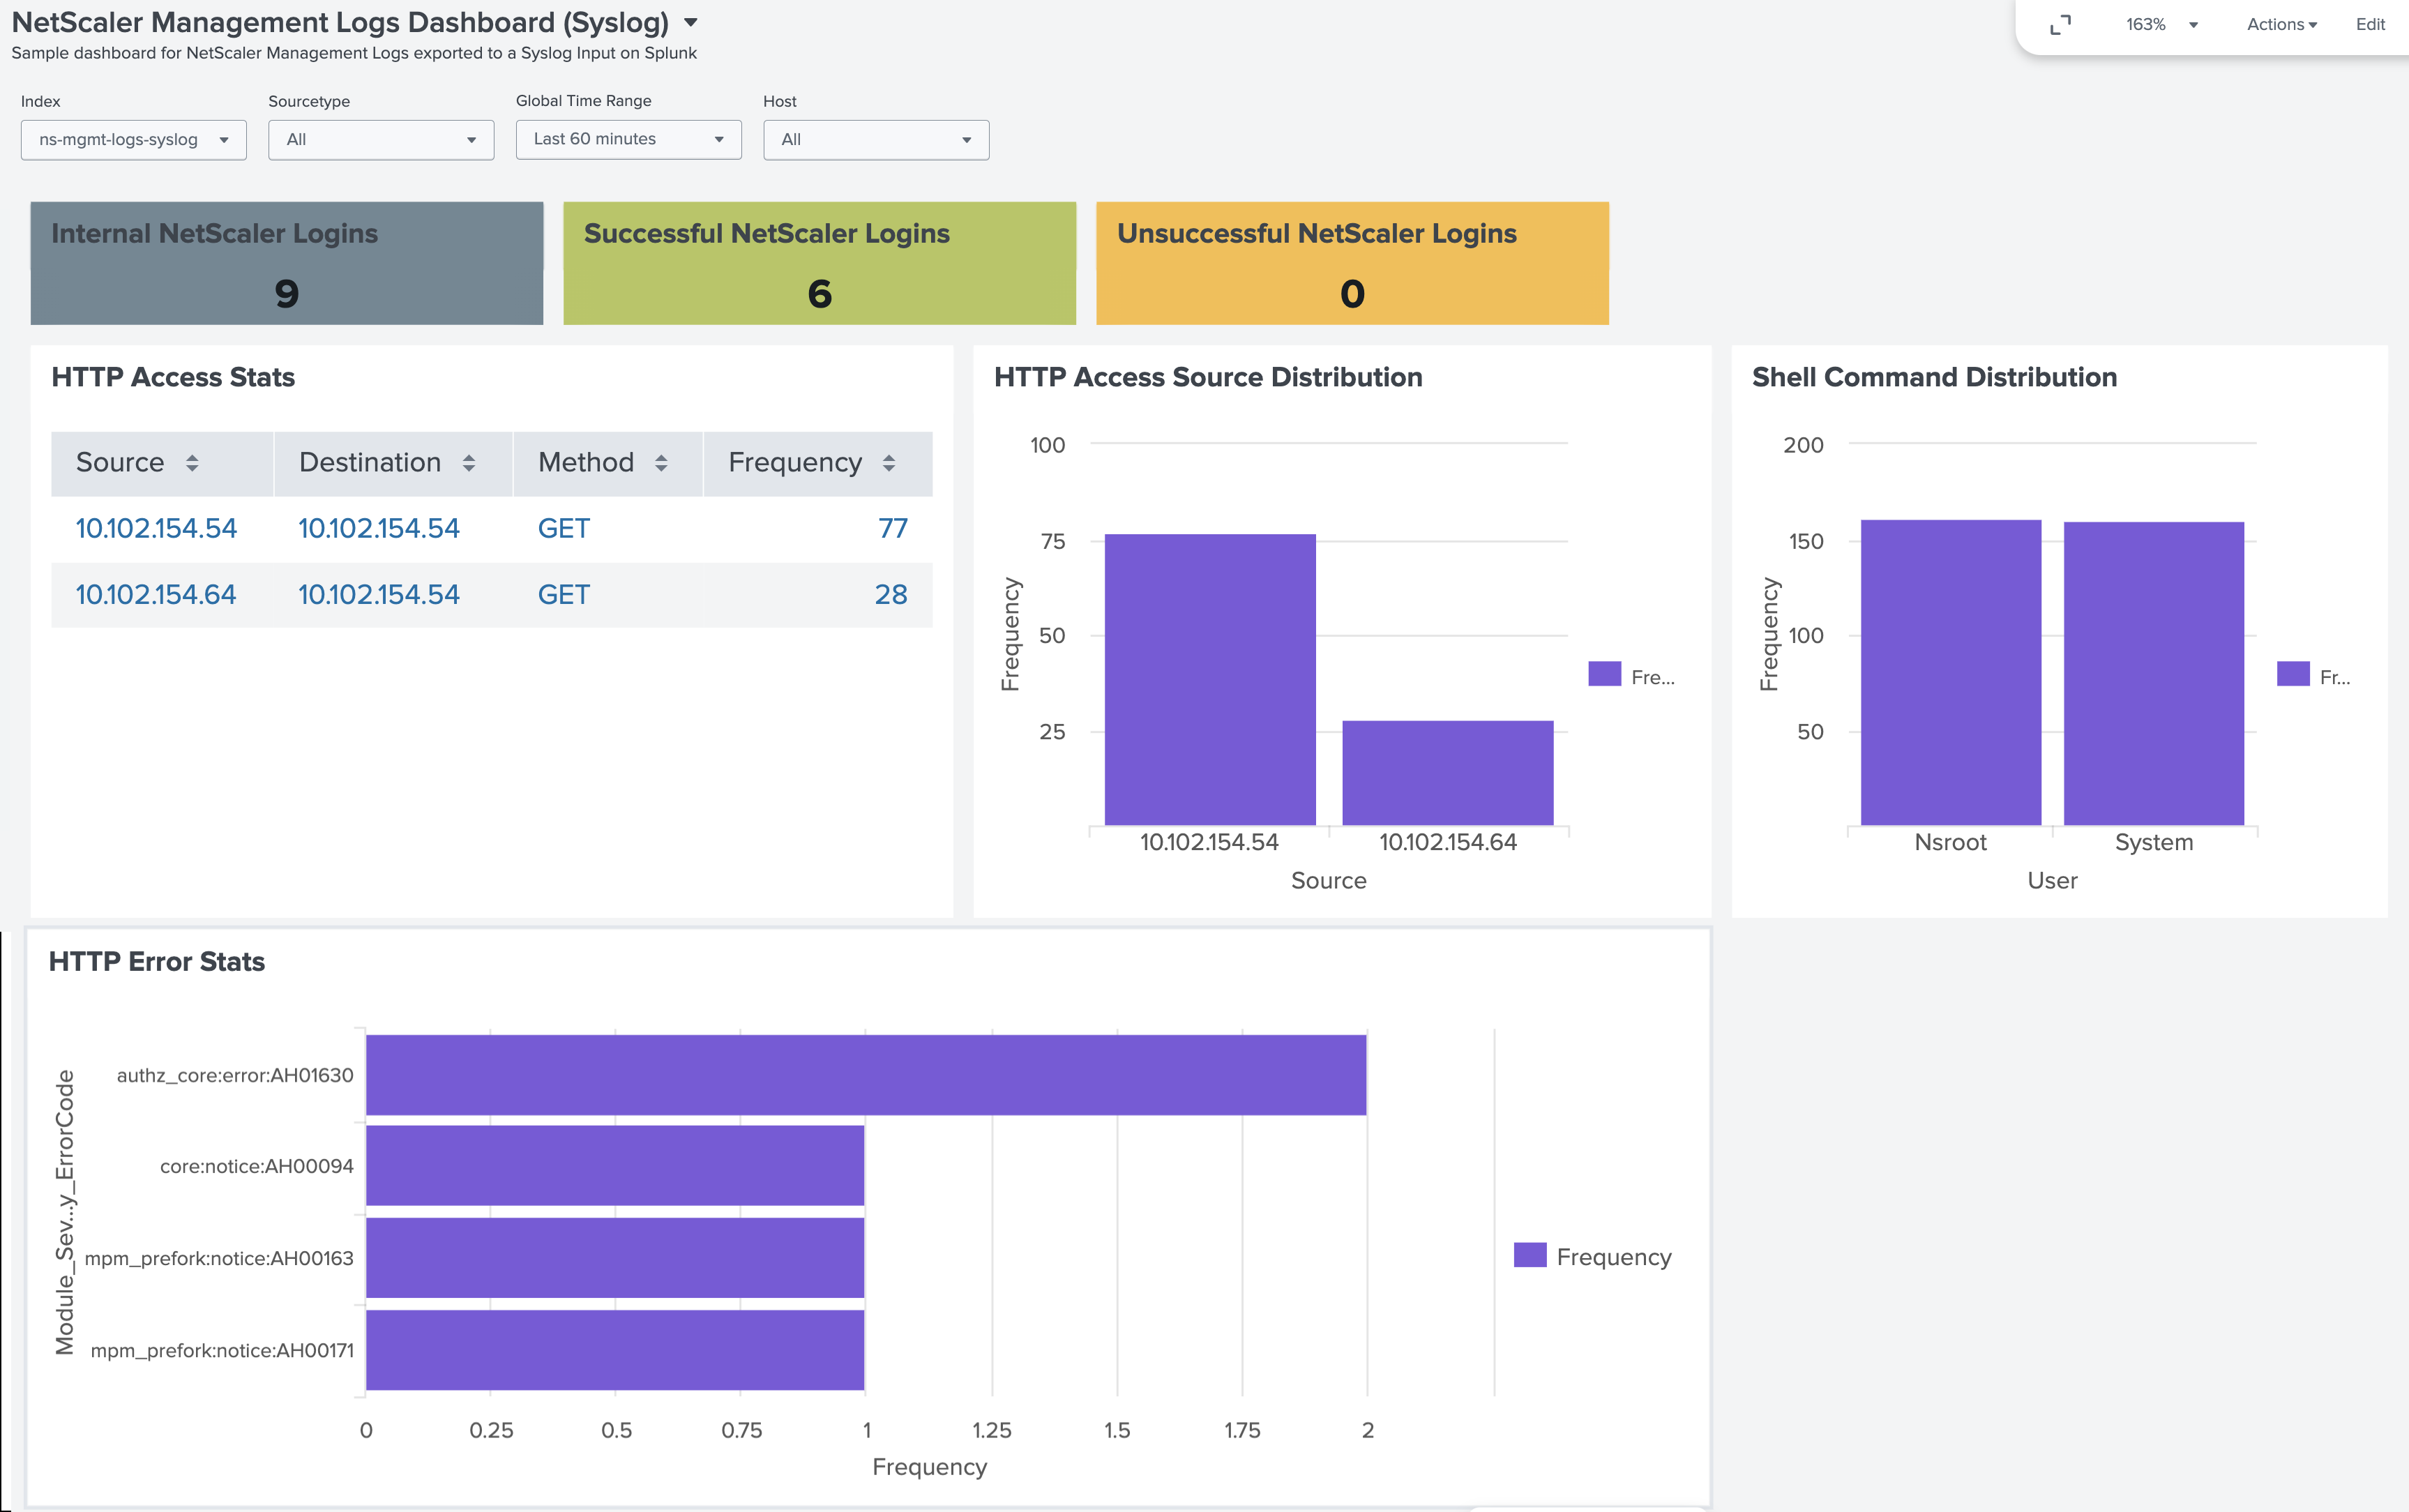
NetScaler Management Logs Dashboard (Syslog)
You can use the NetScaler Management Logs Dashboard (Syslog) to view the management logs exported to a Syslog Input on Splunk. This dashboard includes management events such as Logins, GUI Access, Shell access.