View statistics
You can view the collected statistics in tabular format in the command-line interface and in graphical format in the configuration utility.
The following table describes the collected statistics:
| Statistics | Column name in the output of the stat stream identifier <identifier name> command |
Description |
|---|---|---|
| Number of requests | Req | The number of requests for which records were created in the last <interval> number of minutes. |
| Bandwidth consumed | BandW | The total bandwidth consumed by the requests that were received in the last <interval> number of minutes. The total bandwidth of a request is the bandwidth consumed by the request and its response. The value is rounded off to the next higher or next lower integer value. So, it might differ slightly from the expected value. For example, if a request's total bandwidth consumption is 2.2 KB. One instance of the request might be shown as having consumed 2 KB. Two instances might be shown as having consumed 4 KB, but three instances might be shown as having consumed 7 KB. |
| Response time | RspTime | The average response time for all the requests received in the last <interval> number of minutes. |
| Concurrent connections | Conn | The total number of concurrent connections that are currently open. |
To view the statistical data collected for a stream identifier by using the command line
At the command prompt, type:
stat stream identifier <name> [<pattern> ...] [-detail] [-fullValues] [-ntimes <positive_integer>] [-logFile <input_filename>] [-sortBy <sortBy> [<sortOrder>]
Related information
Examples
Example 1 sorts the output on the BandW column, in the descending order. Example 2 sorts the output in Example 1, on the Req column, and in the ascending order
Example 1
> stat stream identifier myidentifier -sortBy BandW Descending -fullValues
 Stream Session statistics
                    Req                BandW
 User1              508               125924
 User2             5020                12692
 User3             2025                 4316

                RspTime                 Conn
 User1             5694                    0
 User2              109                    0
 User3                3                    0
  Done
Example 2
> stat stream identifier myidentifier -sortBy Req Ascending –fullValues
 Stream Session statistics
                    Req                BandW
 User1              508               125924
 User3             2025                 4316
 User2             5020                12692

                RspTime                 Conn
 User1             5694                    0
 User3                3                    0
 User2              109                    0
  Done
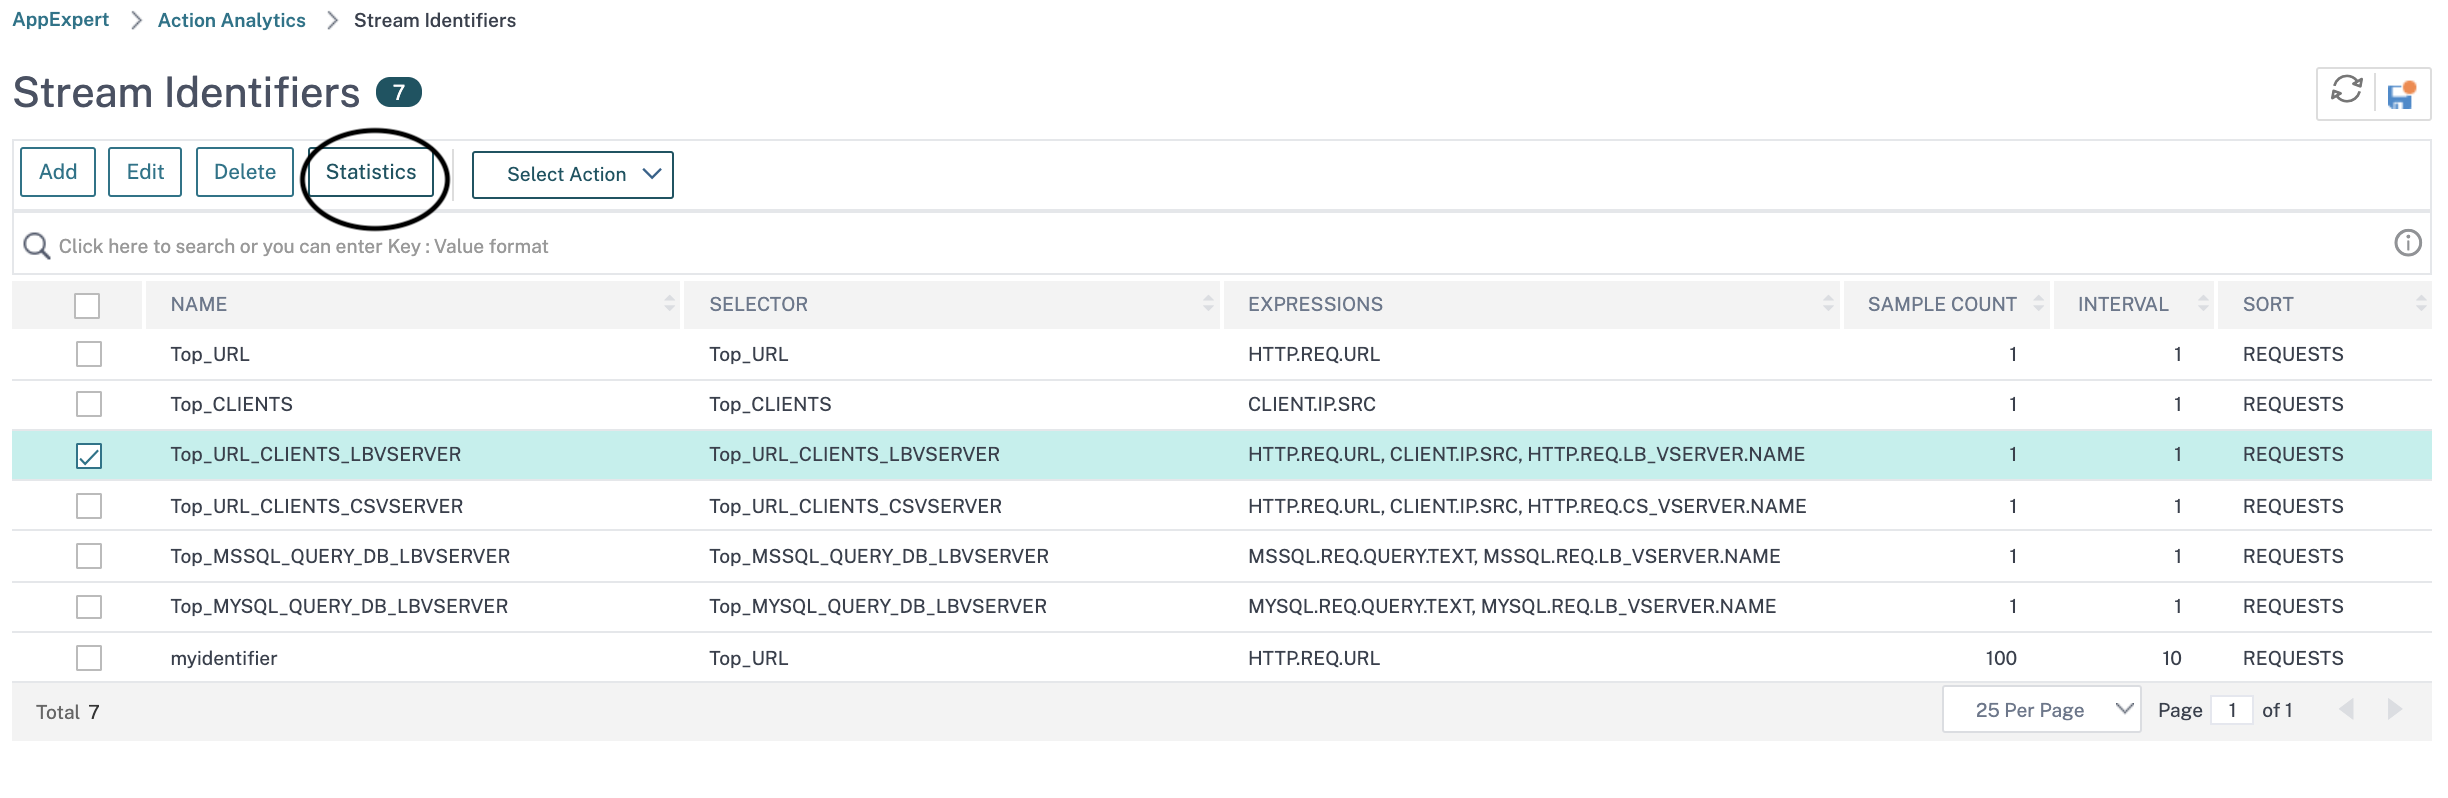
To view the statistical data collected for a stream identifier by using the GUI
-
Navigate to AppExpert > Action Analytics > Stream Identifiers.
-
Select the stream identifier whose sessions you want to view, and then click Statistics For information about how you can group the output based on the values collected for various selector expressions.