Sample dashboards on Grafana
NetScaler provides sample dashboards on Grafana.
Related information
View a sample dashboard on Grafana
To view a sample dashboard on Grafana, do the following:
Prerequisites: Ensure that you have completed the required configurations on NetScaler and Prometheus. For more information, see Configure the export of metrics from NetScaler to Prometheus and visualization using Grafana.
-
Launch Grafana and Prometheus.
-
Navigate to Dashboards and click New dashboard.
-
Click Import dashboard.
-
Provide a name for the dashboard.
-
Click Upload to select the JSON file corresponding to the required dashboard or copy the JSON file content and paste it into the Source page. For the list of dashboards supported and its corresponding JSON file name, see List of sample dashboards.
-
Select the data source as Prometheus.
-
Click Import.
-
Select the ADC, Vserver and other details to view the required metrics.
Observability Sample Dashboard for NetScaler® ADC
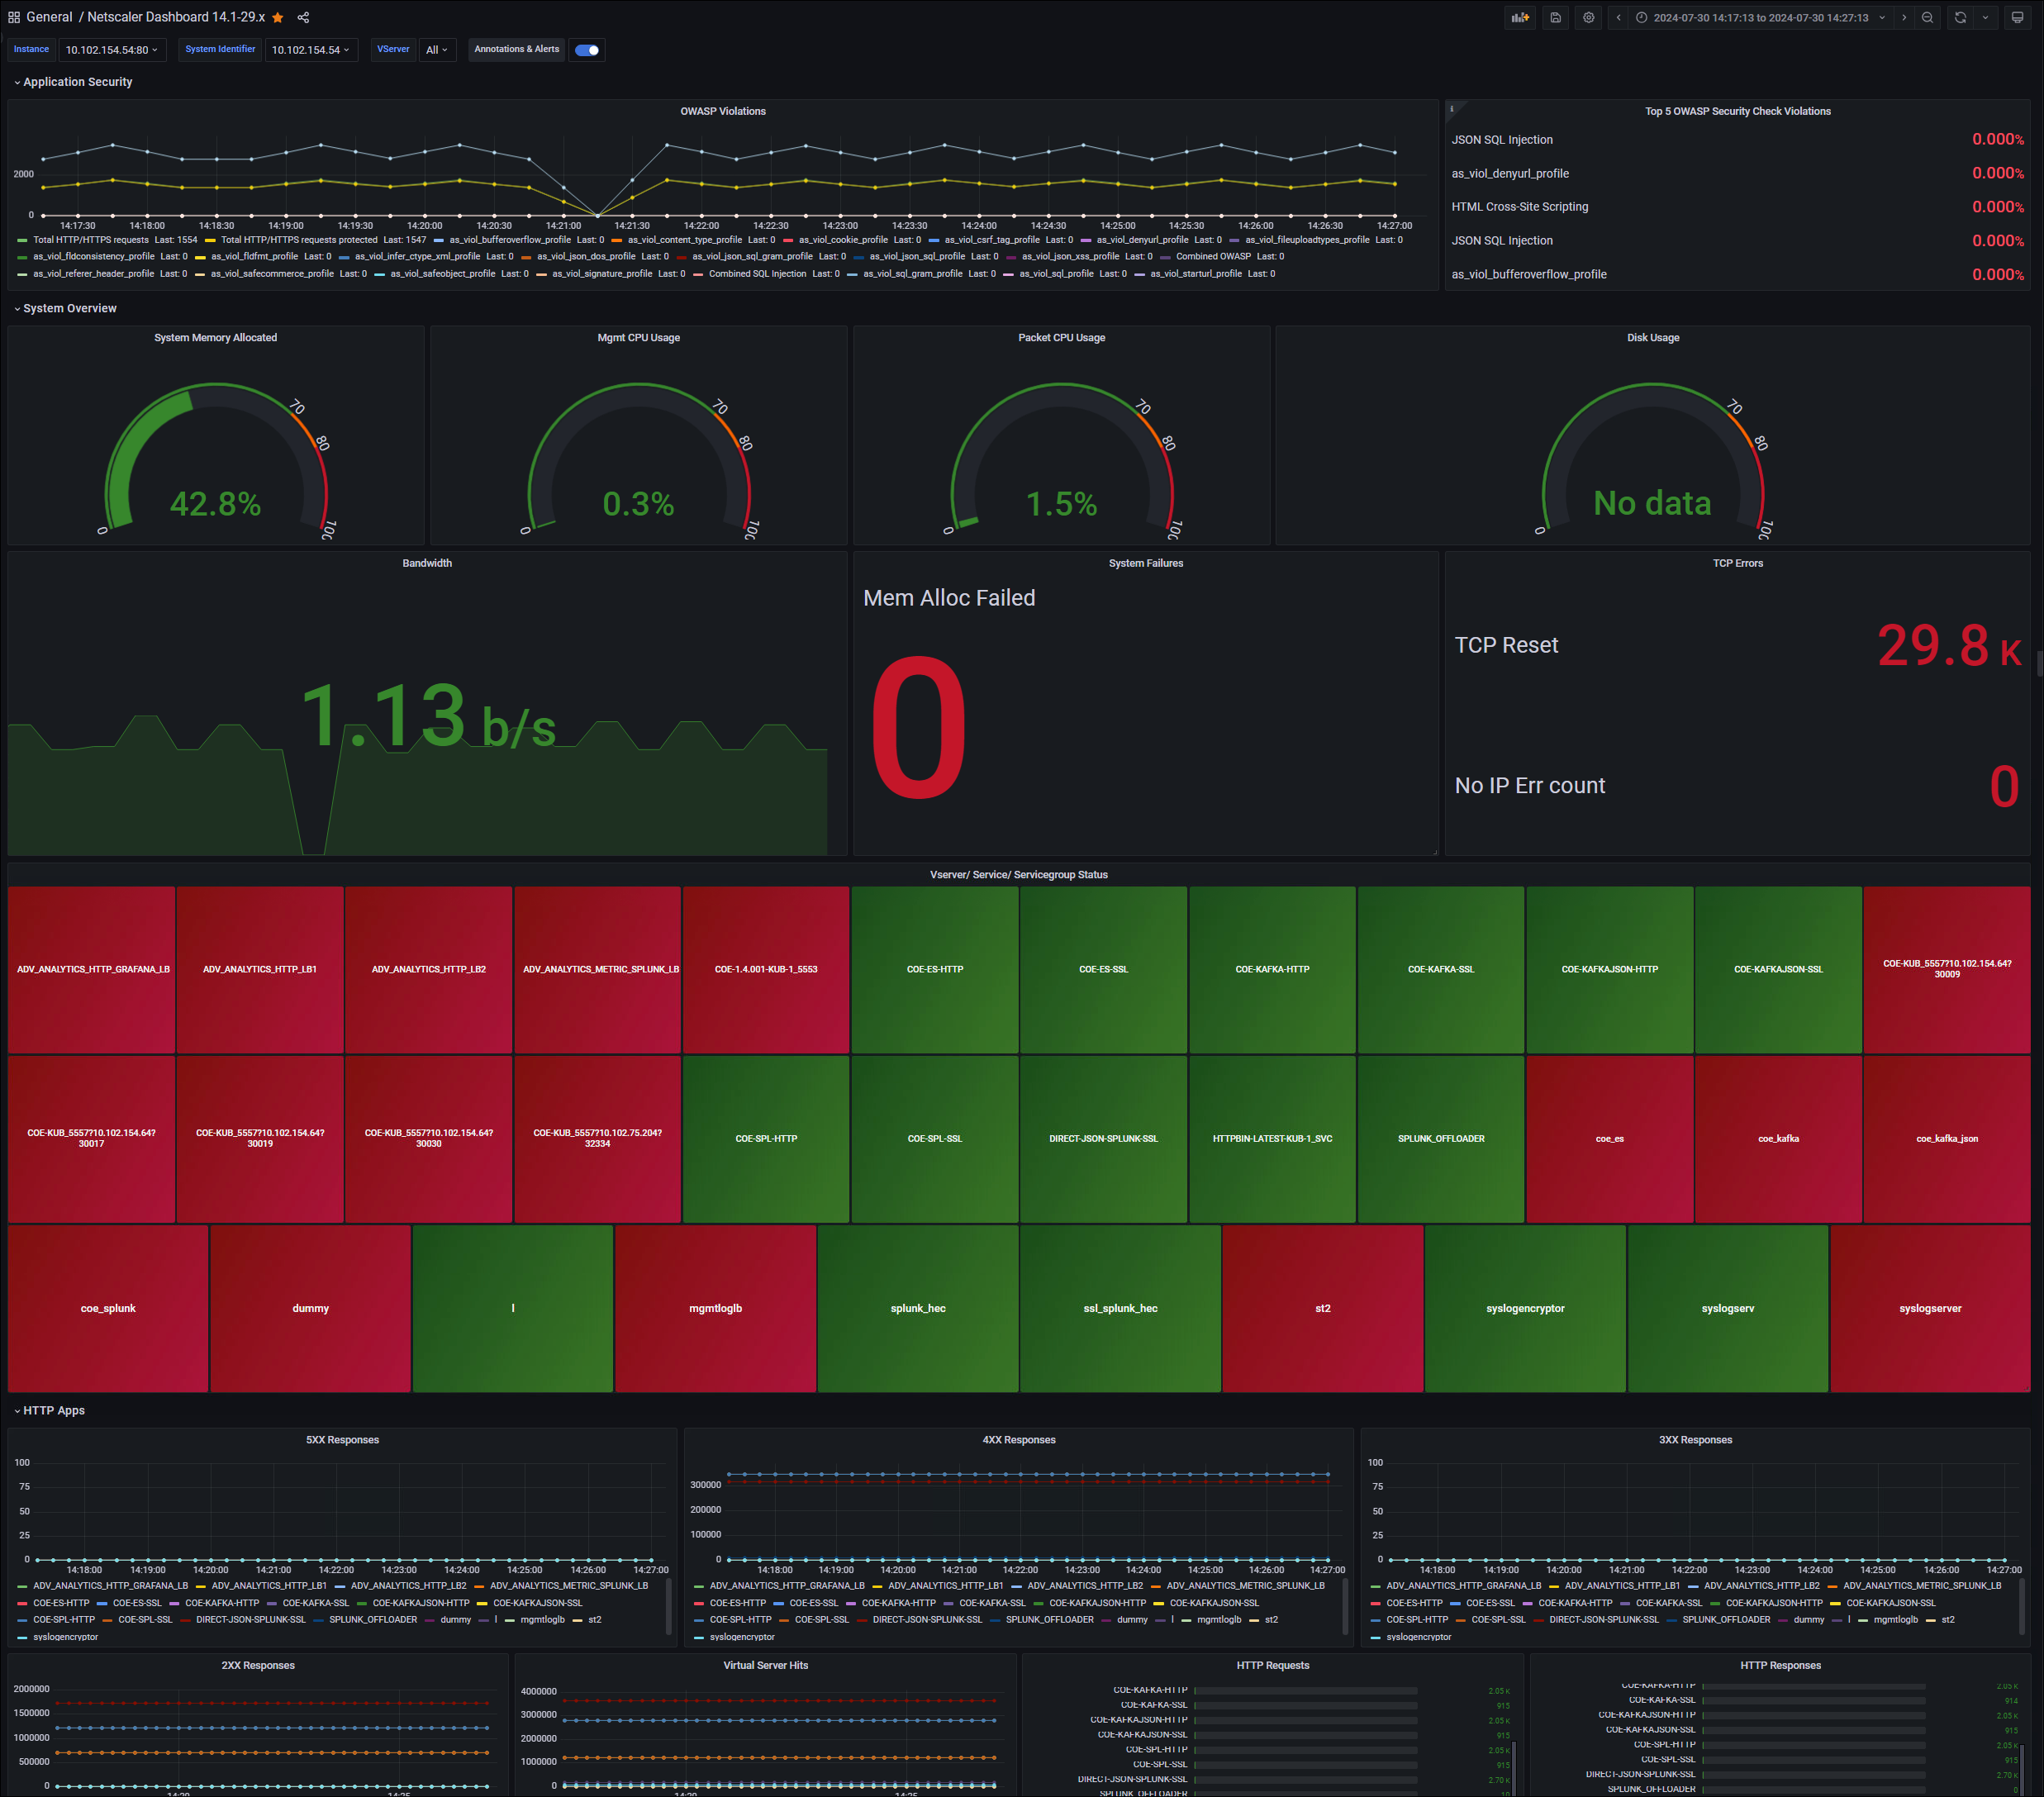
You can use the Observability Sample Dashboard for NetScaler ADC to view the overall health of NetScaler in your network. The dashboard provides various metrics of overall infrastructure at one place like NetScaler health, virtual server status, application health (HTTP and TCP apps), and application security (SSL apps).
You can expand the corresponding section in the dashboard to view the detailed visualization of each section such as HTTP Apps, SSL Apps, TCP Apps, virtual server stats (vStats), and NetScaler stats.
The following is a snippet of Observability Sample Dashboard for NetScaler ADC: