
Network violation details
Related information
HTTP Slow Loris
Slow Loris is a denial-of-service attack that can send HTTP headers to the target application as slow as possible. The target application is forced to wait for headers arrival and can also quickly become unavailable to handle requests if multiple similar connections get opened. When a NetScaler instance receives a high volume of HTTP requests, the HTTP header increases and takes a long time to complete the requests. This process can exhaust application server resources and result in HTTP Slow Loris attack.
Using the HTTP Slow Loris indicator, you can analyze the requests that are resulted in Slow Loris attack.
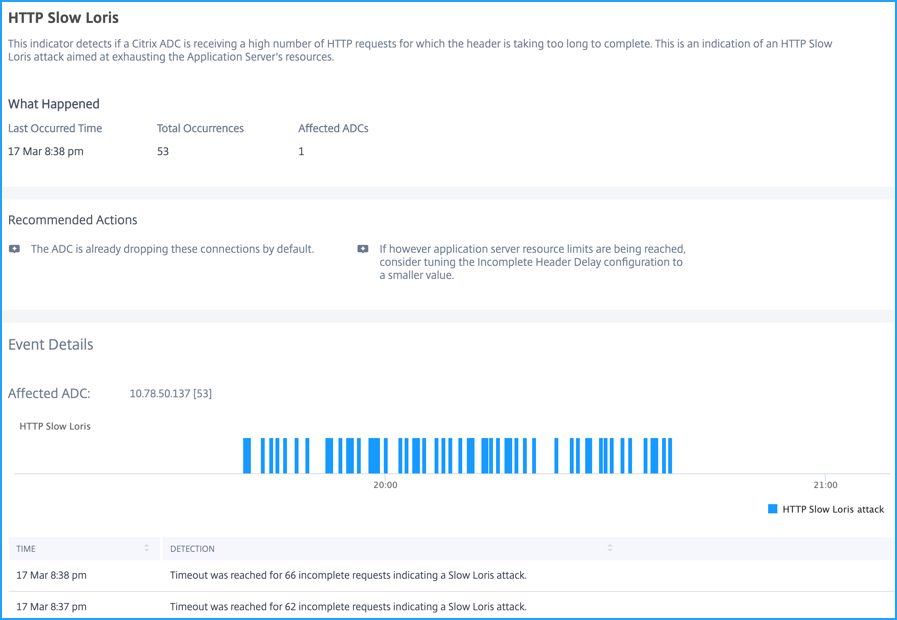
The Recommended Actions to troubleshoot the issue:
-
Consider tuning the incomplete Header Delay (incompHdrDelay) configuration to a smaller value.
-
By default, the NetScaler instance drops these incomplete requests.
Under Event Details, you can view:
-
The affected application. You can also select the application from the list if two or more applications are affected with violations.
-
The graph indicating all violations
-
The violation occurrence time
-
The detection message indicating the total incomplete requests as Slow Loris attack
DNS Slow Loris
The DNS Slow Loris indicator detects when a NetScaler receives a high number of DNS request spanning more than one packet. This process can exhaust DNS server resources and result in DNS Slow Loris attack. By default, NetScaler instance drops these DNS Slow Loris requests and no further action is required to troubleshoot this issue.
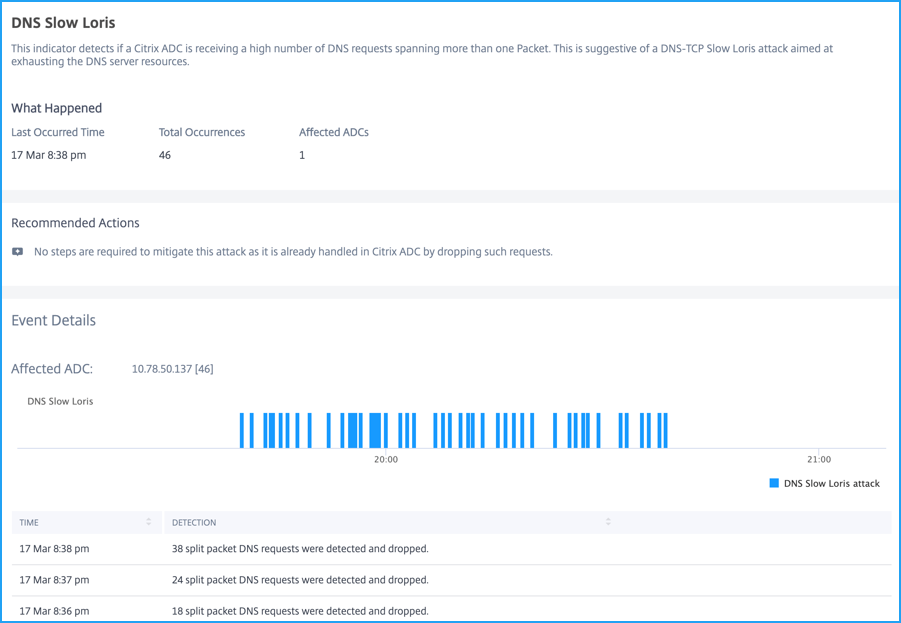
Under Event Details, you can view:
-
The affected application. You can also select the application from the list if two or more applications are affected with violations.
-
The graph indicating all violations
-
The violation occurrence time
-
The detection message indicating the total DNS requests as Slow Loris attack
HTTP Slow Post
The Slow Post is a Denial-of-Service attack that can send HTTP POST headers to a target application. In the headers, the body message sizes are specified correct, but the message body is sent at a low speed. The target application is forced to wait and can also quickly become unavailable to handle requests if multiple similar connections get opened.
This process can exhaust application server resources and result in HTTP Slow Post attack.
Using the HTTP Slow Post indicator, you can analyze the requests that are resulted in slow post attack.
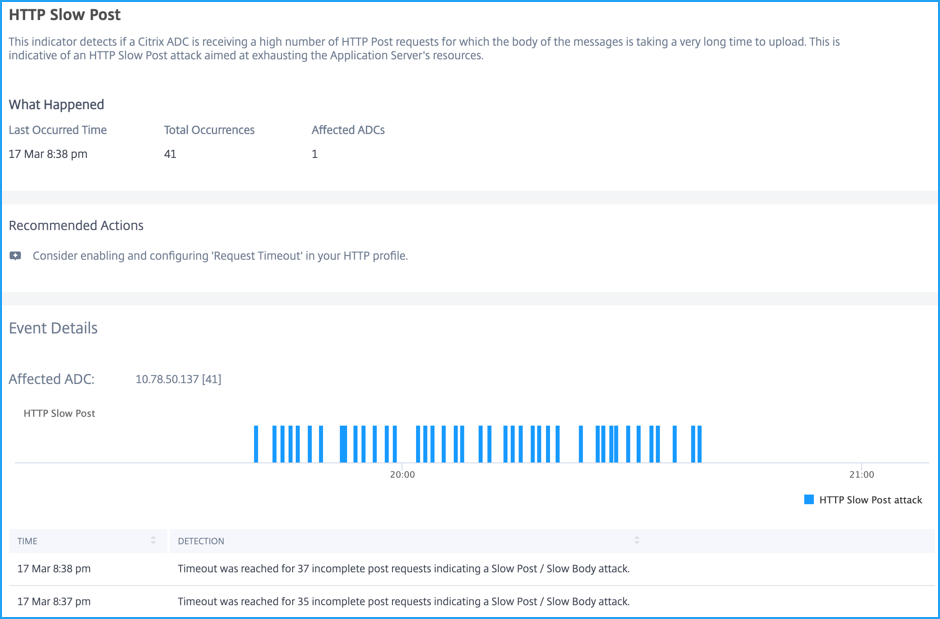
The Recommended Action to troubleshoot this issue to enable and configure Request Timeout in NetScaler HTTP profile. For more information, see HTTP Configurations.
Under Event Details, you can view:
-
The affected application. You can also select the application from the list if two or more applications are affected with violations.
-
The graph indicating all violations
-
The violation occurrence time
-
The detection message indicating the total POST requests as Slow Loris attack
NXDOMAIN Flood Attack
NXDOMAIN Flood Attack is a distributed denial-of-service (DDoS) attack that can target a DNS server or a NetScaler instance (that is configured as a DNS proxy server) and send a high volume of non-existence or invalid requests. This attack can impact the DNS server or NetScaler instance resulting in slowdown or requests not getting a response.
Using the NXDOMAIN Flood Attack indicator, you can analyze the requests that are resulted in NXDOMAIN attack.
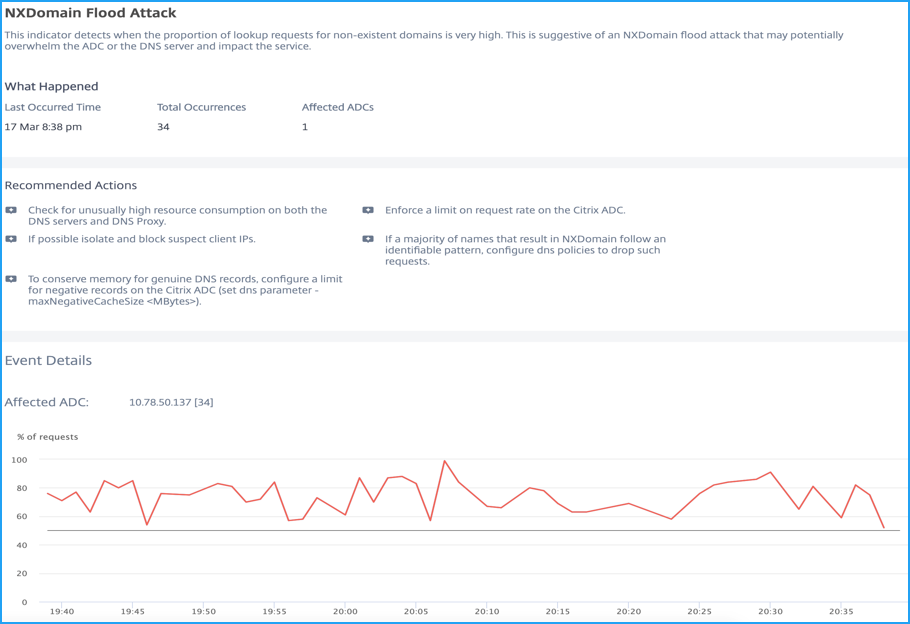
The Recommended Actions to troubleshoot the issue:
-
Check for unusually high resource consumption on both DNS server and DNS proxy server.
-
Enforce a limit for request rate on NetScaler instance
-
Isolate and block suspect client IP addresses
-
If most names result in NXDOMAIN, follow an identifiable pattern and configure DNS policies to drop such requests
-
To conserve memory for genuine DNS records, configure a limit for negative records on NetScaler instance. For more information, see Mitigate DNS DDoS attacks.
Under Event Details, you can view:
-
The affected application. You can also select the application from the list if two or more applications are affected with violations.
-
The graph indicating all violations
HTTP Desync Attack
In an HTTP desync attack, a single HTTP request is interpreted as:
-
A single request to the front-end server (virtual server)
-
2 requests to the back-end server
In this scenario, the back-end server interprets the second request is from a different client. The connection between the virtual server and back-end server is reused for different requests. If the first client request is processed from a malicious client with some malicious data, the next client request can have a customized request. This activity can cause an attack by misusing the combination of two headers; content length and transfer encoding.
Using the HTTP Desync Attack indicator, you can analyze if the NetScaler instance might be under HTTP desync attack that has occurred due to the presence of:
-
Content length and transfer encoding headers in a single HTTP transaction
-
Multiple content-length headers with different values in a single HTTP transaction
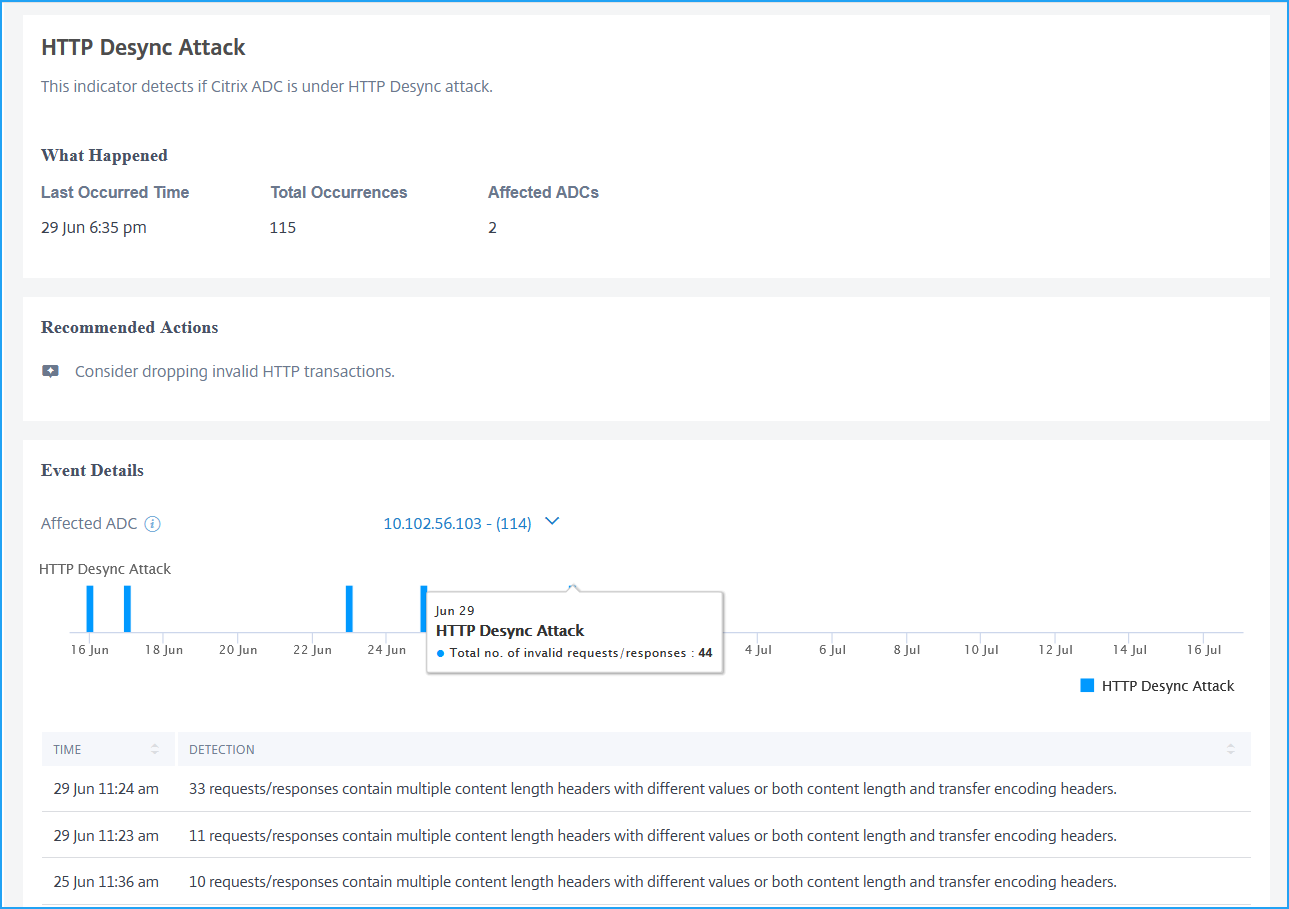
The Recommended Action suggests you to consider dropping invalid HTTP transactions.
Under Event Details, you can view:
-
The affected application. You can also select the application from the list if two or more applications are affected with this violation.
-
The graph indicating the violation details. Hover the mouse pointer on the bar graph to view the total invalid requests/reponses.
-
The detection message for the violation, indicating the total requests/responses:
-
Containing multiple content-length headers with different values
-
Containing both content length and transfer encoding headers
-
Bleichenbacher Attack
NetScaler instance detects if a given sequence of bytes of an encrypted message has the correct padding format upon decryption.
Using the Bleichenbacher Attack indicator, you can analyze if the NetScaler instance receives any SSL/TLS handshake connections with erroneous encrypted data.
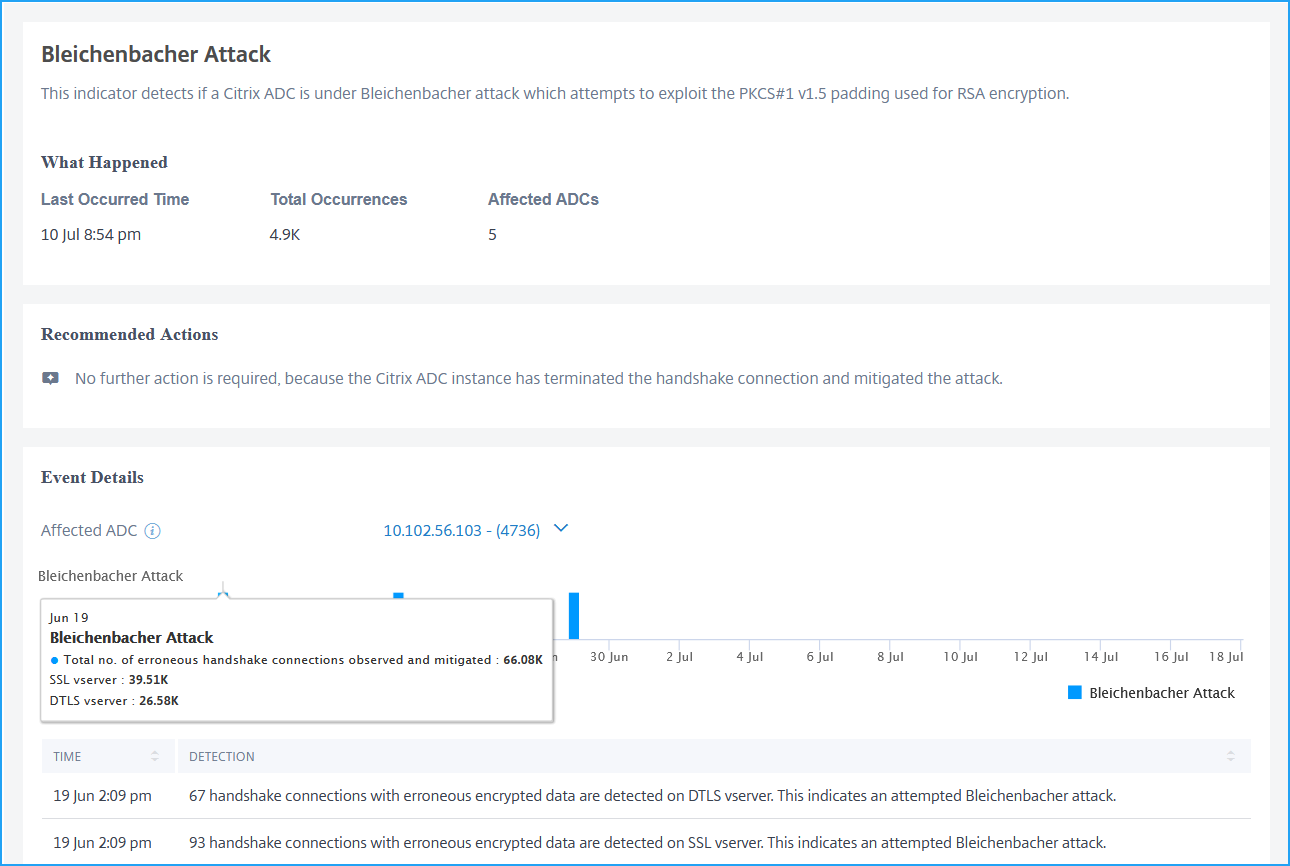
The Recommended Action indicates no further action is required because the NetScaler instance terminates the handshake connections and mitigates this attack.
Under Event Details, you can view:
-
The affected application. You can also select the application from the list if two or more applications are affected with this violation.
-
The graph indicating the violation details. Hover the mouse point on the bar graph to view the total erroneous handshake connections detected.
-
The detection message for the violation, indicating the total handshake connections on the virtual server with erroneous encrypted data.
Segment Smack Attack
A Segment Smack Attack is a Denial of Service (DoS) attack, in which the attacker can send unordered small-sized packets during a TCP session. These customized TCP packets can affect the CPU and Memory, and result in a denial of service on the NetScaler instance.
Using the Segment Smack Attack indicator, you can analyze if a NetScaler instance has received a large number of TCP packets than the configured queue limit. For more information, see TCP configuration.
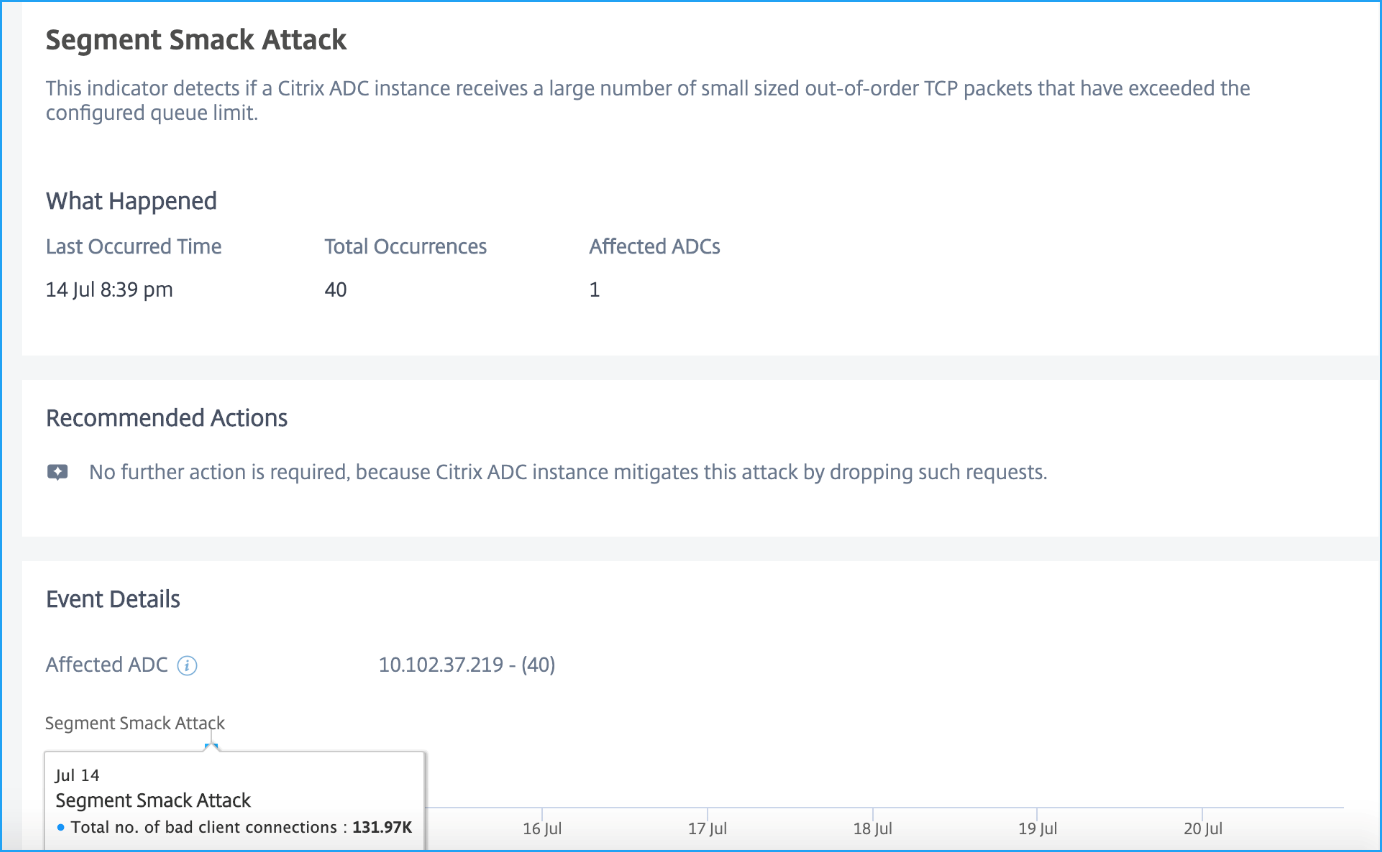
As an administrator, no further action is required because the NetScaler instance mitigates this attack by dropping all those excess TCP packets.
Under Event Details, you can view:
-
The affected NetScaler instance
-
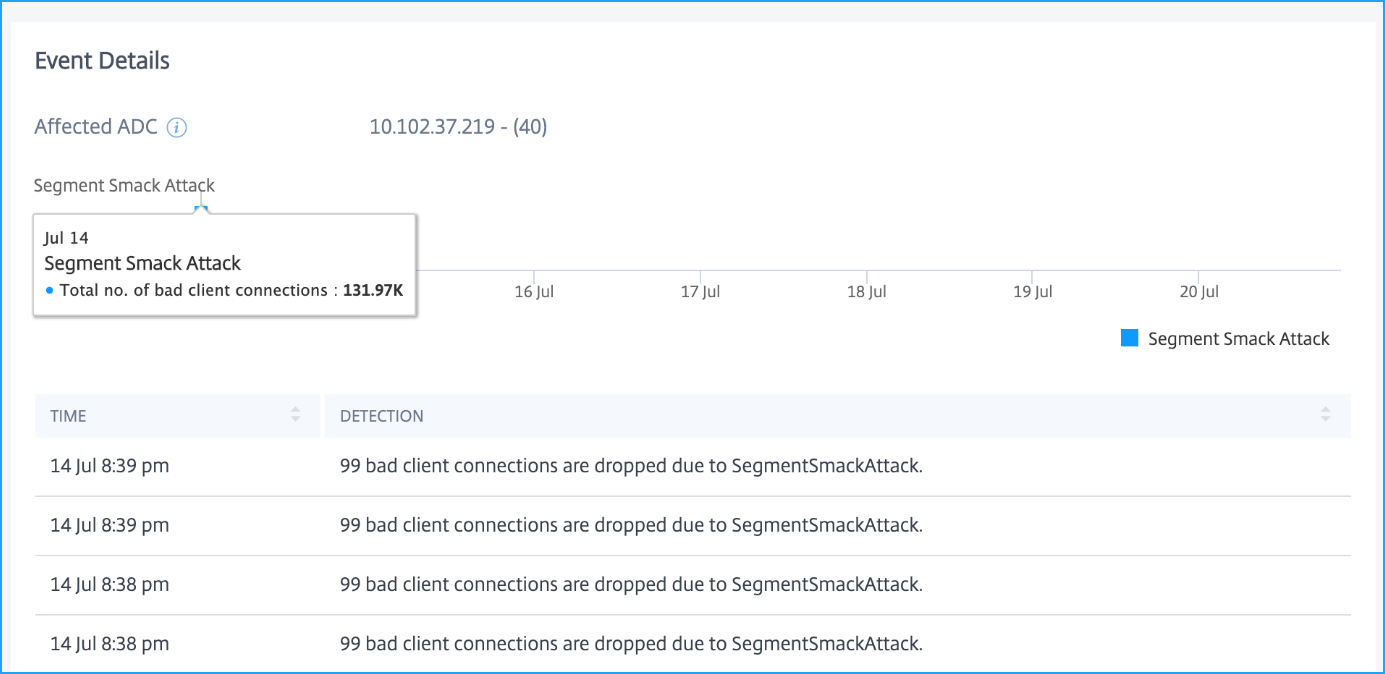
The graph indicating the violation details. Hover the mouse point on the bar graph to view the total number of bad client connections detected.
-
The detection message for the violation, indicating the total client connections dropped.
SYN Flood Attack
A SYN Flood Attack is a Denial of Service (DoS) attack that can affect the target machine, by sending thousands of connection requests using spoofed IP addresses. When a NetScaler instance is under a SYN Flood attack, the instance attempts to open a connection for each malicious request and then wait for an acknowledgment packet that never arrives.
The SYNCOOKIE in the TCP profile prevents SYN attacks on the NetScaler appliance. By default, the SYNCOOKIE on the NetScaler instance is enabled. The possibility for the NetScaler instance under a SYN flood attack is high only when SYNCOOKIE is disabled.
Using the SYN Flood Attack indicator, you can analyze if the NetScaler instance is under SYN attack.
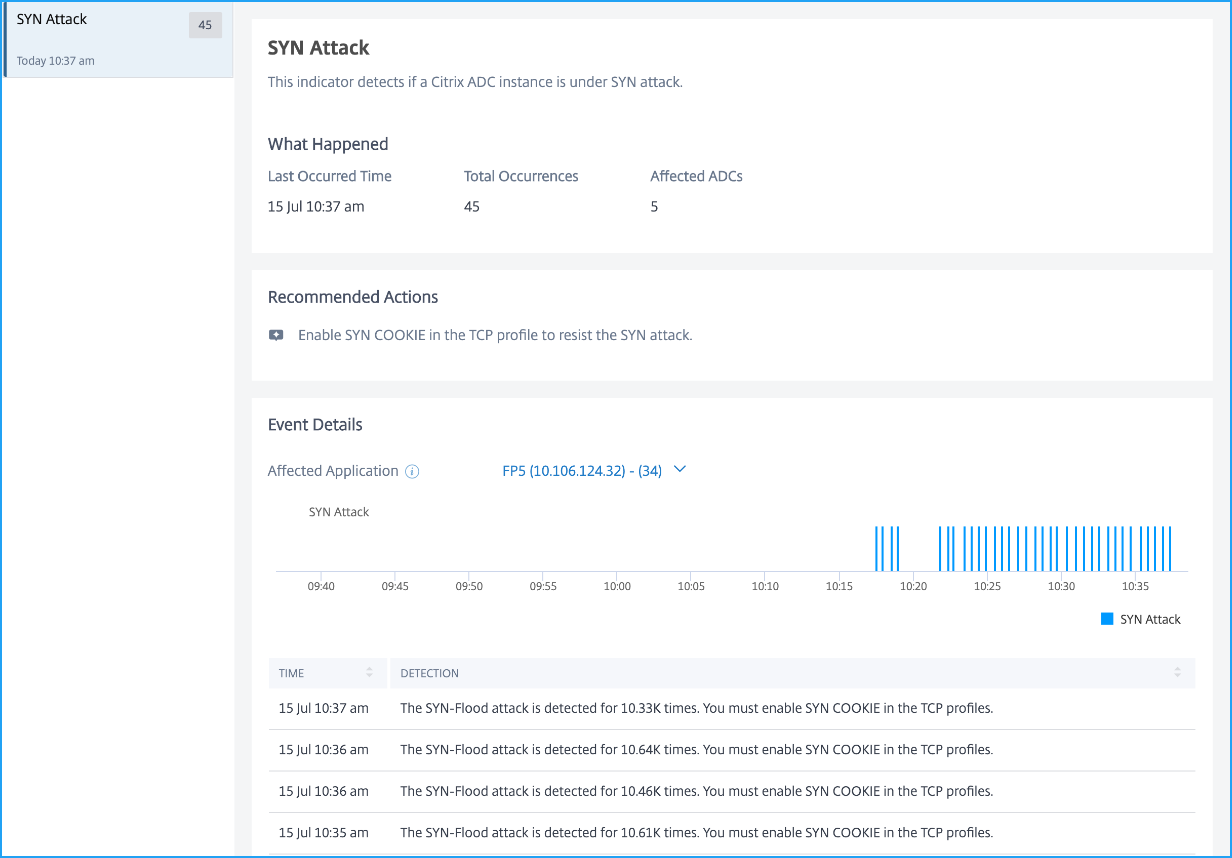
As an administrator, the Recommended Action suggests you to enable SYN COOKIE in the TCP profile.
Under Event Details, you can view:
-
The affected application. You can also select the application from the list if two or more applications are affected with this violation
-
The graph indicating the SYN attack details
-
The detection message, indicating the total number of times that the application is detected with SYN attack
Small Window Attack
A Small Window Attack is a Denial of Service (DoS) attack that can affect the target machine, by sending thousands of TCP packets with either smaller size window or window size 0. The window size 0 indicates that the target machine has to stop sending any more data until further notice. By sending as much as similar connections to the target machine, the target machine memory gets utilized to the maximum and becomes unresponsive.
Using the Small Window Attack indicator, you can analyze if the NetScaler instance is under the sockstress attack.
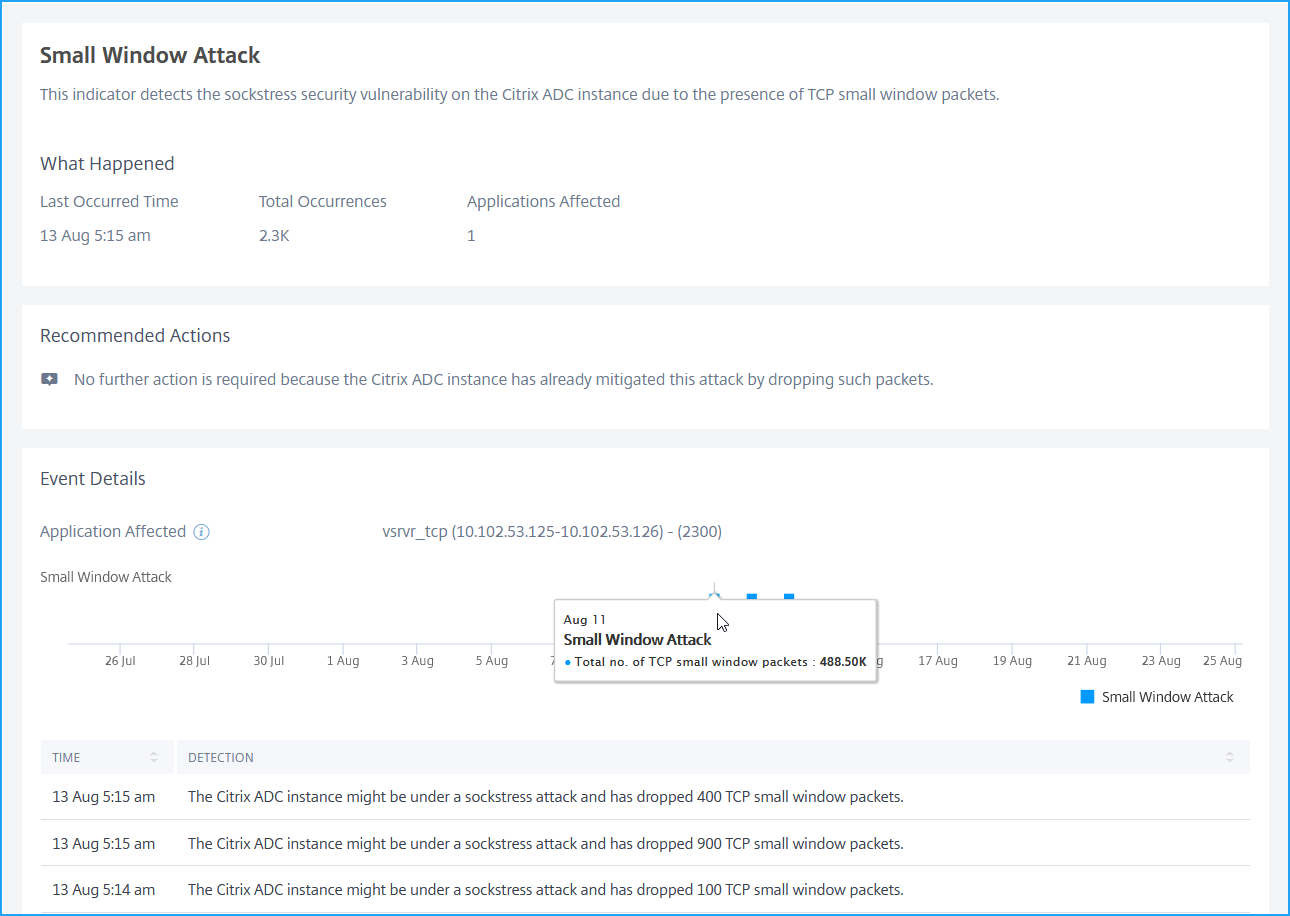
By default, NetScaler instance mitigates this attack by dropping all such TCP small window packets. Hence, as an administrator, no further action is required.
Under Event Details, you can view:
-
The affected application. You can also select the application from the list if two or more applications are affected with this violation.
-
The graph indicating the attack details. Hover the mouse point on the bar graph to view the total number of TCP small window packets detected.
-
The detection message indicating the total TCP small window packets dropped.