
View diagnostic details for partial or no data in service graph
After you complete the required service graph configuration and add the Kubernetes cluster in NetScaler Console, the service graph starts to populate data. In some scenarios, you might observe that service graph displays either partial data or no data. Some of the possible reasons for the partial data or no data in service graph are:
-
Static route is not configured
-
Kubernetes cluster status is down
-
CPX registration is failed
-
CPX virtual servers are not licensed
-
The required analytics configuration is not set that prevents service graph to load all data
As an administrator, you might find it difficult to analyze the reasons when you see service graph displaying partial data or no data. The diagnostics information in service graph page enables you to see the possible reasons and required actions to troubleshoot the partial data or no data issue.
In NetScaler Console, navigate to Applications > Service Graph and click the Microservices tab.
Related information
Diagnostics for no data
If service graph does not display any data, the following diagnostics message is displayed.

Click > to view details. You can view the possible reasons for service graph not displaying any data. The following image is an example for no data in service graph.
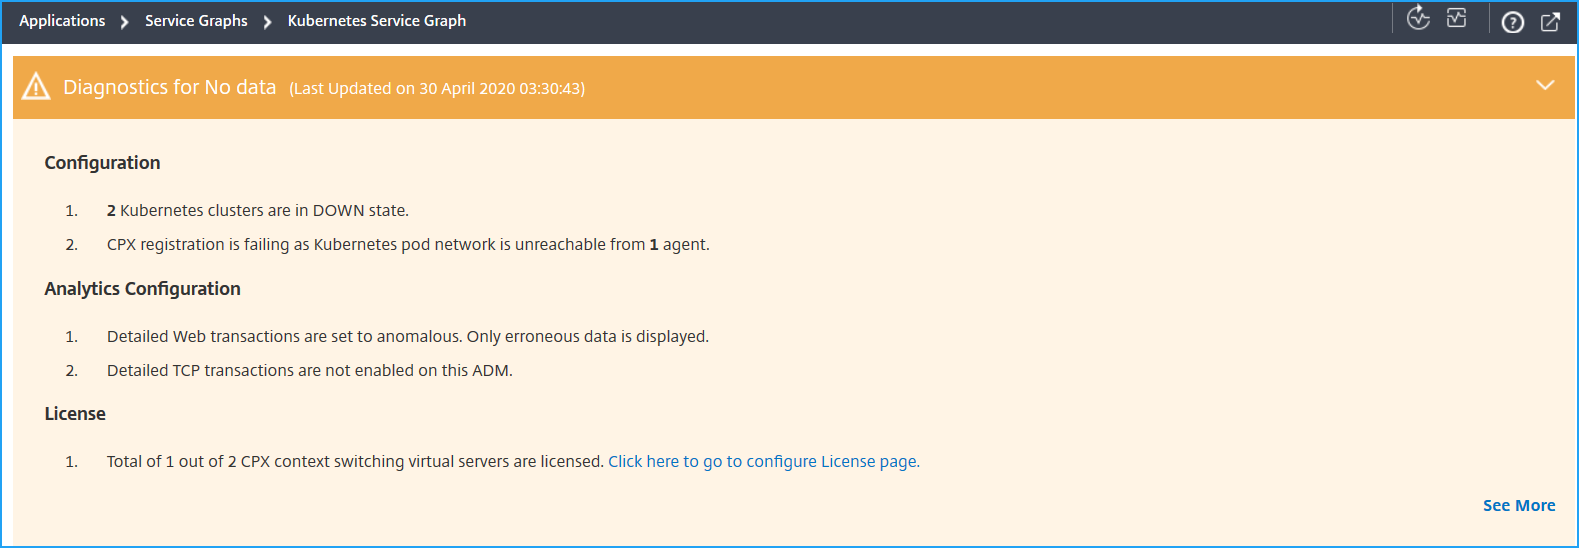
Click See More to view details for the issues.
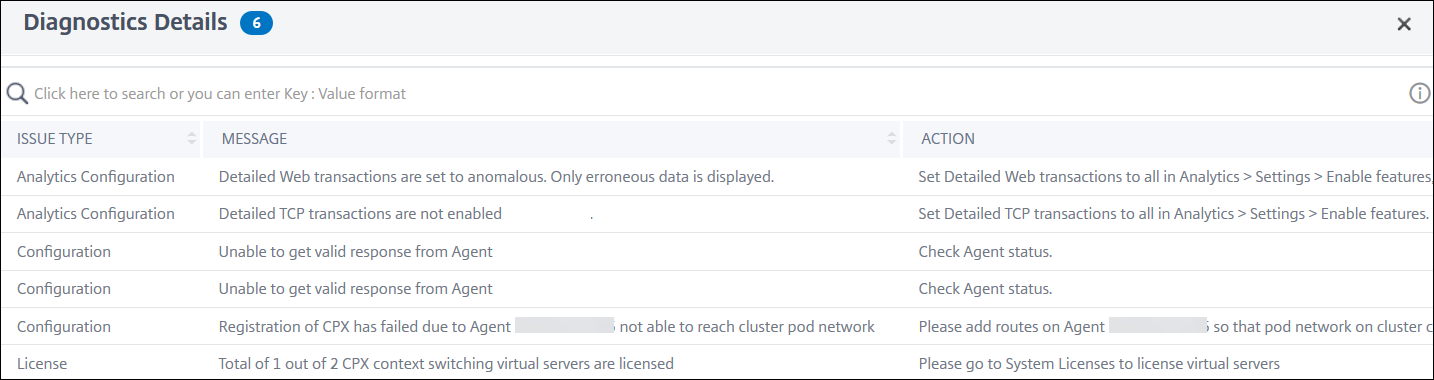
-
Issue Type – Indicates if the issues occurring from configuration, analytics configuration, or licensing.
-
Message – Indicates what has caused the issue.
-
Action – Indicates what action must be performed to troubleshoot the issue.
Diagnostics for partial data
If service graph is displayed only with partial data, click the Show Diagnostics button to view the diagnostics information.
The following example indicates the TCP transactions are disabled.

For this example, you must enable the TCP Transaction Settings to All by navigating to Settings > Analytics Settings.
Troubleshooting
As an administrator, using these diagnostics messages, you can validate these issues and try to troubleshoot these issues. After you troubleshoot, NetScaler Console runs a periodic diagnostic check automatically at a regular interval. After the diagnostics check is complete, the partial data or no data in service graph issue will be resolved.
You can also click Run Diagnostics, select the CPX instances, and click Run Diagnostics.
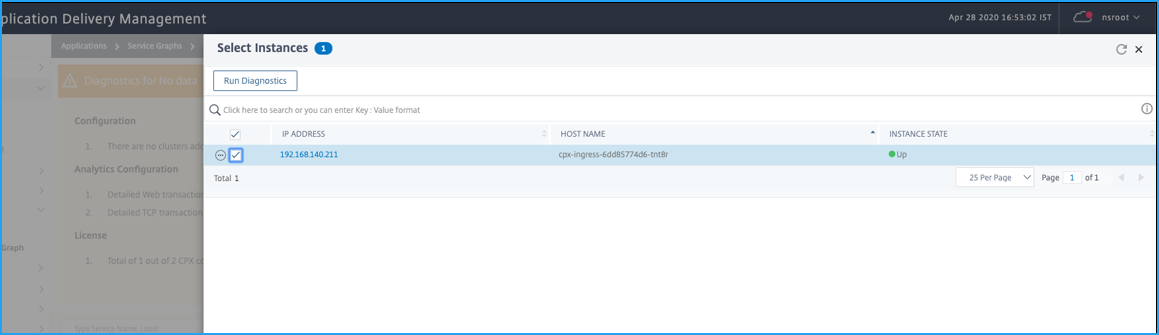
For more troubleshooting scenarios, see the FAQs.