
View details in service graph
In NetScaler Console, navigate to Applications > Service Graphs > Kubernetes service graph and select the time duration from the list to view the service graph details.
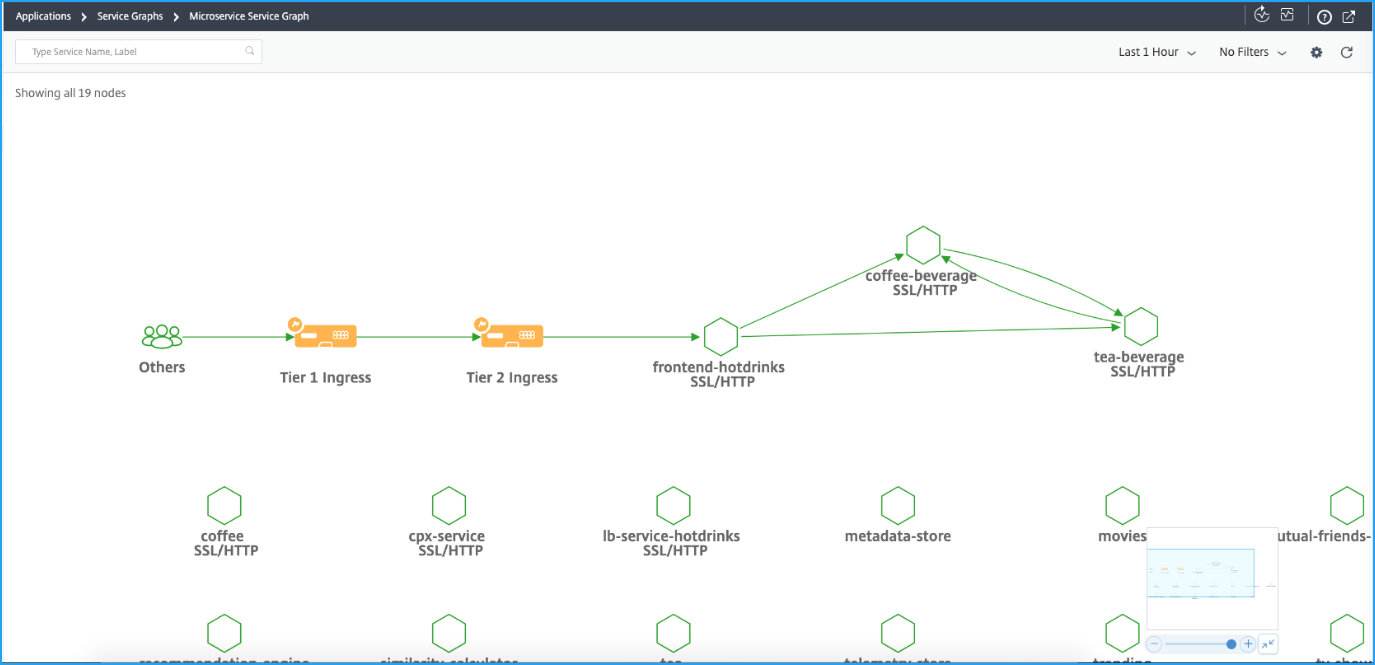
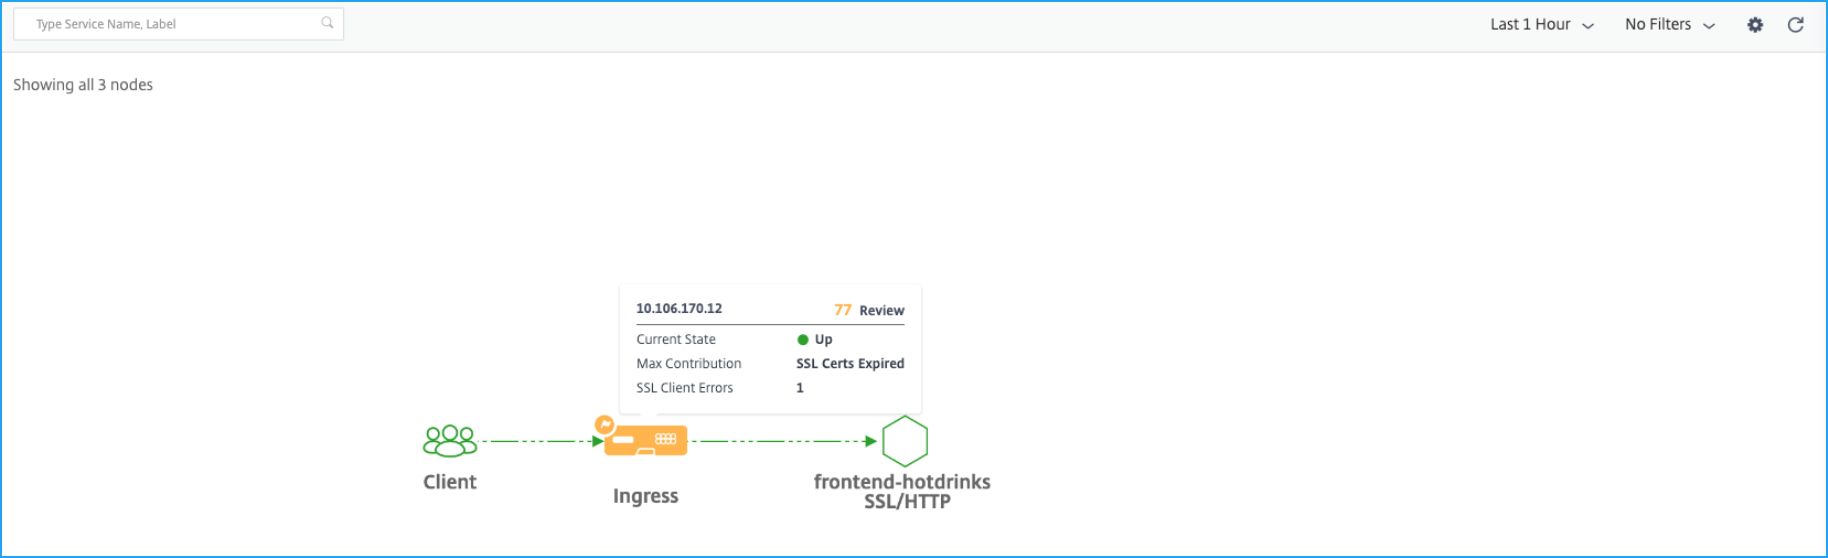
| Two-tier/Service Mesh Lite topology | Single-tier/Unified Ingress topology |
|---|---|
 |
 |
-
Tier 1 ingress – NetScaler Ingress Controller inside the Kubernetes cluster configures a NetScaler instance (VPX/MPX/SDX/BLX) outside the Kubernetes cluster.
-
Tier 2 ingress – NetScaler Ingress Controller running as a sidecar along with NetScaler CPX instance inside the Kubernetes cluster.
-
Ingress – Displays for all other deployment topologies.
Related information
Service graph dashboard
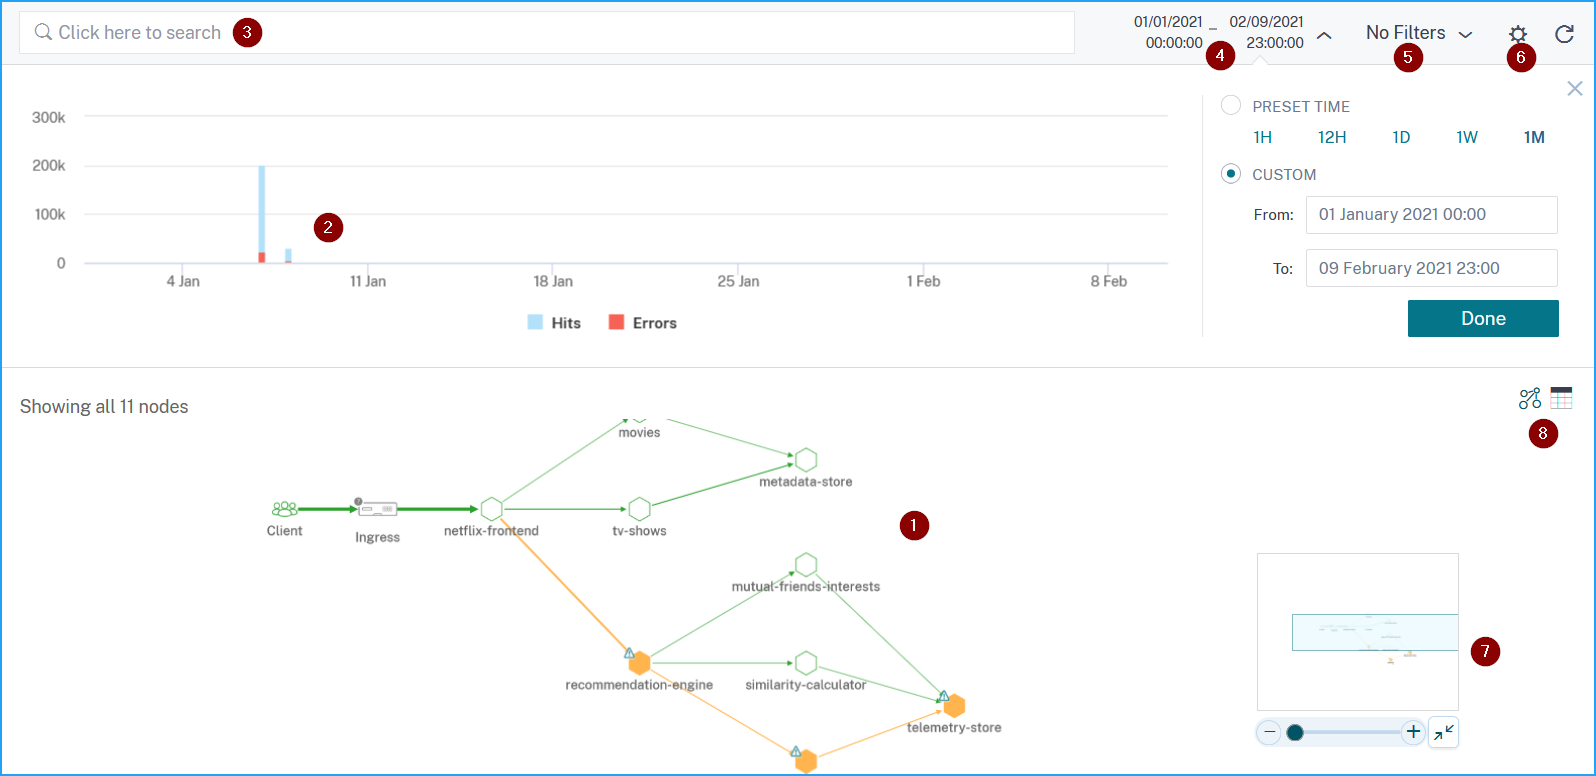
1 - End-to-end network map of your application that shows how your component services are communicating
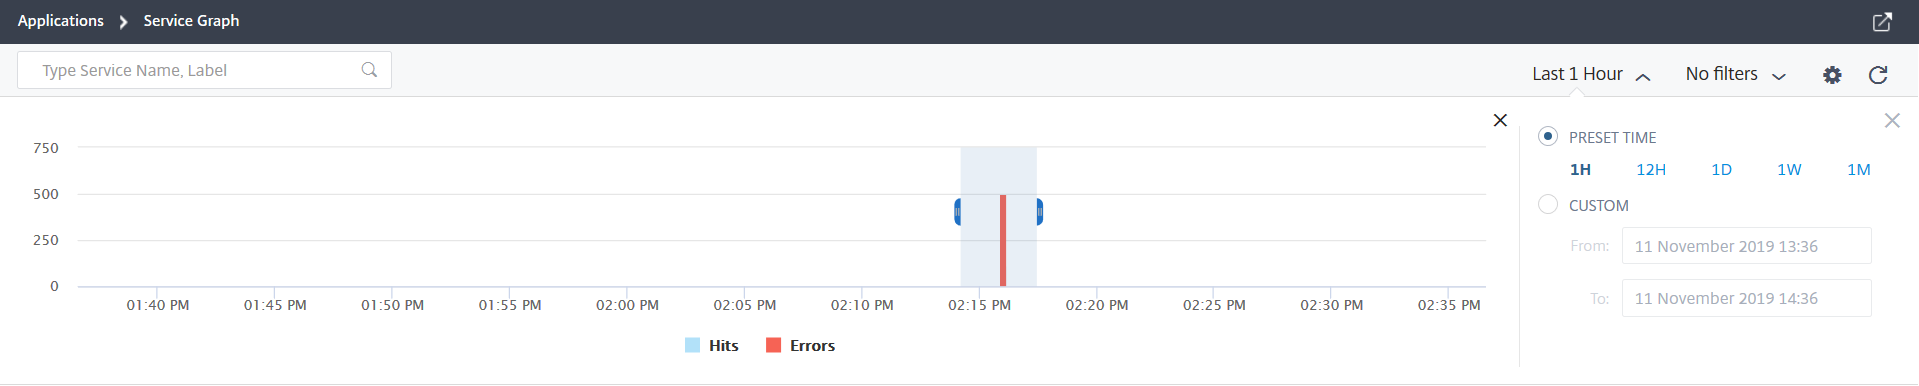
2 – Graph that indicates hits and errors for a specific time duration
3 – Search bar to search for services
4 – Time list to select the time duration
5 - Apply filters to display services
6 – Setting icon
7 – Zoom in and zoom out view
8 – Graph view or tabular view
Based on the selected time duration, you can view the service graph.
| Service icon | Description |
|---|---|
 |
The edge width indicates the number of hits. The greater or more the edge width, indicates the number of hits is higher. |
 |
Service with a warning icon indicates that the service has errors. |
 |
Service with a stopwatch icon indicates that the service has latency or response time issues. |
 |
Service with both stopwatch and warning icons indicate that the service has both errors and latency/response time issues. |
Note
If a service has no warning or stopwatch icon, it indicates that the service has anomalies or threshold breach for Hits.
Based on the selected time duration, you can view the service graph. Select the time period from the graph that indicates hits to drill down further for additional information.
Note
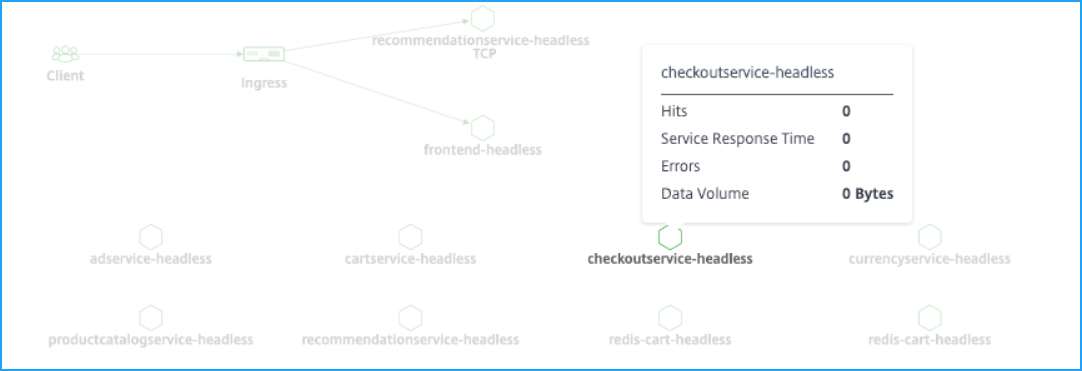
If no active transactions received by NetScaler Console, you can view only the services that are load balanced by the NetScaler instance. When you hover the mouse pointer on a service, all metrics are displayed as 0.
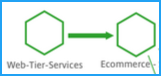
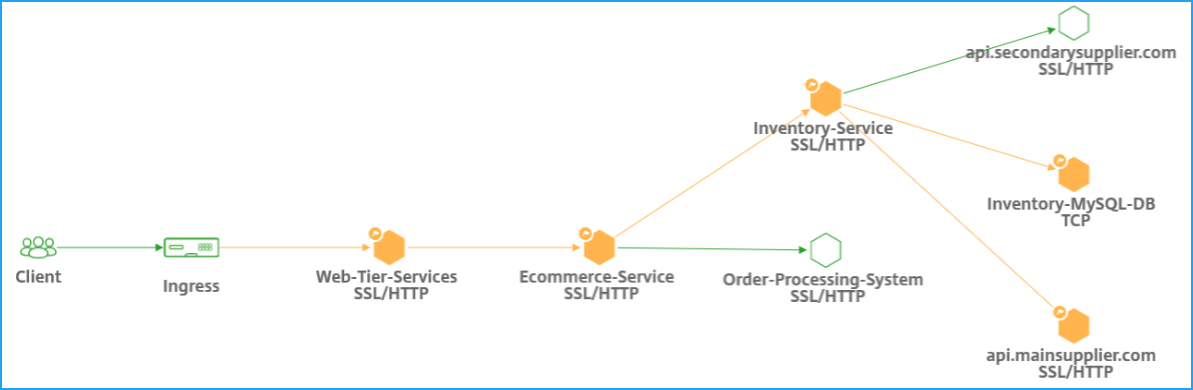
The service graph is displayed with the protocol used by the services. Consider that you have the following services running in your Kubernetes cluster as shown in the image:
Note
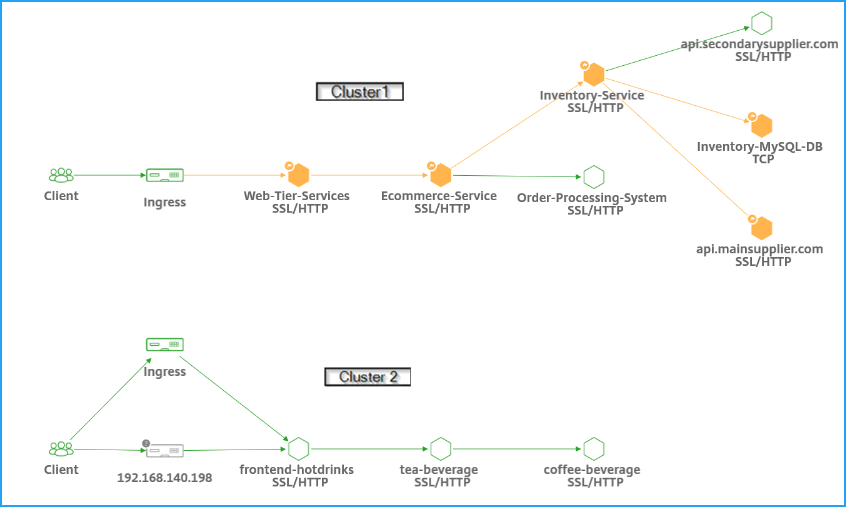
If you have added multiple clusters in Orchestration > Kubernetes > Clusters, you can view services associated with each cluster.
You can view the following status for your services:
-
Critical (red) - Indicates when average service response time > 200 ms AND error count > 0
-
Review (orange) - Indicates when average service response time > 200 ms OR error count > 0
-
Good (green) - Indicates no error and average service response time < 200 ms
The following are protocols that enable you to identify the protocol used by a service:
-
TCP – Indicates the service is using the TCP protocol.
-
SSL, HTTP – Indicates the service is using the SSL over HTTP protocol.
-
SSL, TCP – Indicates the service is using the SSL over TCP protocol.NoteThe service without a protocol indicates the service is using the HTTP protocol.
View key metrics trends using the tabular view
Using the tabular view, you can see:
-
Key metrics for the service
-
Key metrics between a source service to a destination service
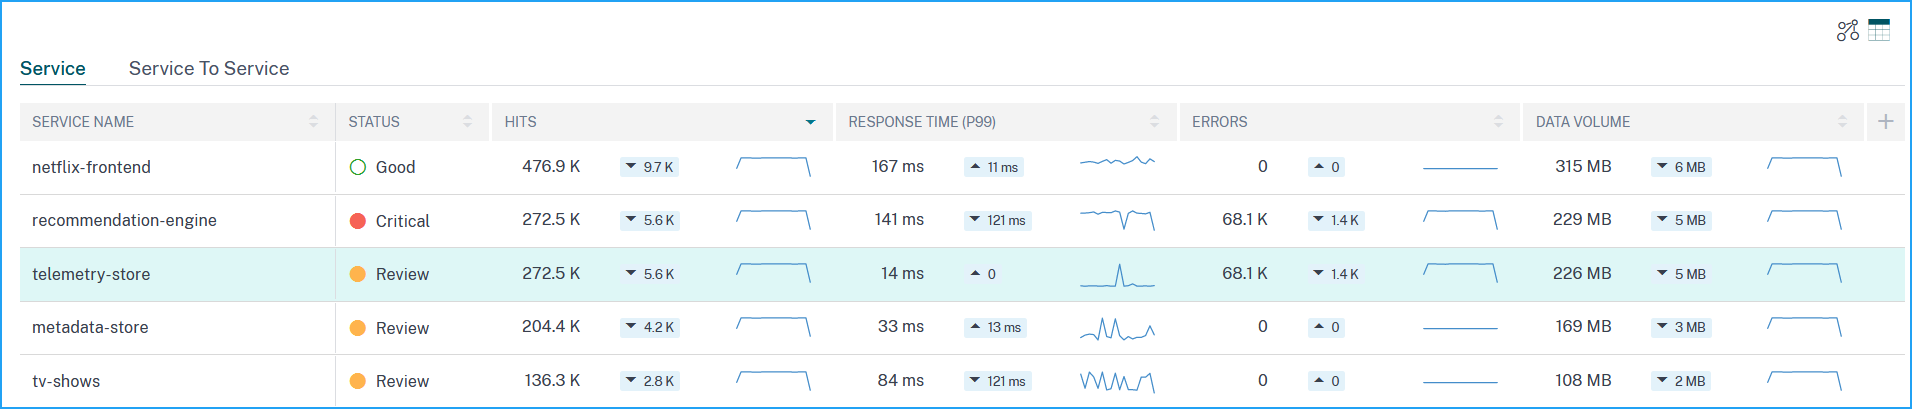
As an administrator, using these key metrics, you can analyze the trends of golden signals for the selected time duration.
View client metrics
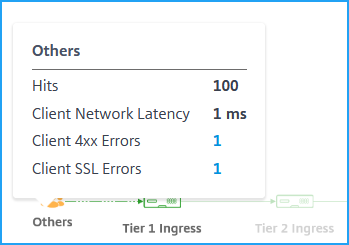
You can view from which location the client is accessing the service. As an administrator, you can visualize the client metrics and analyze the issues that occur from the client.
Hover the mouse pointer on a client region to view the metrics.
-
Hits - Indicates the total hits received by the client.
-
Client Network Latency - Indicates the average client network latency.
-
Client 4xx Errors - Indicates the total client 4xx errors.
-
Client SSL Errors - Indicates the total client SSL errors.
IP blocks in NetScaler Console - NetScaler Console can recognize the client location if the client uses a public IP address. NetScaler Console has its built-in location CSV file that matches the location based on the client IP address range.
NetScaler Console can recognize the client location with private IP address only when the IP address is added to the NetScaler Console server. For example, if the client IP address falls within a private IP address range associated with City A, NetScaler Console recognizes that the traffic is originating from City A for this client.
Create a private IP block
NetScaler Console can recognize the location of a client when the client private IP address is added to the NetScaler Console server. For example, if the IP address of a client falls within the range of a private IP address block associated with City A, NetScaler Console recognizes that the traffic is originating from City A for this client.
To create an IP block:
-
In NetScaler Console, navigate to Settings > Analytics Settings > IP Blocks, and then click Add.
-
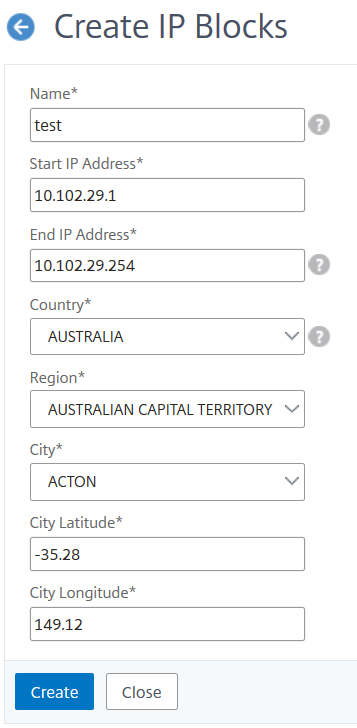
In Create IP Blocks page, specify the following parameters:
-
Name. Specify a name for the private IP block
-
Start IP address. Specify the lowest IP address range for the IP block.
-
End IP address. Specify the highest IP address range for the IP block.
-
Country. Select the country from the list.
-
Region. Based on the country, the region is auto-populated, but you can select your region.
-
City. Based on the region, the city is auto-populated, but you can select your city.
-
City Latitude and City Longitude. Based on the city you select, the latitude and longitude are auto-populated.
-
-
Click Create to finish.
Public IP blocks
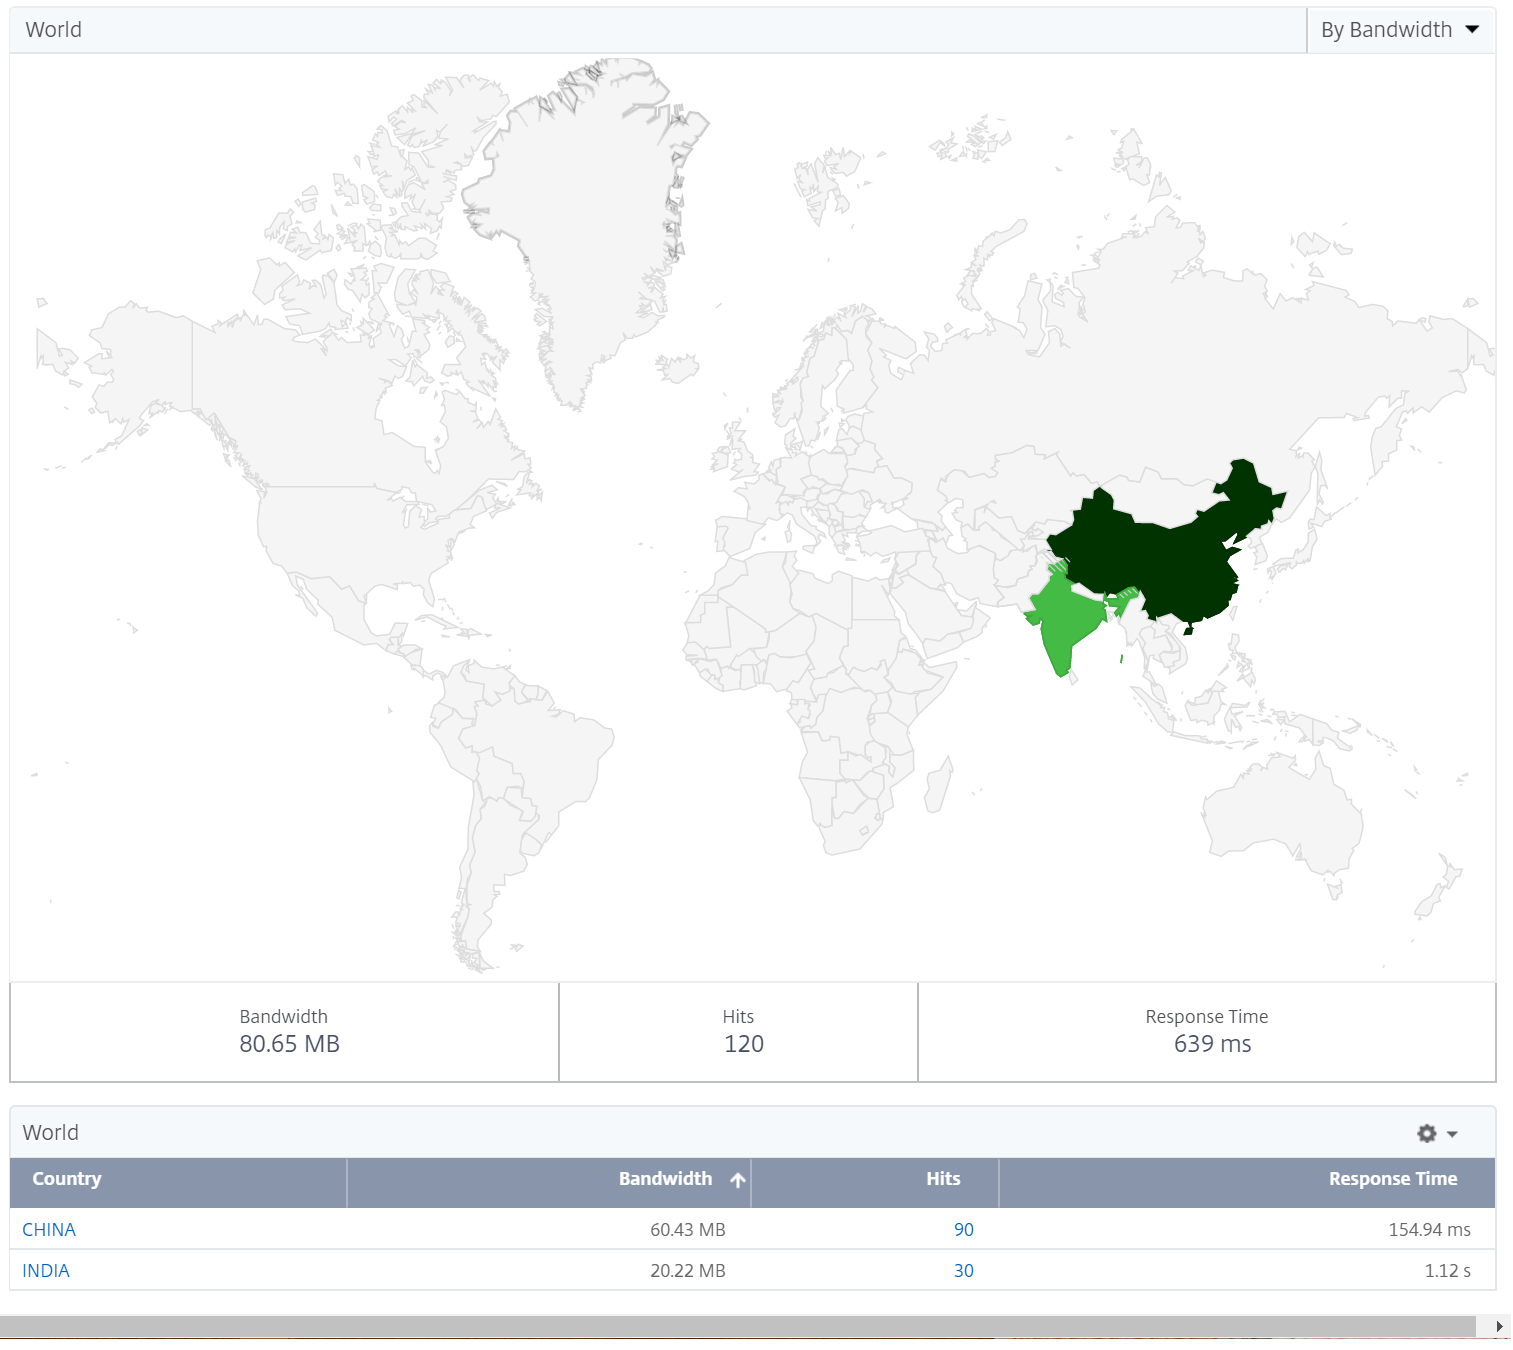
NetScaler Console can also recognize the location of a client if the client uses public IP address. NetScaler Console has its built-in location CSV file that matches the location based on the client IP address range. For using public IP block, the only requirement is that you have to enable the Enable geo data collection from the Configure Insight page.
Note
NetScaler Console requires an internet connection to display the geomaps for a particular geographical location. Internet connection is also required to export the GeoMap in .pdf, .png, or .jpg formats.
View ingress metrics
You can view the type of ingress used in the Kubernetes cluster.
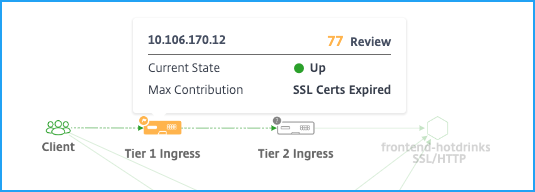
-
NetScaler IP address and its score
-
Current State – Indicates if the NetScaler instance is Up, Down, or Out of Status
-
Max Contribution – Indicates the issue that is affecting the instance score
For the single-tier topology, you can view only a single Ingress.
Click the Ingress to drill down further for details. For more information, see View ingress details for troubleshooting issues.
View TCP and SSL metrics
Using the TCP and SSL metrics, you can:
-
View TCP connection details between services
-
Determine if TCP-related issues are from the source or destination service
-
View if the SSL error is from the source or destination service
-
View the SSL protocol version used by SSL services
TCP metrics
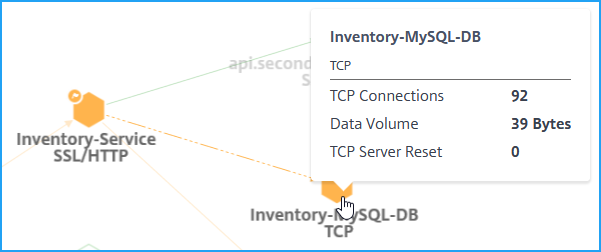
Hover the mouse pointer over a TCP service or its associated incoming service to view the TCP metrics.
-
TCP connections – Total connections established between the services
-
Data Volume – Total data processed by the service
-
TCP Server Reset – Total TCP resets initiated from the server
SSL metrics
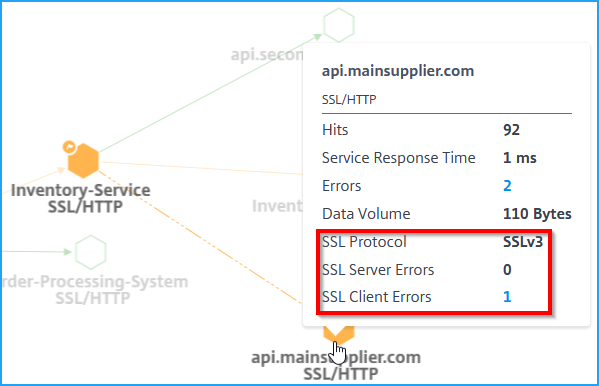
Hover the mouse pointer on a service that uses SSL protocol to view the SSL metrics.
-
SSL Server Errors – Indicates the total SSL errors from the server. (For example, SSL certificate unknown)
-
SSL Protocol – Indicates the SSL protocol version used by the service
-
SSL Client Errors - Indicate the total SSL errors from the client. (For example, SSL client authentication error)
View service details
Click a service and select View Details to view the service details. For more information, see View service details.
Apply filters
You can apply filters to view specific service information. Click No Filters list to get the filter options.
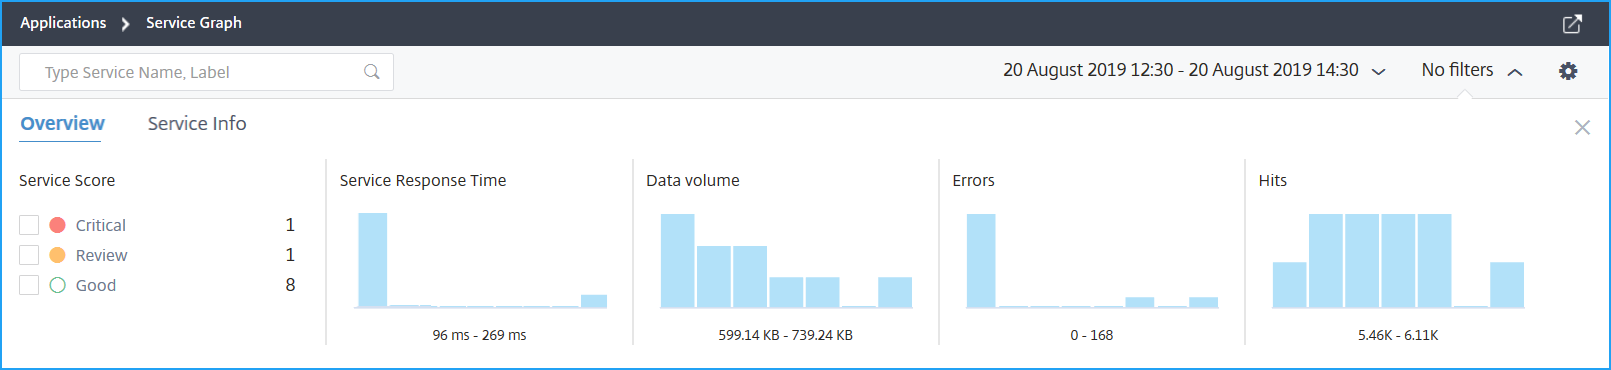
For example, if you want to view services that have latency less than 150 ms, then click the bar graph under Service Response Time to display the results.
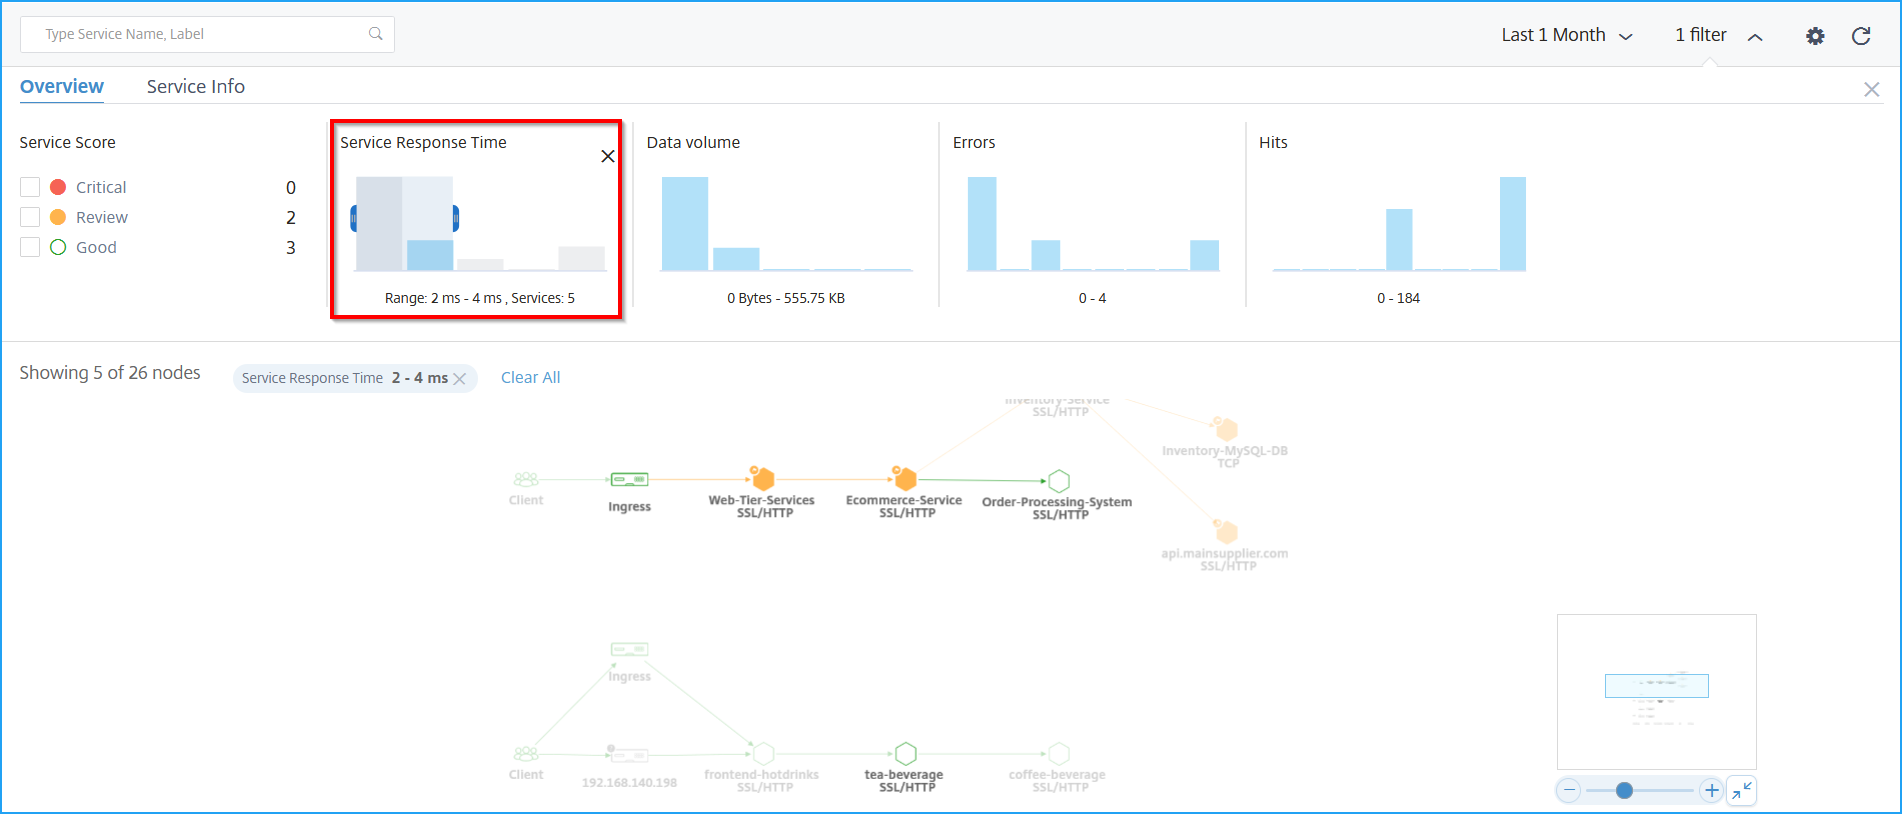
Click Service Info to select and apply filters for:
-
Cluster – Displays all services applicable for the selected cluster or clusters.
-
Namespace – Displays all services applicable for the selected namespace.
 NoteDepending upon the labels configured for the service in Kubernetes service definition YAML, you may also view more filter options.
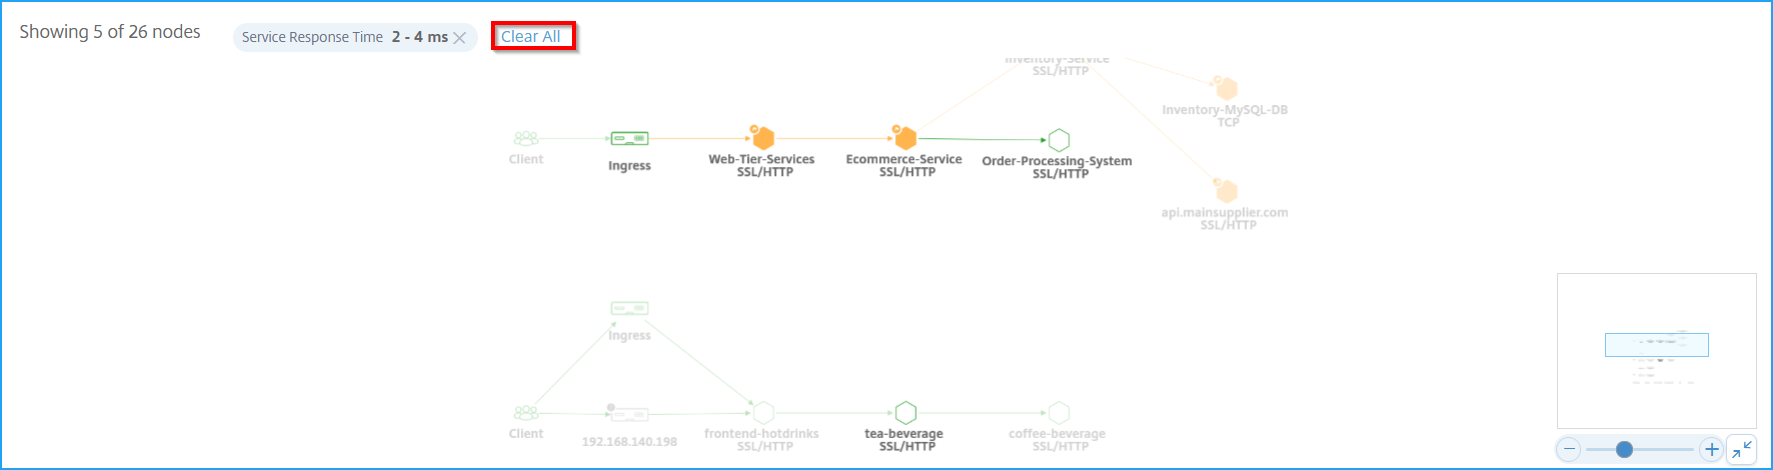
Click Clear All to clear all filters.
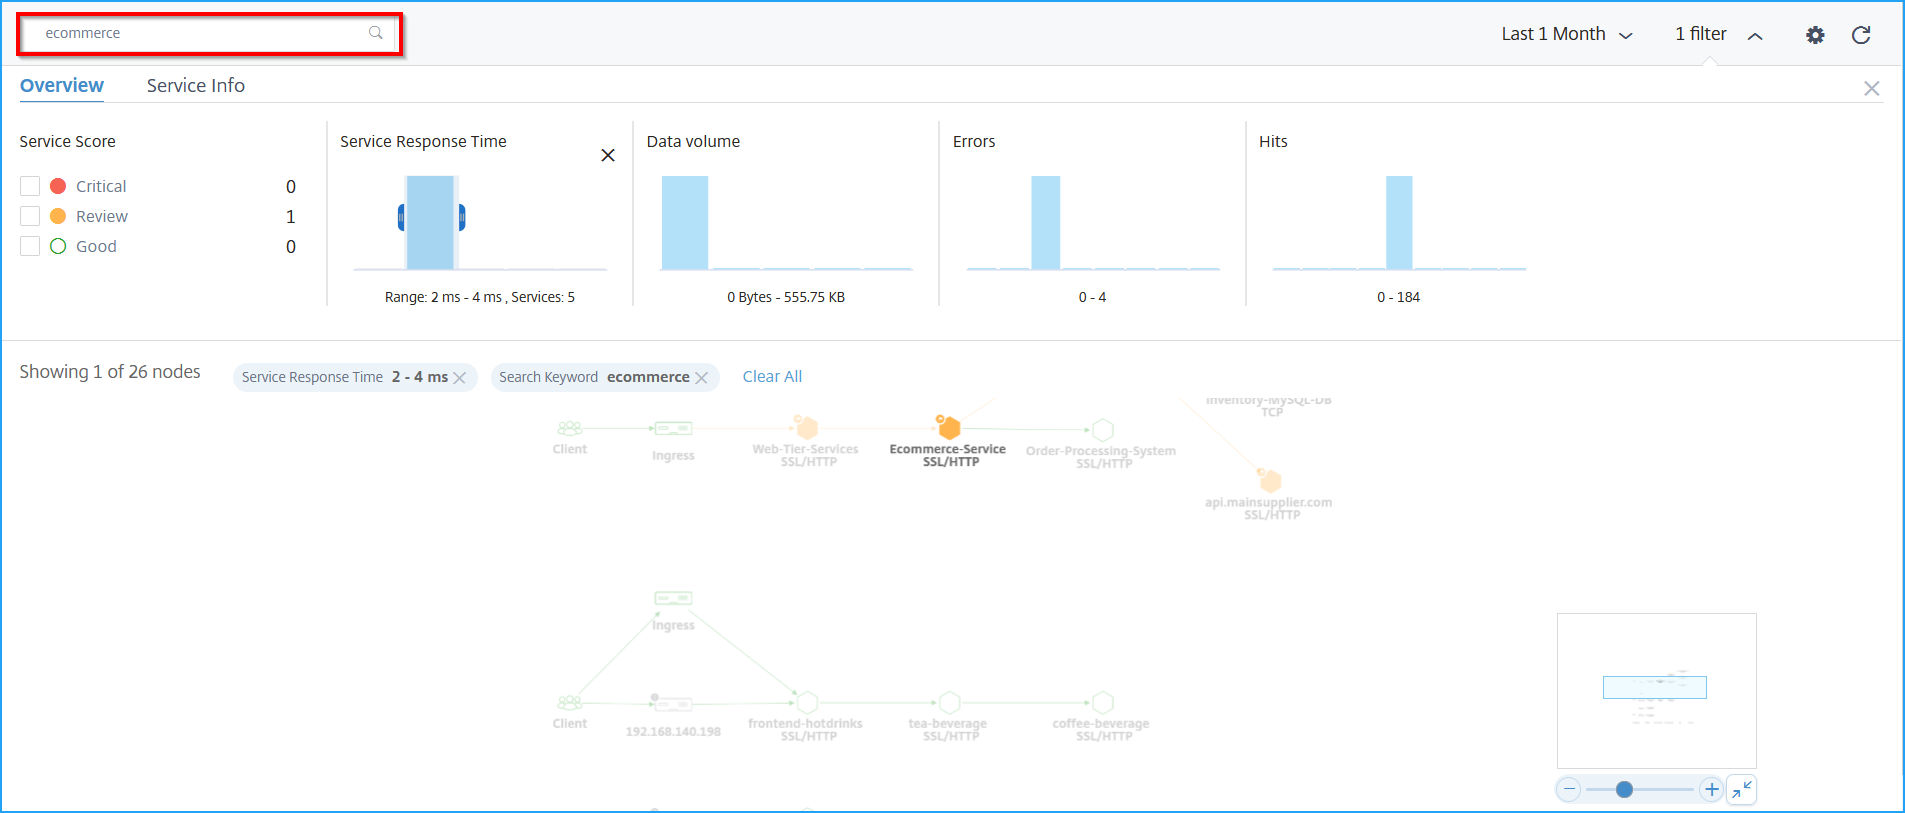
Alternatively, you can also use the search text box and type a service name to display the results on the service graph.
Using the settings option
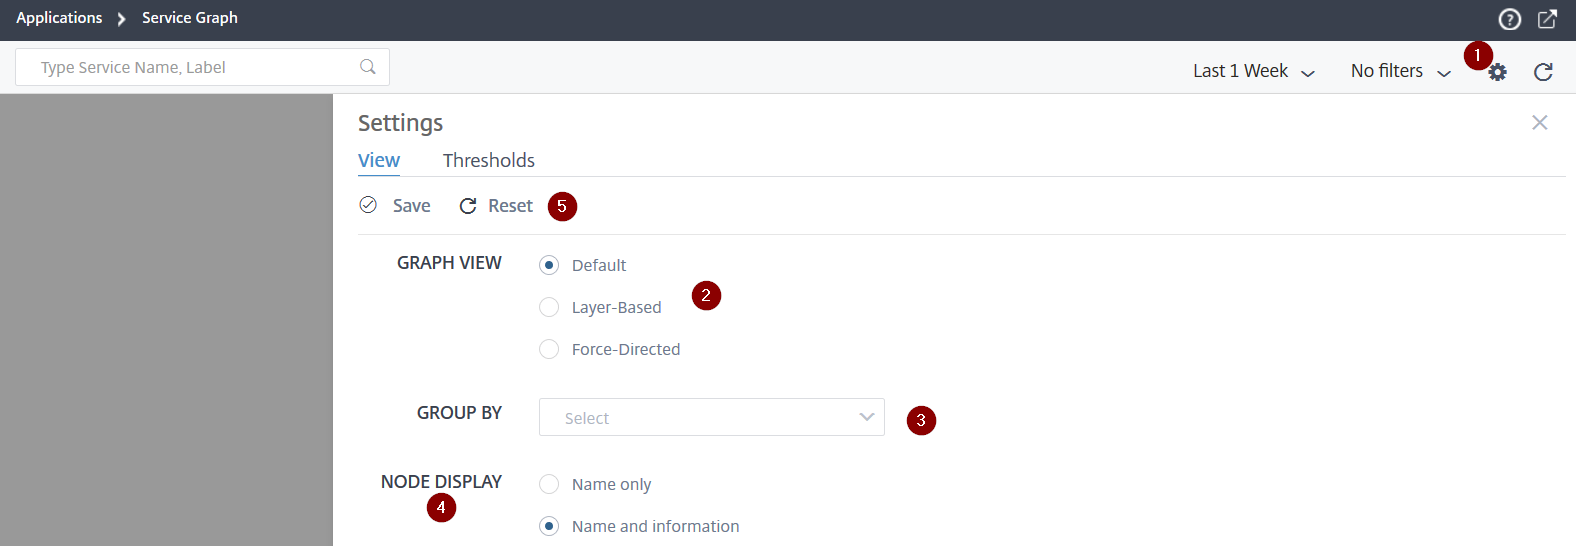
1 – Settings icon
2 – Options to display the service graph as Default, Layer-Based, or Force-Directed views
3 – Select the options from the list to view the services based on categories. After you select a category from the list, click + on the graph to view all services
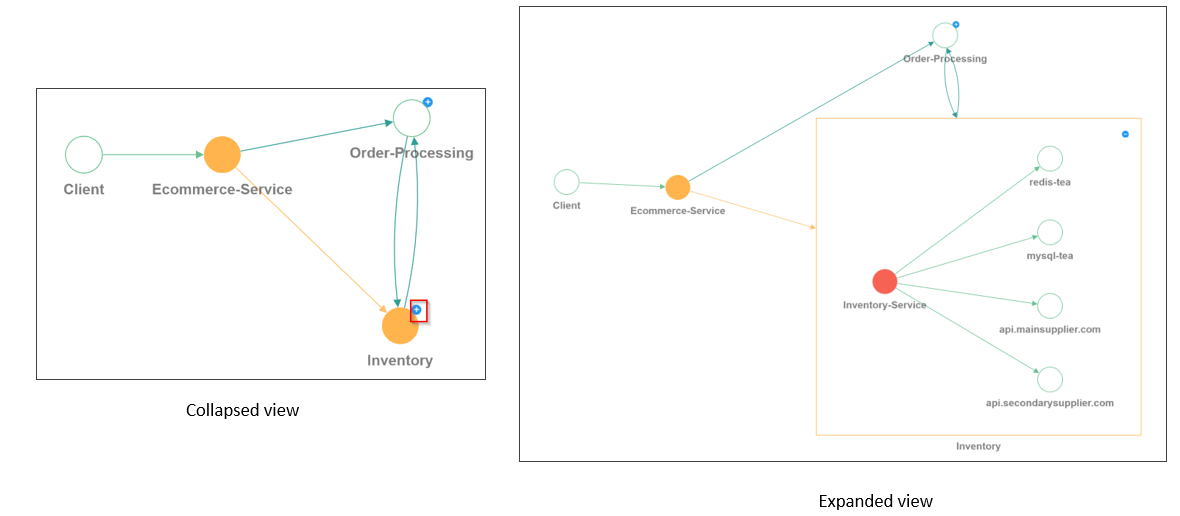
4 – Enables you select the option on how you want to display the services.
5 - Options to either save the settings or to reset to default.
Analyze the errors
Hover the mouse pointer on a service that indicates errors.
| Error | Description |
|---|---|
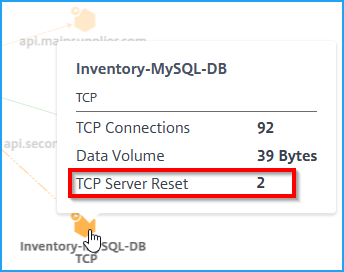 |
The TCP Server Reset indicates the total TCP resets initiated from the server. |
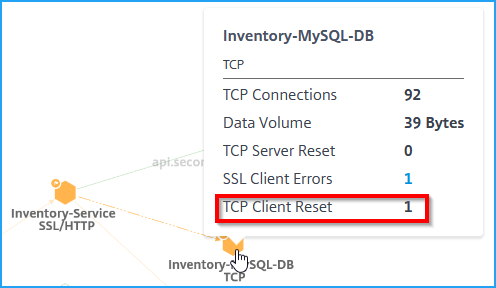 |
The TCP Client Reset indicates the total TCP resets initiated by the client. |
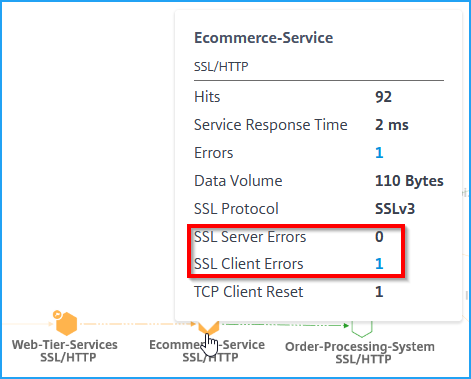 |
The SSL Client Errors indicate the total SSL errors from the client. (For example, SSL client authentication error). |
| The SSL Server Errors Indicate the total SSL errors from the server. (For example, SSL certificate unknown) |
Note
-
Client error count (irrespective of the protocol type) is displayed in any service if the client error count is 1 or higher.
-
Clients error count displayed for any service indicates that the errors are from the client end.
View HTTP transaction details
Note
You can view the errors by hovering the mouse pointer on an erroneous service and click the issue count.
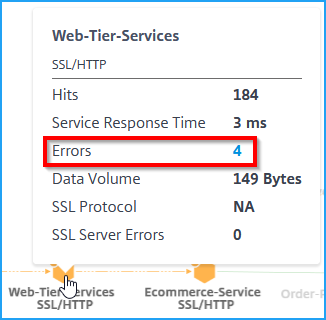
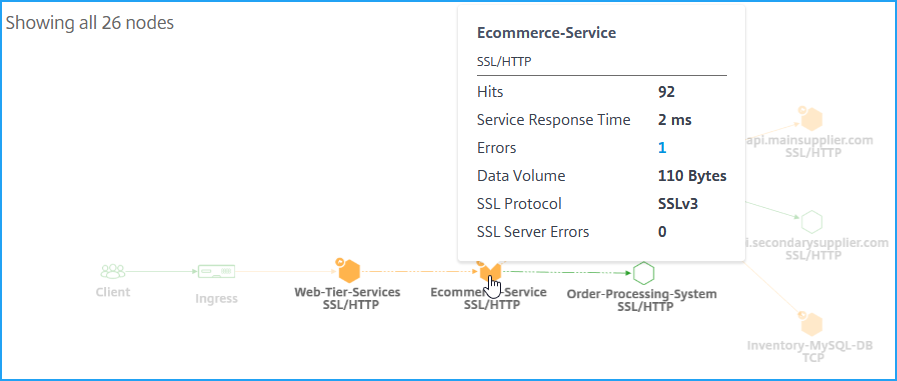
According to the example shown in the image, you can view an end-to-end network map of your application that shows how your component services are communicating.
When you hover the mouse pointer on the Ecommerce-Service, you can view metrics details for Ecommerce-Service.
NetScaler Console also enables you to view transaction details between Ingress and services. Hover the mouse pointer to view details such as total errors, average service response time, and so on between the Ingress and service.
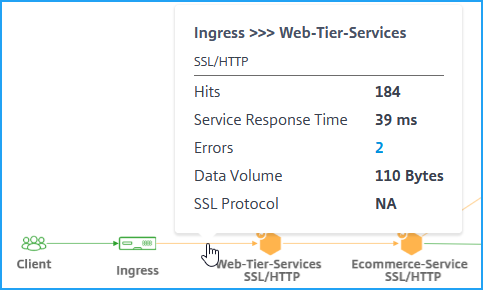
Hits – Indicates the total number of hits received by the service.
Service Response Time – Indicates the average response time taken from the service to respond for Time To First Byte (TTFB).
Errors – Indicates the total errors such as 4xx, 5xx, and so on.
Data volume – Indicates the total volume of data processed by the service.
SSL Protocol – Indicates the SSL protocol version.
Click the arrow between Ingress and service to view the detailed transactions.
For more information, see View analytics for Web transactions.