
Integration with Microsoft Sentinel
You can integrate NetScaler Console with Microsoft Sentinel to export the following analytics from NetScaler Console to Microsoft Sentinel:
-
WAF violations
-
Bot violations
-
SSL certificate insights
-
Gateway insight
-
Metrics and events
-
NetScaler® Console audit logs
Microsoft Sentinel provides centralized data collection that gathers data from various sources such as applications, servers, and so on. As an administrator, you can view data and make decisions after the insights or violations are reported in Microsoft Sentinel.
For a successful integration, ensure that you have an active Azure subscription and then follow the procedure under each section:
Related information
Configure the Log Analytics Workspace
A Log Analytics Workspace is required to store and analyze the collected data.
-
Login to Azure.
-
Click Create a resource.

-
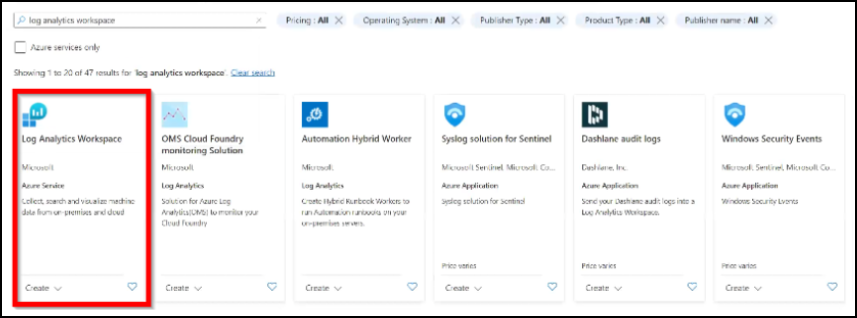
In the search bar, type log analytics workspace and click Create under Log Analytics Workspace.
-
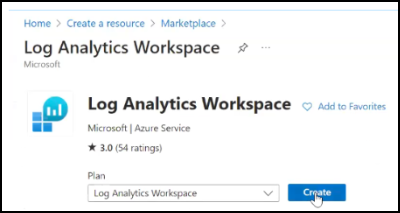
In the Log Analytics Workspace main page, click Create.
-
In the Create Log Analytics workspace:
-
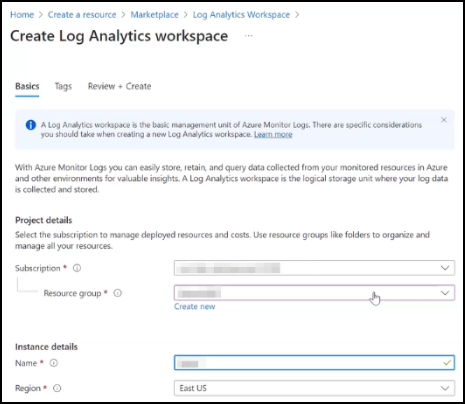
Select the active Subscription and the Resource group.Note:You can also click Create new to add a resource group if you have the privilege.
-
Specify a name of your choice.
-
Select your region from the list.
-
Click Review + Create.
-
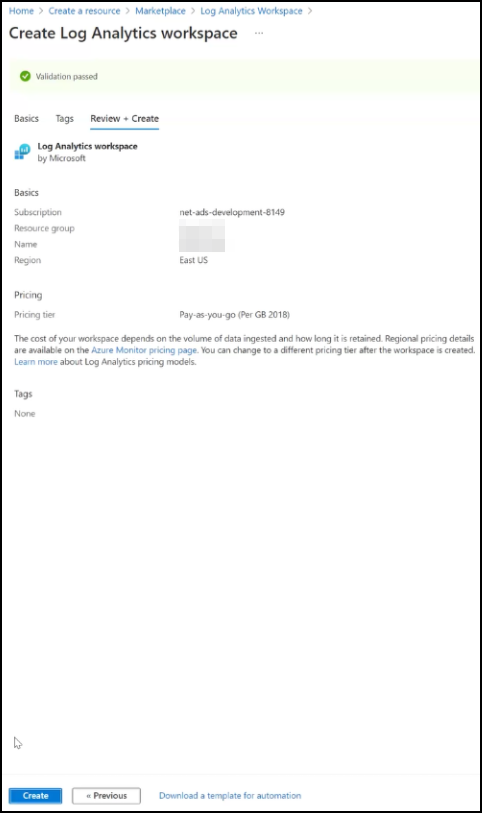
A validation passed message appears. Click Create to deploy the workspace.
-
You can see the deployment in progress message. After you see the deployment complete message, click Go to resource.
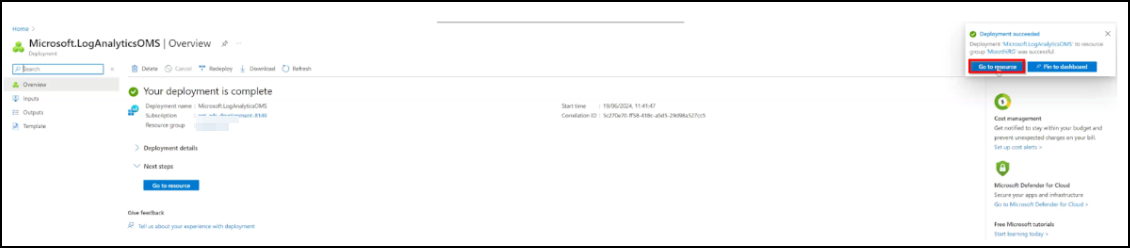 The workspace is successfully created.
-
Create a Microsoft Entra application
You must create an Entra application associated with your Azure subscription to communicate on behalf of Log Analytics Workspace. After you create the application, you must also grant permission with Microsoft Sentinel Contributor role. The application also provides details such as Client ID, Tenant ID, and Client Secret. We recommend that you make a note of these details. These details are required when you create a subscription in NetScaler Console to complete the integration process.
-
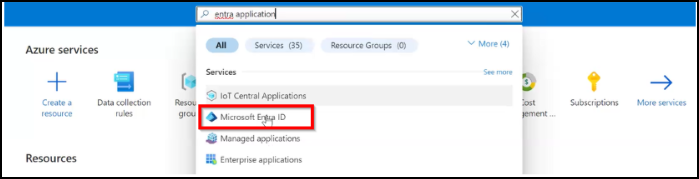
In your Azure portal, type the keyword in the search bar.
-
Click Microsoft Entra ID.
-
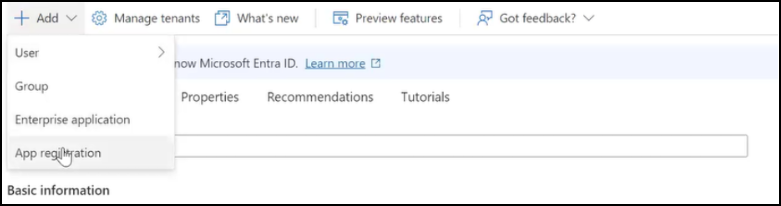
Click Add and select App registration.
-
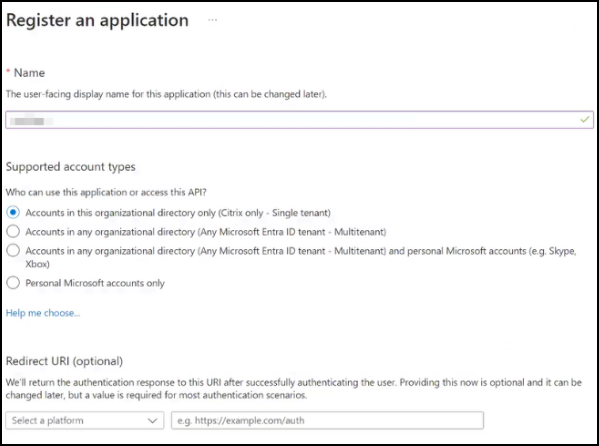
Specify a name for the app, select the default option under Supported account types, and then click Register.
-
After you register the application:
-
Make a note of Client ID and Tenant ID.

-
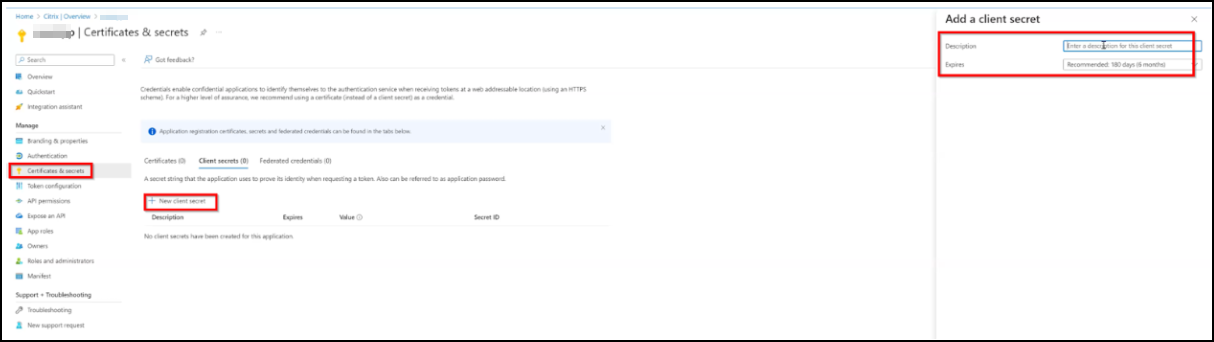
Create a Secret ID for your application. Click Certificates & secrets and under Client secrets, click New client secret. Provide a description, validity, and then click Add to create a secret ID for your application.
-
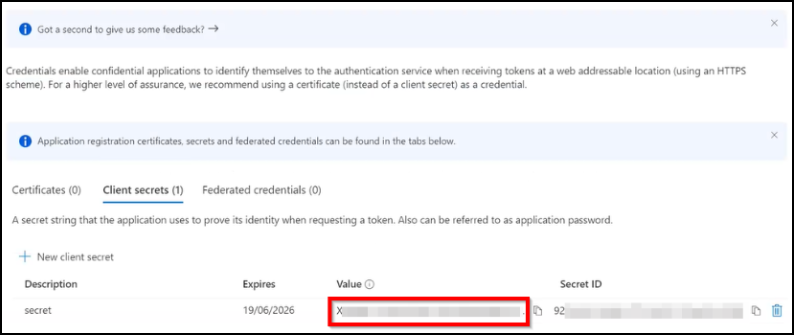
The details are displayed for your application. Ensure that you make a note of the ID displayed under Value immediately after the secret is created. This value gets hidden if you navigate to any other GUI option.
-
Send data to Microsoft Sentinel by using the Microsoft Entra ID data connector
Microsoft Entra ID logs provide comprehensive information about users, applications, and networks accessing your Entra tenant. For more information, see Send data to Microsoft Sentinel using the Microsoft Entra ID data connector.
Configure data collection endpoint
You must create a data collection endpoint to get the endpoint URL. This is required when you create a subscription in NetScaler Console.
-
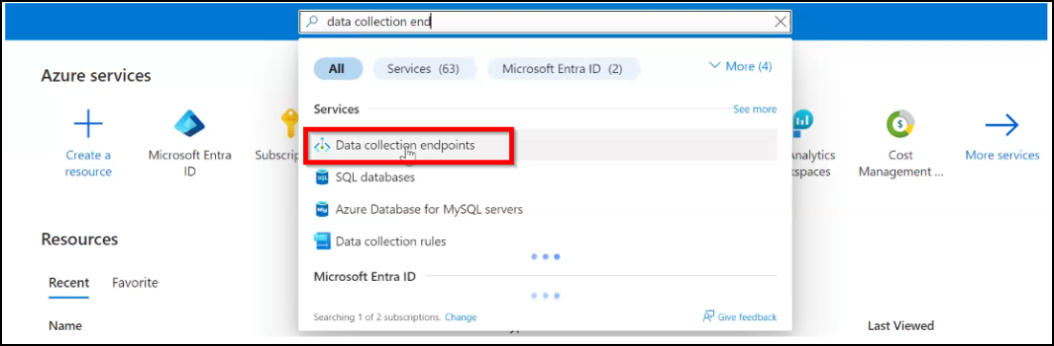
In your Azure portal, under Azure services, select Data collection endpoints or type the keyword in the search bar.
-
Click Create in the Data collection endpoints page.

-
In Create data collection endpoint:
-
Specify an endpoint name of your choice
-
Select the Subscription, Resource Group, and Region.
-
Click Review + Create.
-
After you see the validation passed message, click Create.
-
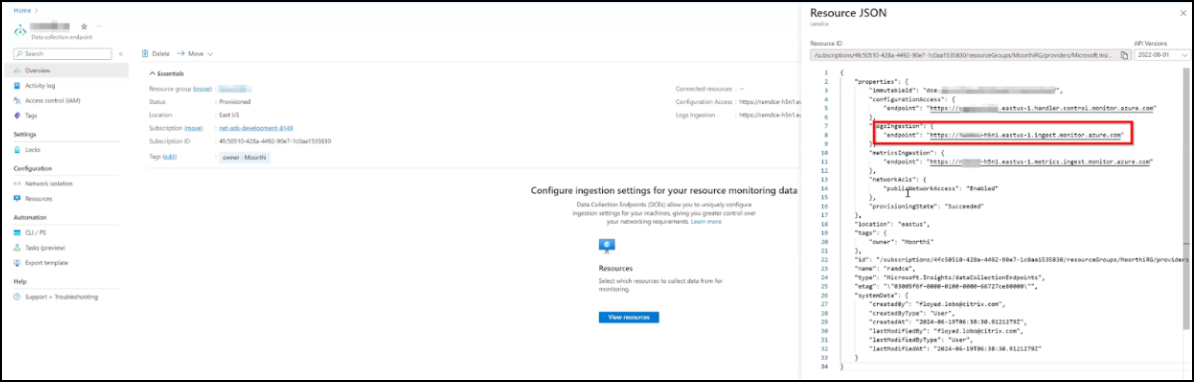
You must make a note of the endpoint URL. In the Data collection endpoint main page, select the created endpoint, click JSON view, and make a note of the endpoint ID.
Create tables to export data
You must create a table and provide the JSON information for each insight that you want to export from NetScaler Console to Microsoft Sentinel. You can refer to the following details on the table requirements for each insight:
| Insights | Total number of tables required |
|---|---|
| SSL insights | 3 |
| WAF | 1 |
| Bot | 1 |
| Gateway insights | 5 |
| Events | 1 |
| Metrics | 1 |
| Audit logs | 1 |
You can create a maximum of 10 tables for each Data Collection Rule (DCR). Beyond 10 tables, you must create another DCR.
-
Navigate to your workspace in the Azure portal and click Tables under Settings.
-
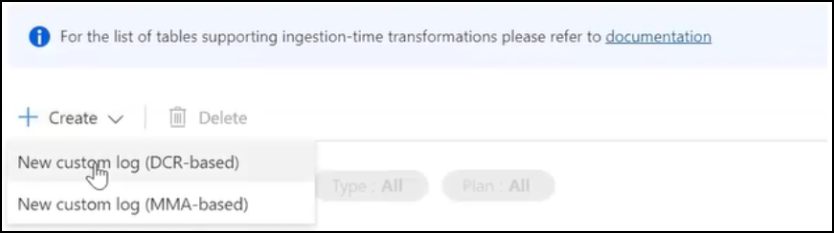
Click Create and select New custom log (DCR-based)
-
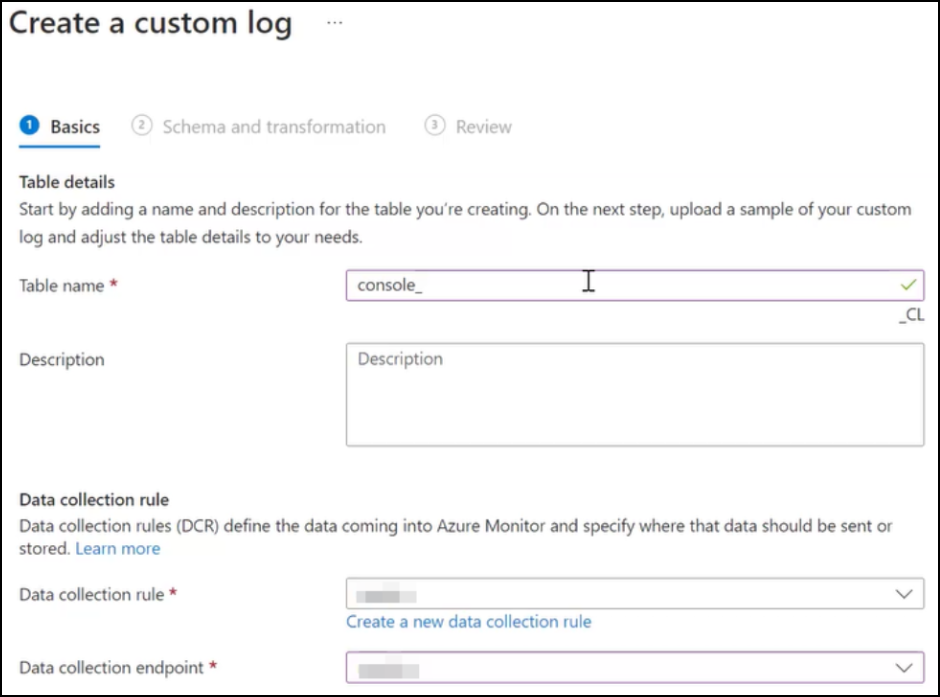
In Create a custom log:
-
Specify a table name. The table name must be in the format console_insightname. For example: console_ns_sslvserver, console_ns_ssl_certkey. You can refer to step 4 to get the table names applicable for each insight.
-
Provide a description to add more information about the table name. This is optional.
-
Create a new data collection rule and add.
-
Select the Data collection endpoint from the list.
-
Click Next.
-
-
In the Schema and transformation tab, you must upload the JSON sample logs for the insight that you want to export. You can use the following sample JSON for each insight and create a JSON file to upload:
Insights JSON Table name to be used SSL (1) {"id": "3eb05733-c326-493c-9aa0-f7db3a6b4277", "ns_ip_address": "10.106.186.141", "name": "zeta_192_168_110_250", "vsvr_ip_address": "", "vsvr_port": -1, "vsvr_type": "", "state": "", "partition_name": "", "display_name": "10.106.186.141", "poll_time": 1716539986, "managed": "f", "ssl2": "f", "ssl3": "t", "tls10": "t", "tls11": "t", "tls12": "t", "dh": "f", "ersa": "t", "sslprofile": "", "tls13": "f", "dhkeyexpsizelimit": "DISABLED", "pushenctriggertimeout": 1, "sessionticket": "", "includesubdomains": "f", "sessionticketkeyrefresh": "", "ssllogprofile": "", "serverauth": "", "ssltriggertimeout": 100, "ersacount": 0, "strictcachecks": "NO", "dhfile": "", "sessreuse": "ENABLED", "redirectportrewrite": "DISABLED", "skipclientcertpolicycheck": "", "tls13sessionticketsperauthcontext": 1, "cipherredirect": "DISABLED", "dropreqwithnohostheader": "NO", "sessionticketlifetime": -1, "maxage": 0, "pushenctrigger": "Always", "strictsigdigestcheck": "f", "sslredirect": "DISABLED", "sessionkeylifetime": -1, "alpnprotocol": "", "clientauthuseboundcachain": "", "sesstimeout": 120, "clientcert": "", "snihttphostmatch": "CERT", "preload": "NO", "prevsessionkeylifetime": -1, "sessionticketkeydata": "", "encrypttriggerpktcount": 45, "cleartextport": "", "ssliocspcheck": "", "hsts": "f", "sslinterception": "", "commonname": "", "sslireneg": "", "ocspstapling": "DISABLED", "quantumsize": 8192, "insertionencoding": "Unicode", "sslimaxsessperserver": -1, "cipherurl": "", "pushflag": 0, "zerorttearlydata": "DISABLED", "allowextendedmastersecret": "", "dhekeyexchangewithpsk": "NO", "clientauth": "DISABLED", "denysslreneg": "NONSECURE", "sendclosenotify": "YES", "dhcount": 0, "snienable": "DISABLED", "table_name": "ns_sslvserver"}console_ns_sslvserver SSL (2) {"id": "a6673ab2-0b59-47b9-b530-bc30fb2b937c", "ssl_certificate": "/nsconfig/ssl/ca-cert.pem", "ssl_key": "/nsconfig/ssl/ca-key.pem", "certkeypair_name": "athul-ca", "cert_format": "PEM", "days_to_expiry": 281, "ns_ip_address": "10.106.186.141", "status": "Valid", "device_name": "10.106.186.141", "file_location_path": "", "certificate_data": "", "key_data": "", "poll_time": 1717434335, "no_domain_check": "f", "version": 3, "serial_number": "7B34B6A6A1A79E0FF168242D7BCFF78F04C9EE66", "signature_algorithm": "sha256WithRSAEncryption", "issuer": "C=IN,ST=KA,L=BAN,O=CIT,OU=ADM,CN=A", "valid_from": "Mar 12 08:51:11 2024 GMT", "valid_to": "Mar 12 08:51:11 2025 GMT", "subject": "C=IN,ST=KA,L=BAN,O=CIT,OU=ADM,CN=A", "public_key_algorithm": "rsaEncryption", "public_key_size": 4096, "no_of_bound_entities": 0, "partition_name": "", "display_name": "10.106.186.141", "hostname": "athulsadc", "key_name": "", "subjaltname": "", "managed_by": "", "certificate_dn": "", "linkcertkeyname": "", "table_name": "ns_ssl_certkey"}console_ns_ssl_certkey WAF [{"ip_address": "10.106.185.156", "ctnsappname": "vserver_1", "severity": 2, "violation_type": 19, "violation_type_desc": "Start URL", "block_flags": 1, "transformed_flags": 0, "not_blocked_flags": 0, "country_code": "-NA-", "region_code": "-NA-", "city": "-NA-", "latitude": 200.0, "longitude": 200.0, "signature_category": "", "attack_category": 2, "attack_category_desc": "Broken Authentication and Session Management", "total_attacks": 1, "rpt_sample_time": 1704783773, "source_ip_address": 174766492, "attack_time": 1704783538, "profile_name": "appfw_cs_lb_prof", "session_id": "", "http_req_url": "https://10.106.192.54/csrf_ffc/ffc.html?field10=asfasd", "violation_name": "-NA-", "violation_value": "-NA-", "violation_location": 4, "violation_threat_index": 5, "app_threat_index": 5, "http_method": 0, "violation_action": 3, "violation_action_desc": "Blocked", "severity_type": 2, "severity_type_desc": "Medium", "iprep_score": 0, "iprep_category": 0, "counter_value": 0, "appname": "vserver_1_10.106.185.156_lb", "violation_category": 12, "violation_category_desc": "Start URL", "source_ipv6_address": "", "true_client_ip": "\\N", "backend_vserver": "", "backend_appname": "", "transactionId": "0", "table_name": "af_threat_exporter_data_l2"}]console_af_threat_exporter_data_l2 Bot {"ip_address": "10.106.186.122", "ctnsappname": "secure_gateway", "bot_type": "2", "bot_type_desc": "Bad", "action_type": "6", "action_type_desc": "Log", "country_code": "0.0", "region_code": "0.0", "city": "0.0", "bot_severity": "0", "bot_severity_desc": "Critical", "latitude": "0", "longitude": "0", "bot_detection_mechanism": "6", "bot_detection_mechanism_desc": "BlackList", "bot_category": "0", "bot_category_desc": "Uncategorized", "source_ip_address": "174758625", "bot_signature_category": "Custom Policy Expression", "appname": "secure_gateway_10.106.186.122_lb", "backend_vserver": "", "backend_appname": "", "total_attacks": "2", "rpt_sample_time": "1718783216", "table_name": "af_bot_attack_details_l2"}console_af_bot_attack_details_l2 Gateway Insight (1) {"adc_ip_address": "10.106.186.141", "auth_server": "", "client_ip": 174766732, "epa_method_type": 0, "error_count": 14, "error_details": "Invalid credentials passed", "error_type": 1, "gateway_name": "vpn_vserver_142_6", "req_url": "", "resource": "", "rpt_sample_time": 1713505215, "sso_method_type": 0, "sta_ip": "", "table_name": "af_vpn_error_details", "username": "John"}console_af_vpn_error_details Gateway Insight (2) {"adc_ip_address": "10.102.71.166", "display_name": "10.102.71.166", "gateway_name": "firsthop", "ip_address": "10.102.71.168", "rpt_sample_time": "1718812158", "state": "Up", "table_name": "ns_vpnvserver"}console_ns_vpnvserver Gateway Insight (3) {"adc_ip_address": "10.106.186.141", "gateway_name": "vpn_vserver_141_7", "rpt_sample_time": 1702011308, "sessions": 1, "table_name": "af_vpn_session_details", "users": 1}console_af_vpn_session_details Gateway Insight (4) {"active_sessions": 59, "active_users": 1, "adc_ip_address": "10.106.186.136", "gateway_name": "vpnathul2", "rpt_sample_time": 1698919848, "table_name": "af_vpn_active_session_1"}console_af_vpn_active_session_1 Gateway Insight (5) {"adc_ip_address": "10.106.186.136", "entity_type": 3, "gateway_name": "vpnathul2", "hits": 3, "rpt_sample_time": 1698052438, "table_name": "af_vpn_error_reports"}console_af_vpn_error_reports Events {"rpt_sample_time": -1, "category": "HealthMonitoring", "entity": "10.106.186.148:HealthMonitoring:System Disk Usage", "counter_threshold_value": "", "id": "0f2607cf-f97d-4f71-9162-11e580262e93", "timestamp": 1712927472, "message": "Disk Usage High: 63.24%", "severity": "Critical", "user_name": "", "device_entity_type": "", "device_type": "", "counter_actual_value": "", "cmd_auth_status": "", "source": "10.106.186.148", "history": "Update Time= Fri, 12 Apr 2024 06:32:49 UTC ,Previous Severity= Critical ,New Severity= Critical, Source= 10.106.186.148\nUpdate Time= Fri, 12 Apr 2024 06:27:46 UTC ,Previous Severity= Critical ,New Severity= Critical, Source= 10.106.186.148\nUpdate Time= Fri, 12 Apr 2024 06:22:44 UTC ,Previous Severity= Critical ,New Severity= Critical, Source= 10.106.186.148\nUpdate Time= Fri, 12 Apr 2024 06:17:41 UTC ,Previous Severity= Critical ,New Severity= Critical, Source= 10.106.186.148\nUpdate Time= Fri, 12 Apr 2024 06:12:38 UTC ,Previous Severity= Critical ,New Severity= Critical, Source= 10.106.186.148\nUpdate Time= Fri, 12 Apr 2024 06:07:36 U", "config_cmd": "", "failureobj": "System Disk Usage", "operation_type": "undefined", "device_entity_name": "", "cmd_exec_status": "", "device_family": "", "source_event_id": -1, "source_system_ip": "10.106.186.148", "trap_id": 35, "table_name": "event"}console_event Metrics {"memory_free": 28830060544.0, "disk_used": 81248694272.0, "disk_free": 29632114688.0, "node_type": "", "memory_total": 34355544064.0, "cpu_usage": 0.49, "disk_total": 120522616832.0, "disk_usage": 73.28, "node_id": "", "id": "1be15a09-d078-469c-868a-bfbfcffe5ef1", "disk_total_capacity": 0.0, "page_size": 4096.0, "memory_usage": 16.08, "table_name": "mps_health"}console_mps_health Audit logs {"system_gmt_time":1721868291, "source":"X.X.X.X", "severity":"INFO", "module":"DEVICECONFIG", "event_type":"CMD_EXECUTED", "message":"Sample Mesage", "instance_ip":"X.X.X.X", "app_name":""}console_syslog_messages After uploading the JSON, you can view the following details: Click Transformation editor, enter the following query that is applicable for the appropriate insight, and click Run to accept the data starting from the poll time in NetScaler Console.
-
SSL -
source | extend TimeGenerated = todatetime(poll_time) | project-rename sslvserver_id = id -
WAF and Bot -
source | extend TimeGenerated = todatetime(rpt_sample_time) -
Gateway Insight -
source | extend TimeGenerated = todatetime(rpt_sample_time)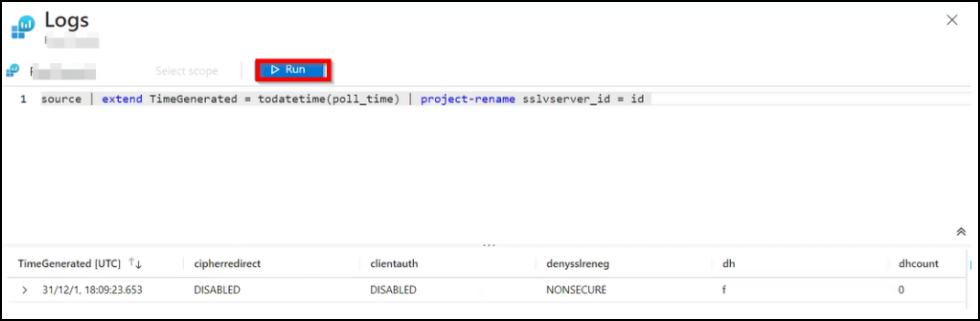
-
-
Click Next and click Create to complete.
-
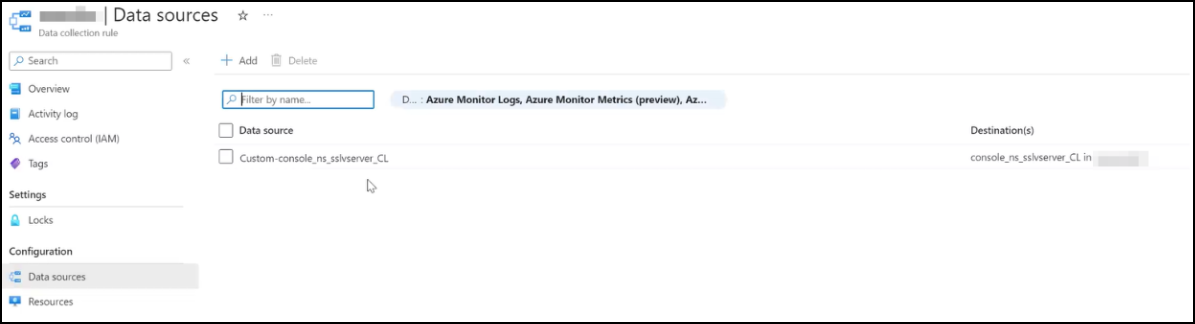
Navigate to Data collection rules, click the DCR that you have created.
-
Under Configuration, click Data sources to view the created table.
 The DCR (Data collection rule) requires access to the Monitoring Metrics Publisher role.
-
Navigate to your DCR that you can access from your Azure portal under Recents.
-
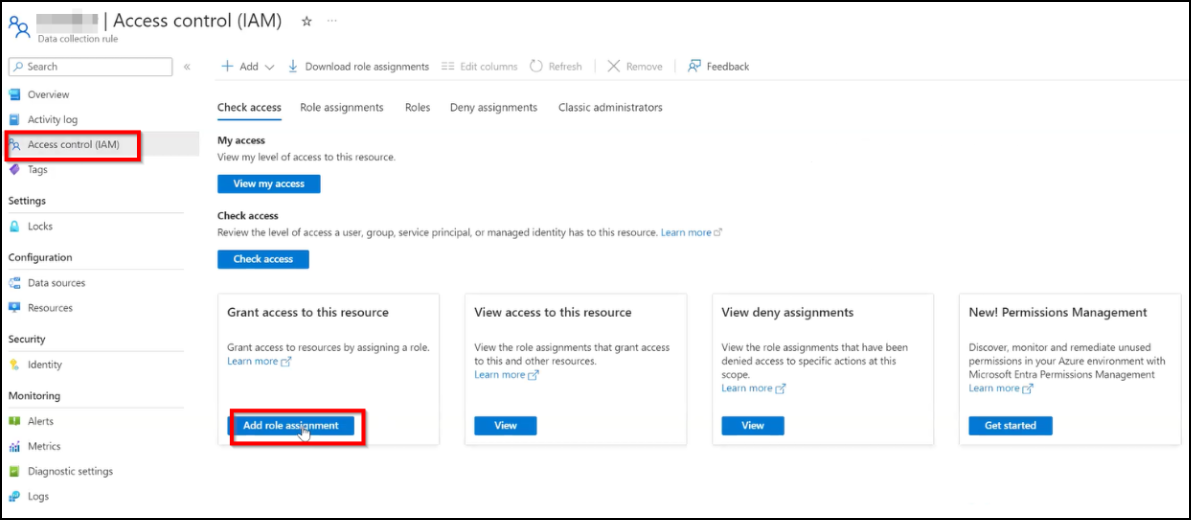
Click Access control (IAM) from your DCR page and click Add role assignment.
-
In the search bar, type the keyword monitor to select Monitoring Metrics Publisher and click Next.
-
In the Members tab, click Select Members and select the Entra app that you created.
-
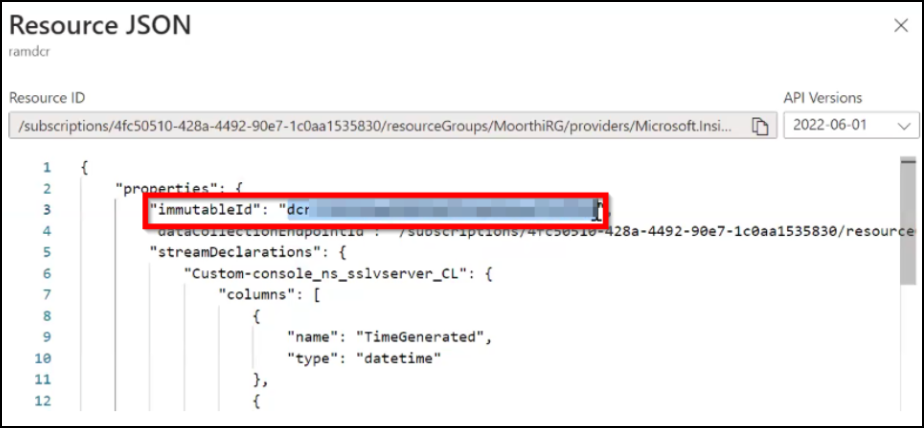
Click Review + assign.You must make a note of the Data collection rules ID. Navigate to the Data collection rules page, select your DCR, and click the JSON view to make a note of the ID.
-
Create a subscription in NetScaler Console
You now have everything ready. The final step is to configure NetScaler Console by creating a subscription and adding the required details. To create a subscription in NetScaler Console, you need the following details that you have noted:
-
Endpoint URL
-
Data collection rules ID
-
Tenant ID
-
Client ID
-
Client secret
-
Login to NetScaler Console.
-
Navigate to Settings > Observability Integration.
-
In the Integrations page, click Add.
-
In the Create Subscription page, specify the following details:
-
Specify a name of your choice in the Subscription Name field.
-
Select NetScaler Console as the Source and click Next.
-
Select Microsoft Sentinel and click Configure. In the Configure Endpoint page, enter all details, and click Submit.
-
Click Next.
-
-
Click Add Insights and in the Select Feature tab, depending upon the tables that you have added in Microsoft Azure, select the features that you want to export and click Add Selected, and click Next.
-
In the Select Instance tab, you can either choose Select All Instances or Custom select, and then click Next.
-
Select All Instances - Exports data to Microsoft Sentinel from all the NetScaler instances.
-
Custom select - Enables you to select the NetScaler instances from the list. If you select specific instances from the list, then the data is exported to Microsoft Sentinel only from the selected NetScaler instances.
-
-
Click Submit.
View logs in Microsoft Azure
After you configure everything, we recommend that you wait until 30 minutes to view details in Microsoft Azure.
-
In your Azure portal, navigate to your Log Analytics Workspace.
-
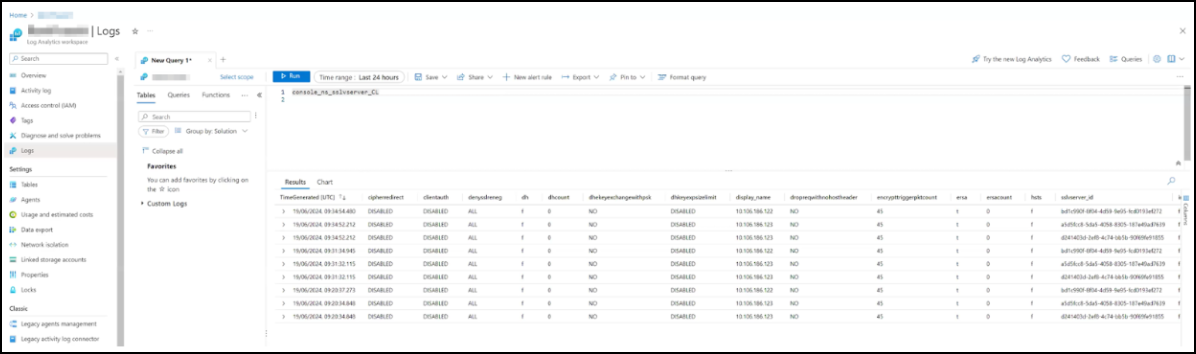
Click Logs, provide the table name, and click Run to view results.
You can also troubleshoot and use the logs to verify the configurations. For example, use the Poll Now option in NetScaler Console GUI for the configured insight and:
-
Login to your NetScaler Console using an SSH client.
-
Type shell to enter bash mode.
-
Use the following command to view logs:
tail -f /var/mps/log/nbs/nbs_api.log
The following examples help you analyze the possible errors for troubleshooting:
 This log indicates that you have provided an invalid Client ID for the Microsoft Sentinel subscription in NetScaler Console (Settings > Observability Integrations).Workaround: Ensure that you have copied the right Client ID and edit the subscription by providing the right Client ID. For more information, see Create a Microsoft Entra application.
 This log indicates that you have not configured the required ssl_certkey table in your Microsoft Azure.Workaround: Configure a table for ssl_certkey in Microsoft Azure. For more information, see Create tables to export data.