
Active Services
This issue detects when the % of active services bound to the virtual server is lesser than the configured threshold value. Click the Active Services tab to view the issue details.
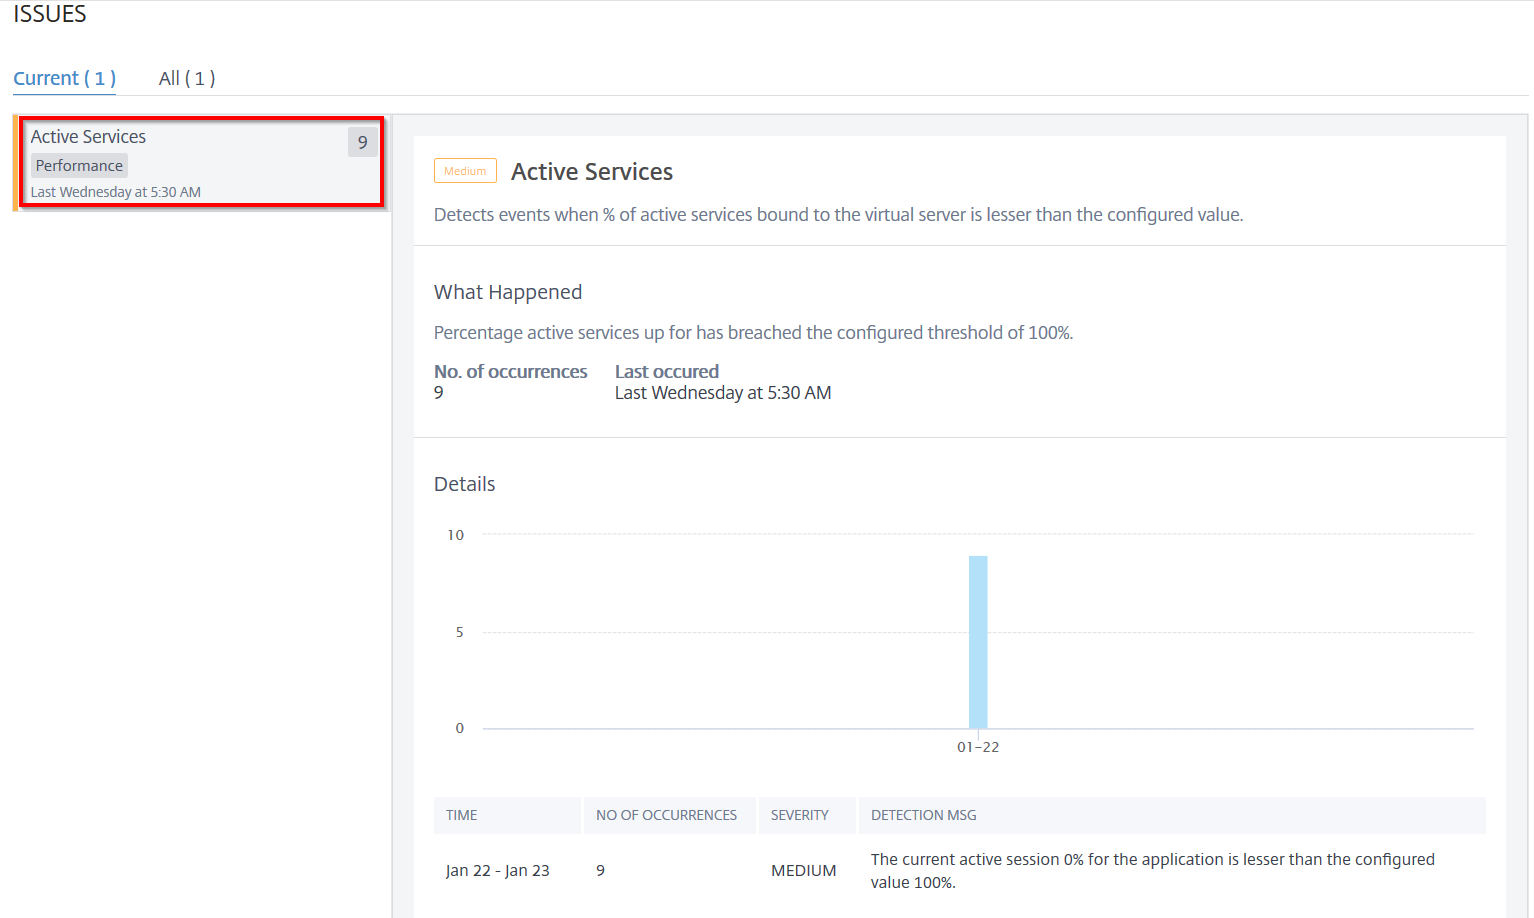
Under Details, you can view:
-
The graph indicating the total events for the selected time duration. Click to apply filter and view details
-
When the issue has occurred
-
The total occurrences for the selected time duration
-
The issue severity such as low, medium, and high
-
The detection message indicating the % of active service sessions and the configured threshold value
Related information