
Instance View Reports and Metrics
The reports and metrics in the instance view are focused on the NetScaler instances.
To navigate to the instance view:
-
Navigate to Gateway > HDX™ Insight > Instances.
Related information
Instance summary view
This view is called the summary view as it shows the reports for all the NetScaler instances that are added to NetScaler Console.
All the metrics/reports, unless explicitly mentioned will have the values corresponding to them for the selected time period.
Instance bar graph
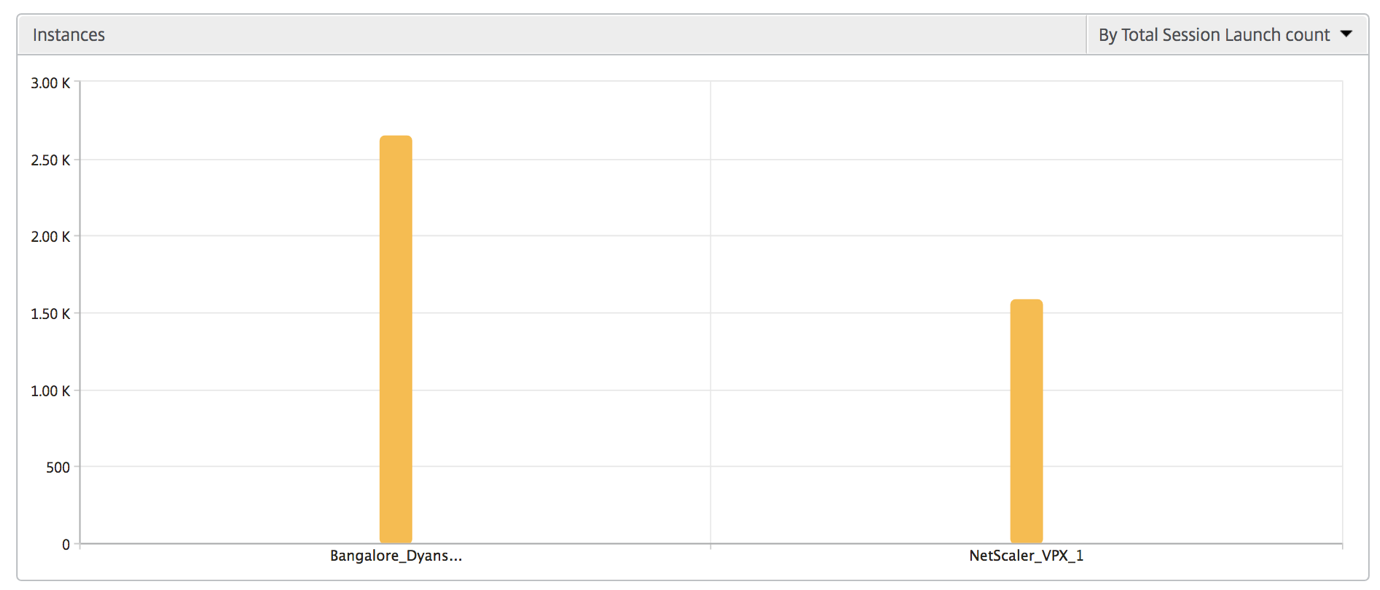
This graph displays the instance vs the Total Session Launch count and Total Apps which can be selected from the list on the top right on the graph canvas.
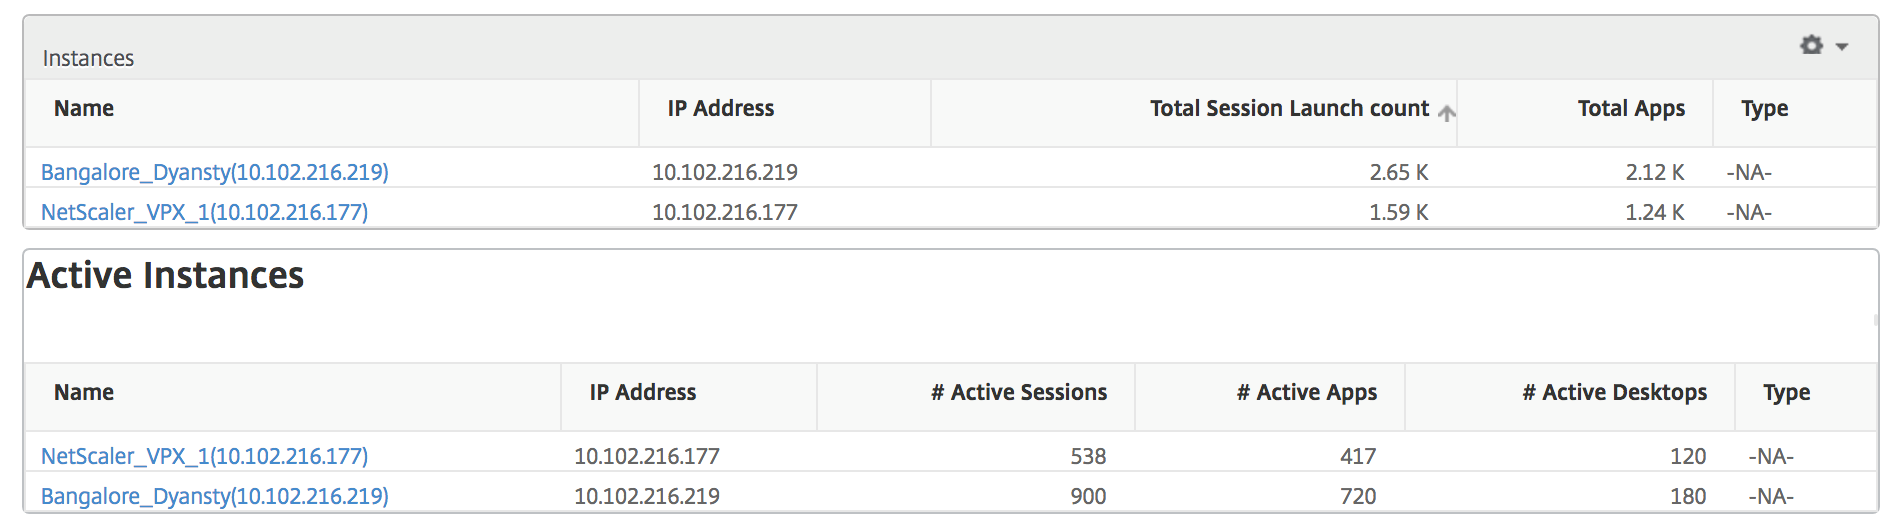
Instance/Active instances summary report
| Metrics | Description |
|---|---|
| Name | Host name of the NetScaler instance. |
| IP Address | NetScaler IP address. |
| Total Session Launch count | Total number of unique user sessions created during a given time interval. |
| Total Apps | Total number of unique applications launched during a given time interval. |
| Type | N/A |
Threshold report
Threshold report represents the count of thresholds breached where the entity is selected as Instance in the selected period. For more information, see how to create thresholds and alerts.
Skipped flows
A skipped flow is a record which skipped parsing ICA connection. This can occur due to multiple reasons like using unsupported Citrix Virtual Apps and Desktops versions, unsupported version of workspace or workspace type, and so on. This table shows the IP address and the skipped flow count. These workspaces may not be part of whitelisted workspaces. Hence these sessions are skipped from monitoring.
See Error\! Hyperlink reference not valid for more details on issues related to ICA parsing.

World view
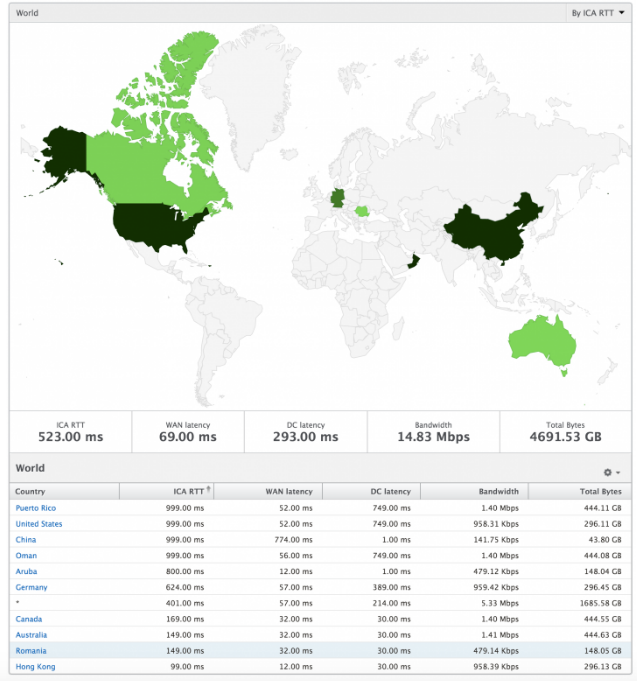
The World Map view in HDX insight allows the administrators to view the historical and active users details from a geographical point of view. The administrators can have a World view of the system, drill-down to a particular country and further into cities as well by clicking the region. The administrators can further drill down to view information by city and state. From NetScaler version 12.0 and later, you can drill down to users connected from a Geo location.
The following details can be viewed on the World Map in HDX insight, and the density of each metric is displayed in the form of a heat map:
-
ICA® RTT
-
WAN Latency
-
DC Latency
-
Bandwidth
-
Total Bytes
Per instance view
Per instance view provides detailed end user experience reporting for a particular selected NetScaler instance.
To navigate to the instance view:
-
Navigate to Gateway > HDX Insight > Instances.
-
Select a particular instance from the Instance Summary Report.
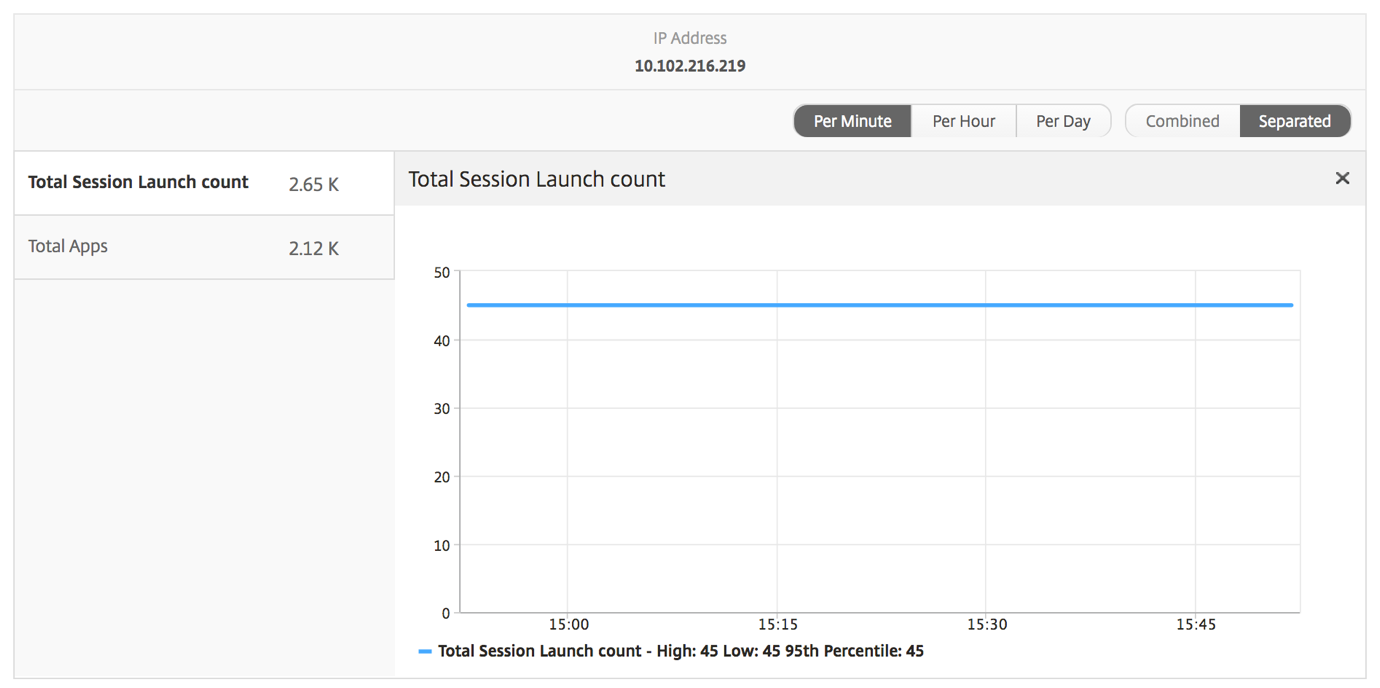
Line chart
| Metrics | Description |
|---|---|
| IP Address | This represents the NetScaler IP address of the selected instance. |
| Total session launch count | Total number of active Citrix Virtual App sessions during the given time interval. |
| Total Apps | Total number of unique applications launched during a given time interval. |
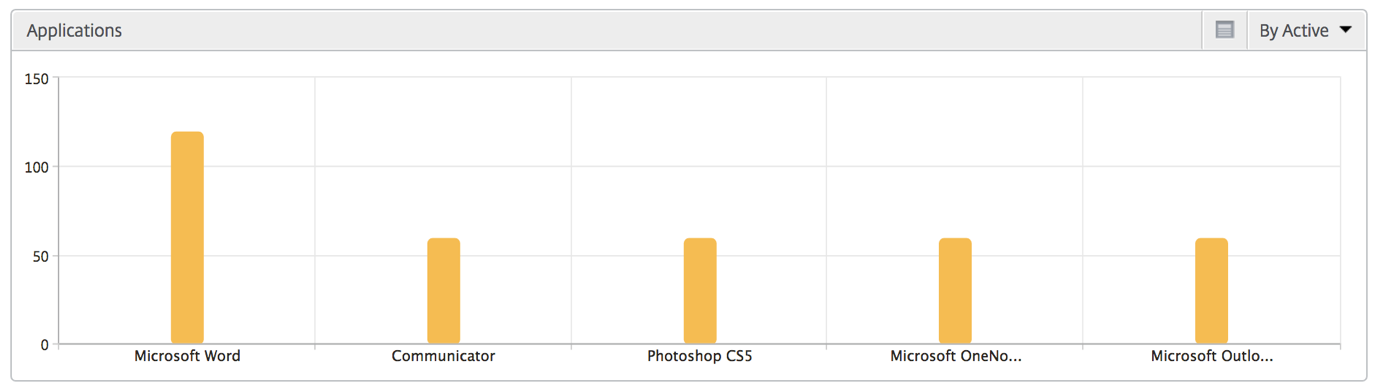
Applications bar graph
Displays top 5 applications based on the following criteria- by Active apps, total session launch count, total app launch count, or launch duration.
Users bar graph
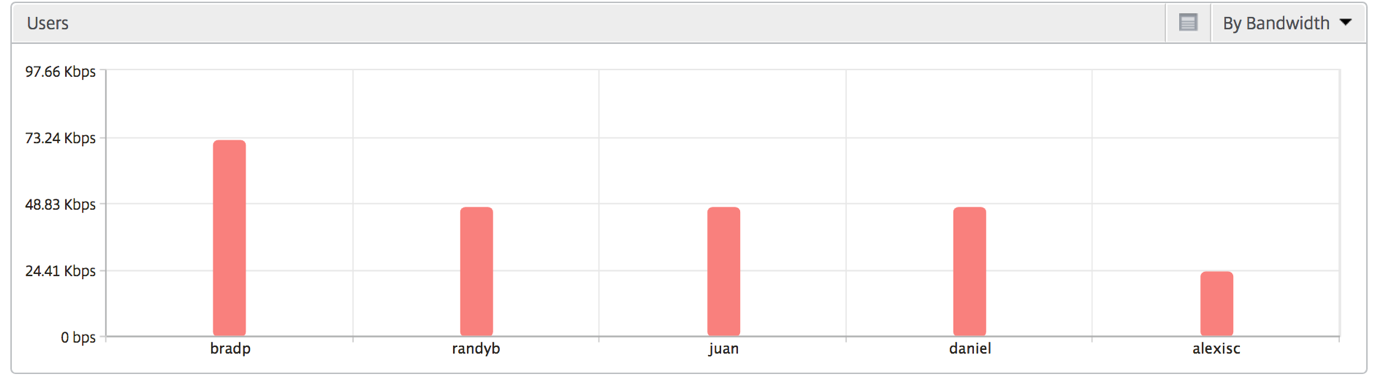
The Users bar graph displays top 5 users based on the following criteria
-
Bandwidth
-
WAN Latency
-
DC Latency
-
ICA RTT
Desktop users report
This table gives the insight into the Citrix Virtual Desktop sessions for a particular user. These metrics can be sorted by Desktop Launch Count and Bandwidth.
| Metrics | Description |
|---|---|
| Name | Name of the Citrix Virtual Desktop. |
| Desktop Launch Count | Number of times the desktop has launched. |
| Bandwidth | Total bytes per second taken for end to end communication during the selected time interval. |
| DC latency | Latency caused by the server side of the network. That is, from NetScaler to back end servers. |
| WAN latency | Latency caused by the client side of the network. That is, from NetScaler to end user. |
| ICA RTT | ICA RTT is the screen lag that the user experiences while interacting with an application or desktop hosted on Citrix Virtual App or Desktop respectively. |

World view
The World Map view in HDX insight allows the administrators to view the historical and active users details from a geographical point of view. The administrators can have a World view of the system, drill down to a particular country and further into cities as well by clicking the region. The administrators can further drill down to view information by city and state. From NetScaler Console version 12.0 and later, you can drill down to users connected from a Geo location.
The following details can be viewed on the World Map in HDX insight, and the density of each metric is displayed in the form of a heat map:
-
ICA RTT
-
WAN Latency
-
DC Latency
-
Bandwidth
-
Total Bytes