
Troubleshoot App Dashboard
After you add an application in the App Dashboard, the dashboard immediately displays the app basic configuration details. The application analytics details such as app score, key metrics, and issues start to populate within a few minutes (approximately 10 to 15 minutes). For more information, see Applications.
You must ensure that there is no issue with metrics data flow (AppFlow collector or Analytics profile) from the NetScaler instance. You can get more information on AppFlow collector and analytics profile in this document.
This document describes the troubleshooting steps that you need to perform when:
-
You click an application, the analytics for the selected application do not display the required data even after the mentioned duration (10–15 minutes).
-
The CS or LB application is always indicating Gray color (Not Applicable status) in App Dashboard.
Note
The troubleshooting procedures mentioned in this document are only applicable to Content Switching and Load Balancing virtual servers.
Related information
Troubleshooting scenario
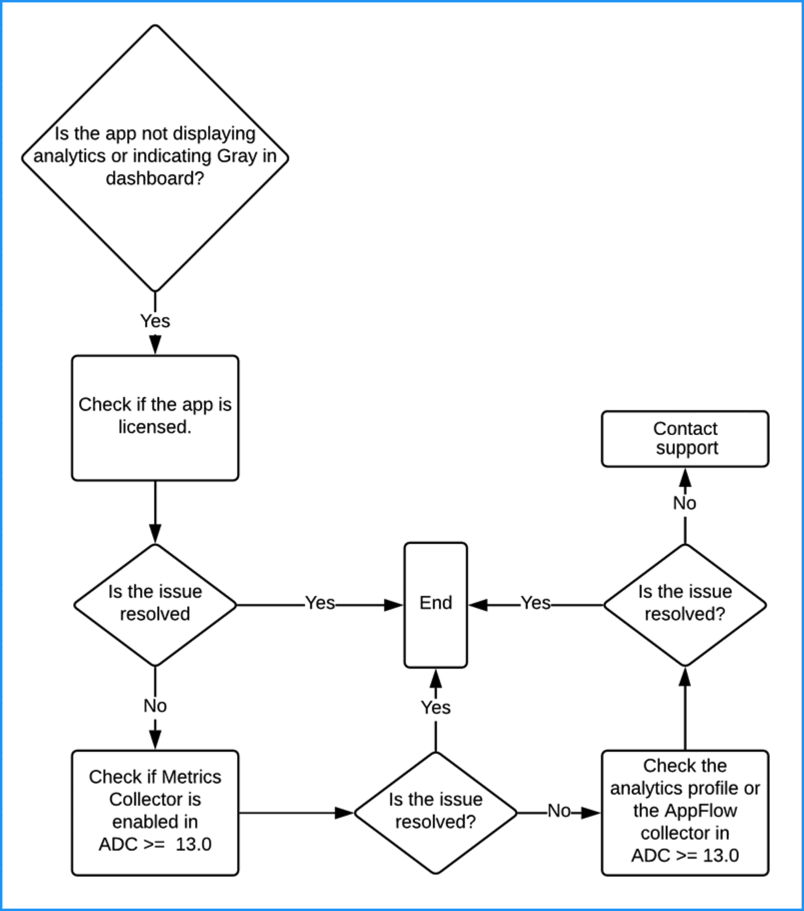
Application is licensed
You must ensure if the application is licensed. Navigate to Settings > Licensing & Analytics Configuration and verify if the application is licensed under Virtual Server License Summary. If the application is not licensed, see the following:
-
ADM service - Manage licensing and enable analytics on virtual servers.
-
ADM on-prem – Manage licensing and enable analytics on virtual servers.
Metrics collector is enabled
You must ensure if Metrics Collector is enabled in the NetScaler instance.
For NetScaler version 13.0 or later, Metrics Collector is enabled by default, after the ADC instance is successfully added in ADM. To ensure if metrics collector is enabled:
-
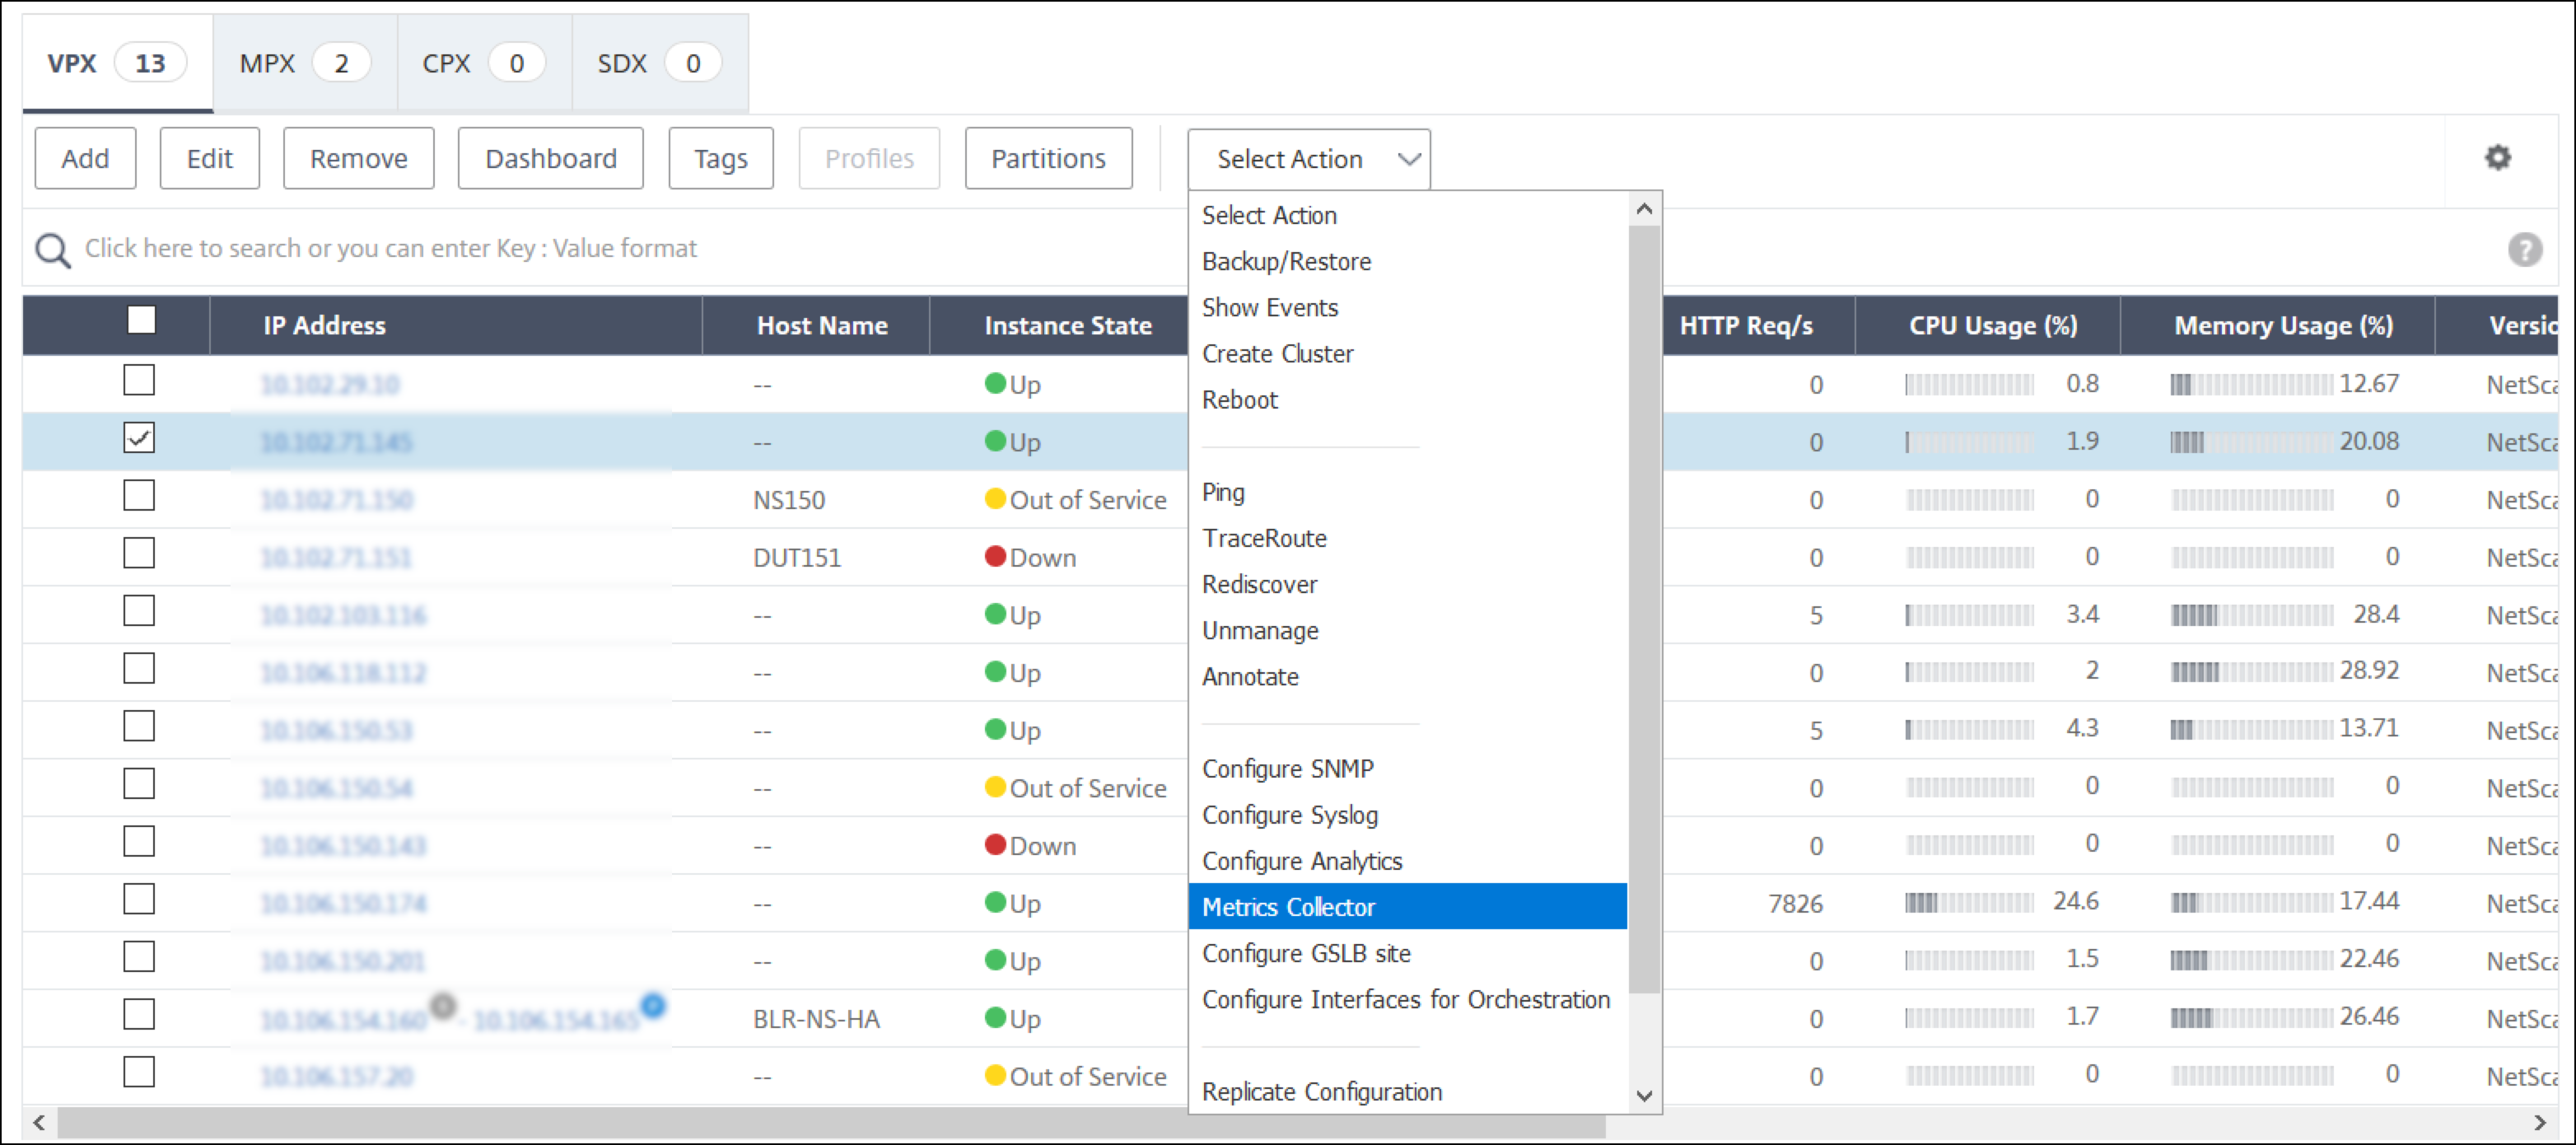
Navigate to Infrastructure > Instances. Under Instances, select the type of instance (for example, NetScaler VPX).
-
Select the NetScaler instance.
-
From the Select Action list, select Metrics Collector.
-
-
On the Configure Metrics Collector settings page, ensure if Enable option is selected. If not, select the Enable option and click OK.
After you enable metrics collector and if you are still not able to view the data, validate:
-
The AppFlow collector in NetScaler instance version 13.0 earlier than 47.x build.
-
The analytics profile in NetScaler instance build 47.x or later.
NetScaler instance earlier builds
In NetScaler:
-
Run the following command to ensure if the collector is UP and running at Port 5563:
sh appflow collector af_collector_rest_<adm_receiver_ip>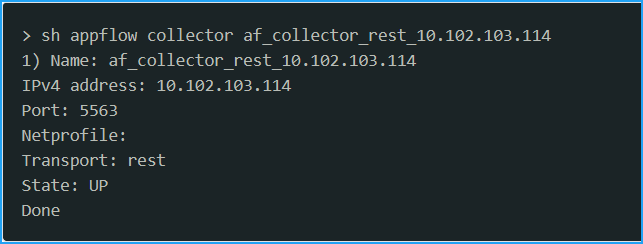
-
If no collector is available, do an instance manual polling in NetScaler® ADM.
-
Navigate to Infrastructure > Network Function > Poll Now
-
Select the instance and click Start Polling.
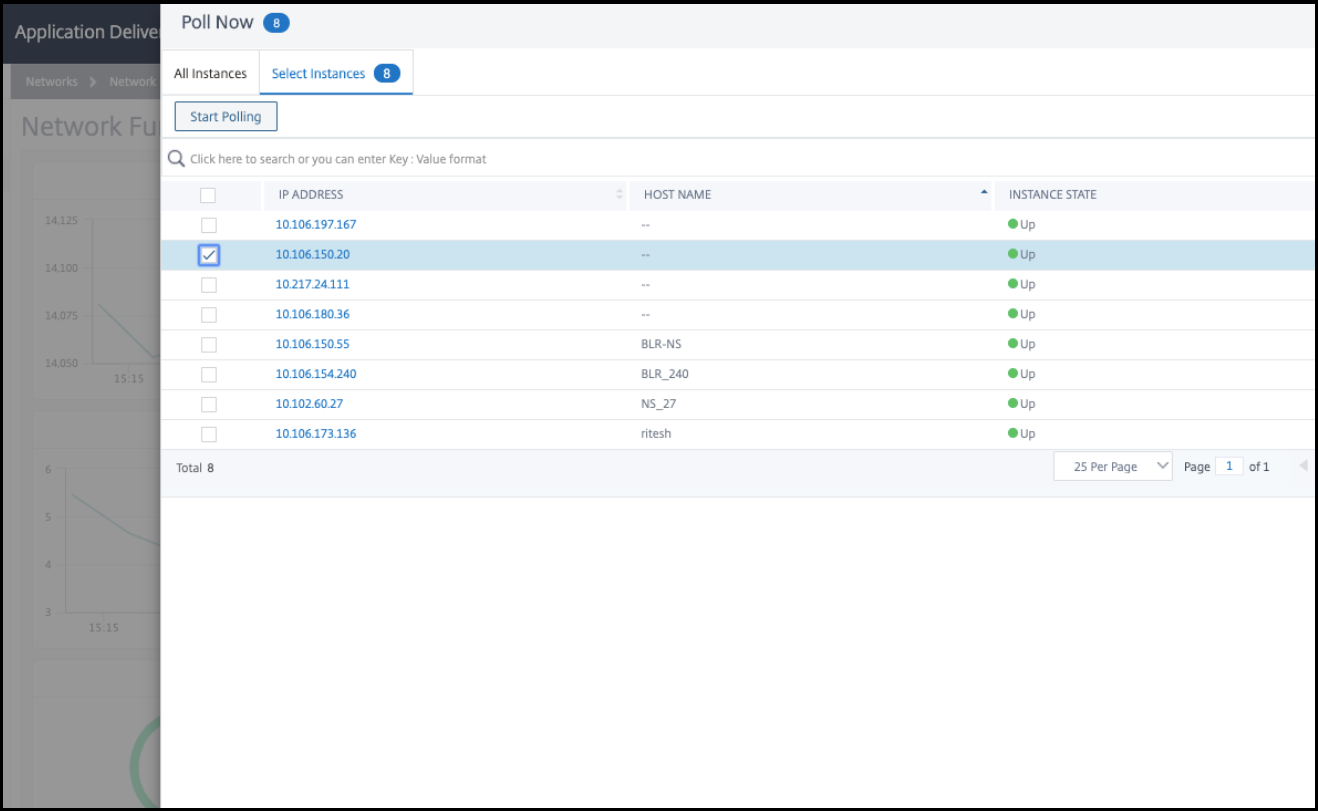 If polling fails, remove the ADC instance from ADM and then add the ADC instance again. When you add the ADC instance, the collector gets added on ADC.
-
If the collector indicates Down status:
-
Ensure if SNIP is configured.
 If SNIP is not configured, you must configure SNIP. For more information, see Configuring SNIP.
 -
Ensure that if ADC instance is reachable to ADM.You can validate by doing a ping test. Run
ping -S <SNIP> <adm_receiver_ip>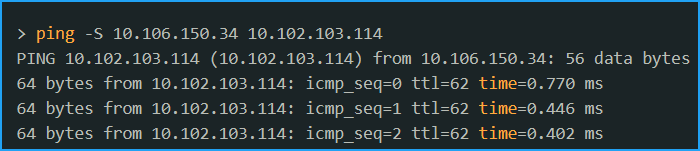
NetScaler instance later builds
In NetScaler ADM, ensure that the metrics collector service is available:
-
Navigate to Infrastructure > Network Function > Load Balancing > Services.
-
On the search bar, filter by Instance: (IP address) and Name: ADM.
-
Ensure if
adm_metric_collector_svc_<adm_receiver ip>is available. The IP address can be either the ADM management IP or the agent IP.Ensure that this service is in UP status and running at Port 5563.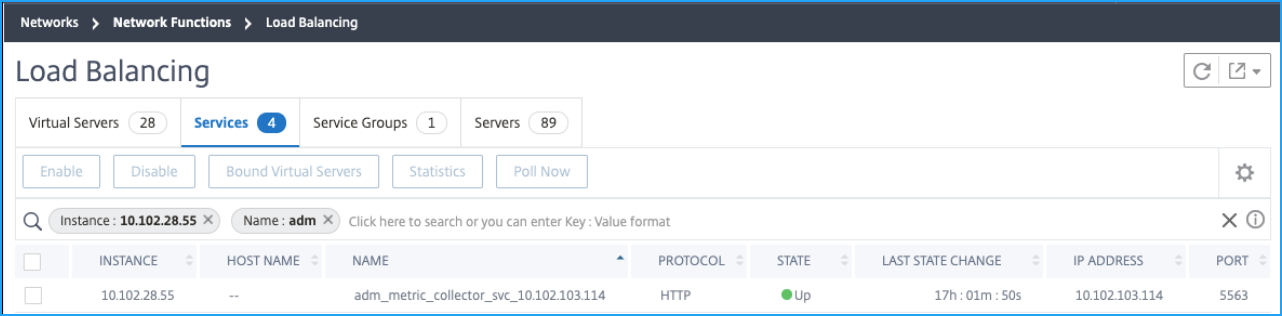
If you still cannot view the data, ensure that the collector service is bound to time series analytics profile in NetScaler.
-
Log on to NetScaler
-
Run the following command:
sh analytics profile ns_analytics_time_series_profile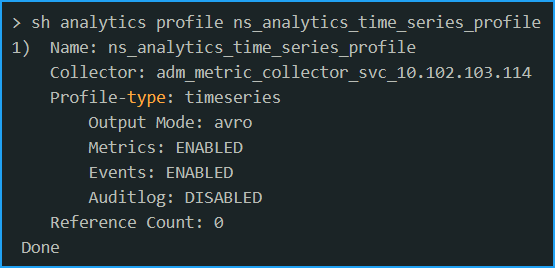
If the collector indicates Down status:
-
Ensure if SNIP is configured.
If SNIP is not configured, you must configure SNIP. For more information, see Configuring SNIP.
-
Ensure that if ADC instance is reachable to ADM.You can validate by doing a ping test. Run
ping -S <SNIP> <adm_receiver_ip> -
Ensure that the traffic connectivity through telnet is able to connect the service.
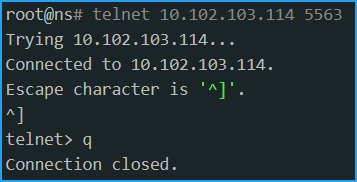 If telnet is able to connect the service, then a firewall exists and is blocking the metric data flow. You must resolve the firewall block issue.
If no collector service is bound to time series analytics profile in NetScaler, the Collector is displayed as blank.
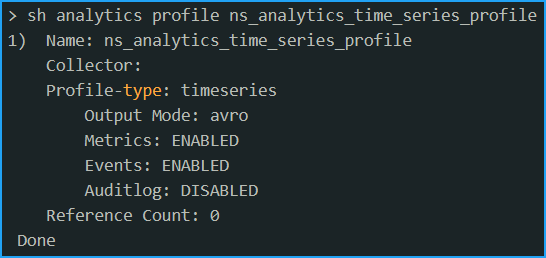
You must do an instance manual polling in NetScaler ADM.
-
Navigate to Infrastructure > Network Function > Poll Now
-
Select the instance and click Start Polling.
If polling fails, add the collector service directly at NetScaler instance using the following commands:
add service adm_metric_collector_svc_<adm_receiver_ip> <adm_receiver_ip> HTTP 5563unset analyticsprofile ns_analytics_time_series_profile -collectorsset analytics profile ns_analytics_time_series_profile -collectors adm_metric_collector_svc_<adm_receiver_ip> -metrics enabled -events enabledThe analytics time series profile is updated.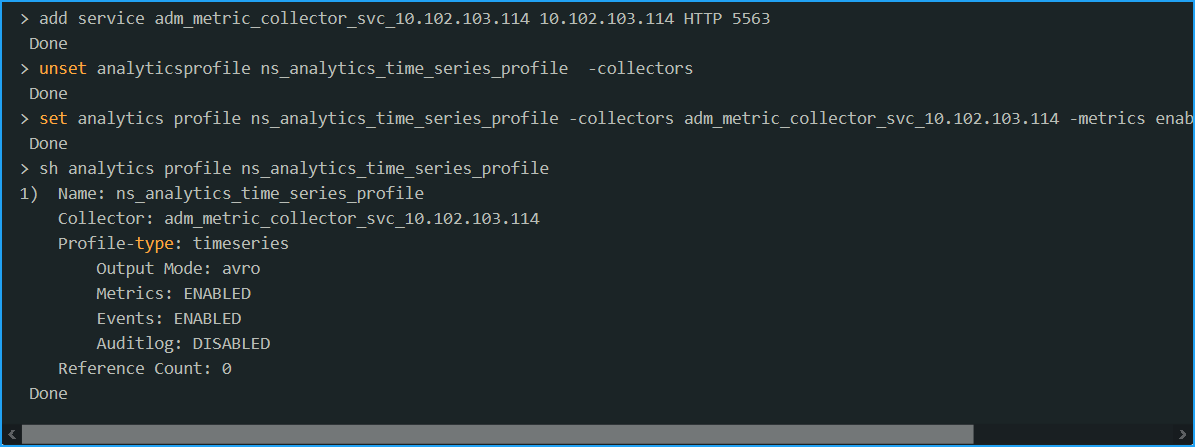
If the issue still persists even after performing all the mentioned troubleshooting steps, contact NetScaler support.