
Application usage analytics
Application owners must have the ability to evaluate and visualize the complete application from the perspectives of performance and usage.
The improvised App Dashboard enables you to view all the application performances and usage metrics together. When you click an application, alongside the existing application performance metrics, the Web Insight tab displays the metrics details that help you:
-
Understand your application usage.
-
Correlate any performance deviations with the usage metrics.
Note
For each metric, you can view options that indicate maximum value and total value. For example:
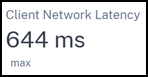 - The maximum client network latency for the selected duration. Consider that you have the network latency for client 1 = 644 ms, client 2 = 15 ms, and client 3 = 3 ms. In this scenario, the Client Network Latency displays 644 ms.
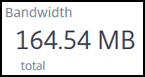 - The total bandwidth consumed across all available clients/servers for the selected duration. Consider that you have the bandwidth consumption for client 1 = 79.54 MB, Client 2 = 45 MB, Client 3 = 40 MB. In this scenario, the Bandwidth displays (79.54 MB + 45 MB + 40 MB) = 164.54 MB.
The following are the Web Insight metrics you can view from the Usage tab:
-
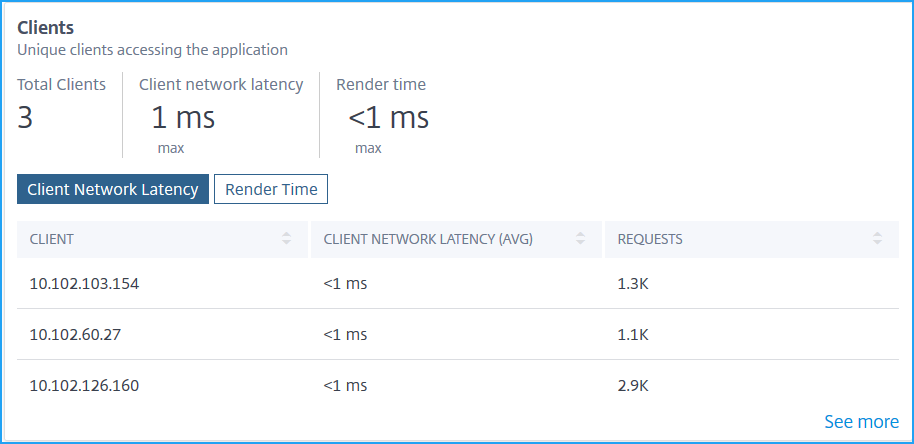
Clients – Displays the insights for clients accessing the application:
-
Total Clients – Displays the total clients accessing the application.
-
Client Network Latency – Displays the network latency from client to NetScaler. Click the Client Network Latency tab to view:
-
Client – The client IP address.
-
Client Network Latency (avg) – The average network latency from the client.
-
Client Network Latency (max) – The maximum network latency from the client.
-
Requests – The total requests from the client.
-
-
Render Time – Displays the time taken to render the server response. Click the Render Time tab to view:
-
Client – The client IP address.
-
Render Time (avg) – The average render time from the client.
-
Requests – The total requests from the client.
-
-
-
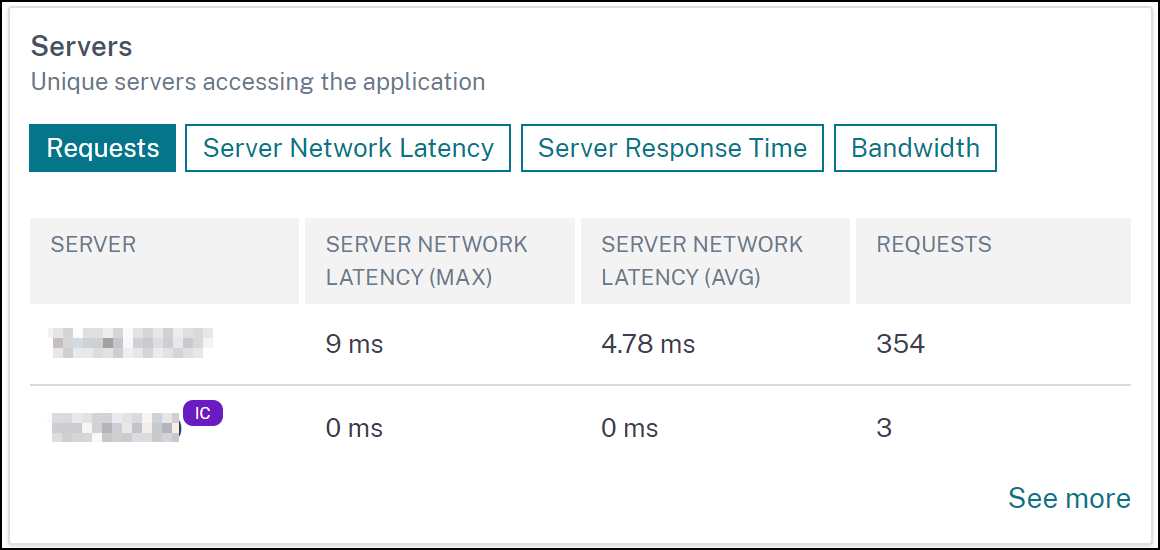
Servers – Displays the insights for servers accessing the application:NoteFor integrated cache requests, you can view the NetScaler virtual server IP address with an IC notification. For more information, see Integrated cache requests.
-
Total Servers – Displays the total servers accessing the application.
-
Server Network Latency – Displays the network latency from the server to NetScaler. Click the Server Network Latency tab to view:
-
Server – The server IP address.
-
Server Network Latency (avg) – The average network latency from the server.
-
Server Network Latency (max) – The maximum network latency from the server.
-
Requests – The total requests from the server.
-
-
Server Response Time – Displays the time taken for the server to respond to requests. Click the Server Response Time tab to view:
-
Server – The server IP address.
-
Server Response Time (avg) – The average response time from the server.
-
Server Response Time (max) – The maximum response time from the server.
-
Requests – The total requests from the server.
-
-
Bandwidth – Displays the total bandwidth consumed by the servers. Click the Bandwidth tab to view:
-
Server – The server IP address.
-
Bandwidth – The total bandwidth consumed from the server.
-
Requests – The total requests from the server.
-
-
-
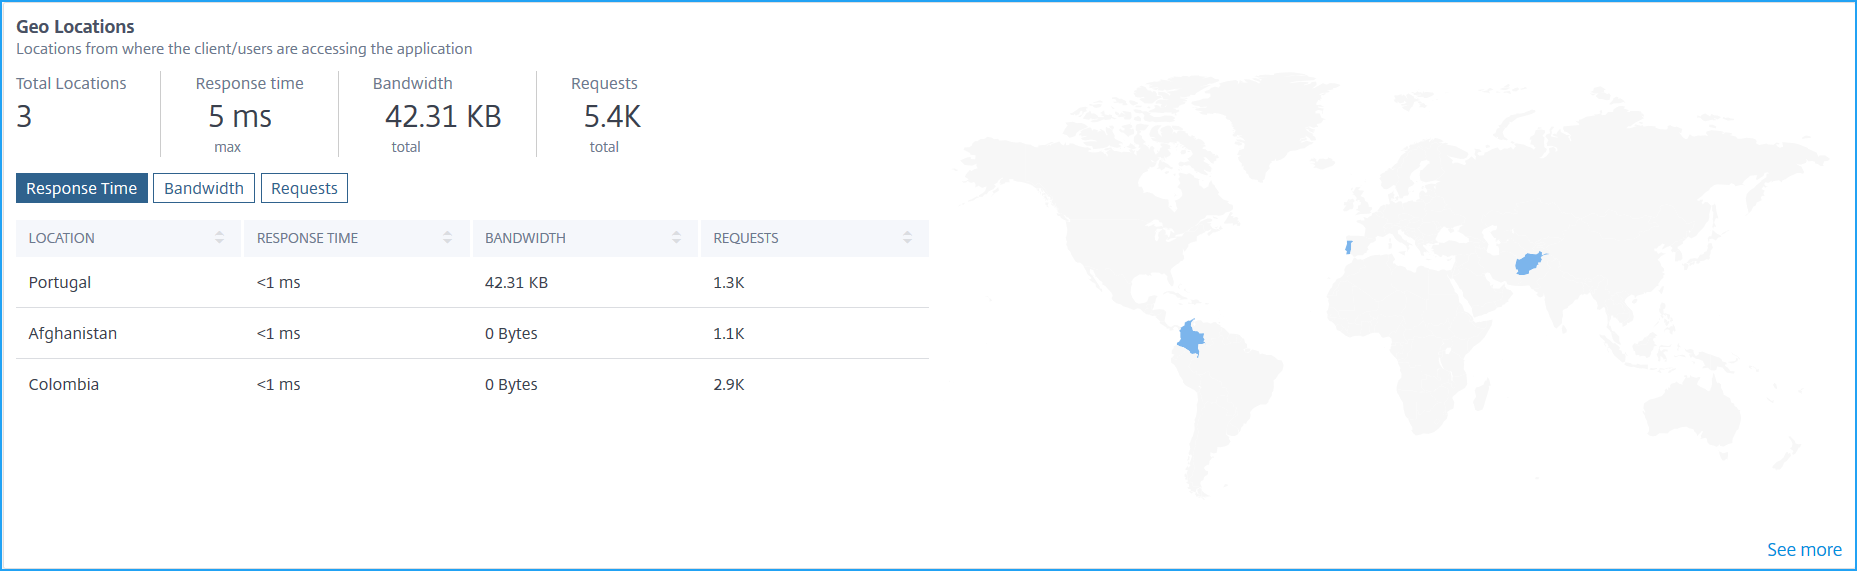
Geo Locations – Displays the insights for clients accessing the application from a particular location:
-
Total locations – Displays the total client locations accessing the application.
-
Response Time – Displays the response time from the client location.
-
Bandwidth – Displays the total bandwidth consumed by clients across all locations.
-
Requests – Displays the total requests from all client locations.Click each tab to view:
-
Location – The location name.
-
Response Time – The average response time from the client location.
-
Bandwidth – The bandwidth consumed from the client location.
-
Requests – The total requests from the client location.
-
-
-
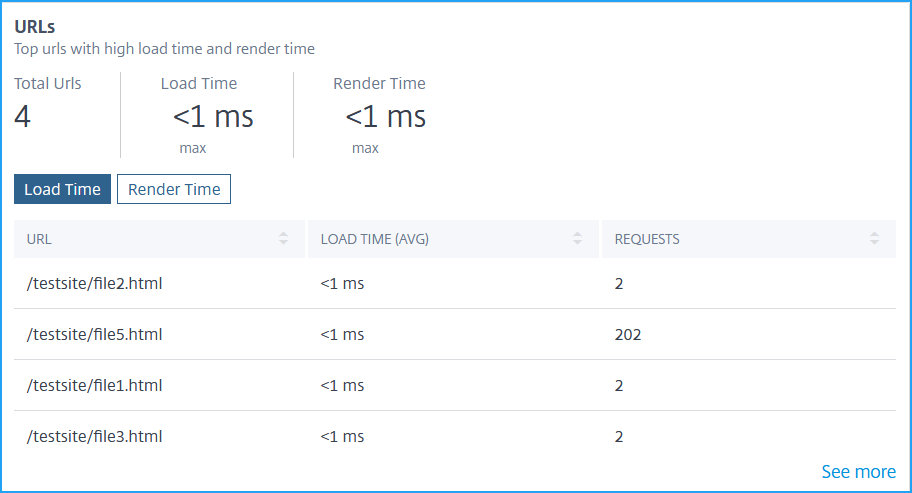
URLs – Displays the insights for URLs with high load and render time:
-
Total URLs – Displays the total URLs.
-
Load Time – Displays the time taken for the URL to load. Click the Load Time tab to view:
-
URL – The URL name.
-
Load Time (avg) – The average time taken for the URL to load.
-
Requests – The total requests from the URL.
-
-
Render Time – Displays the time taken for the URL to render and display. Click the Render Time tab to view:
-
URL – The URL name.
-
Render Time (avg) – The average time taken for the URL to render.
-
Requests – The total requests from the URL.
-
-
-
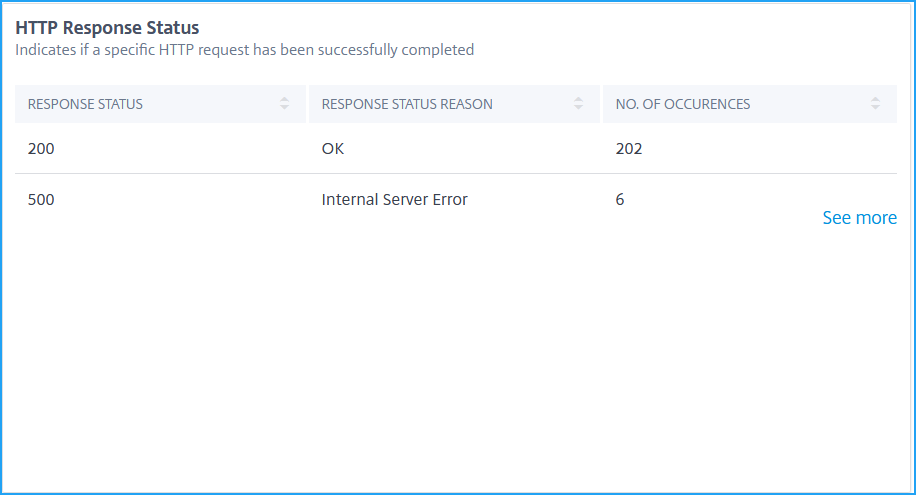
HTTP Response Status – Displays the insights for a specific completed HTTP request.
-
Response Status – Displays the response code such as 2xx, 4xx, 5xx, and so on.
-
Response Status Reason – Displays the response reason such as internal server error, Not found, and so on.
-
No of Occurrences – Displays the total number of occurrences.
-
-
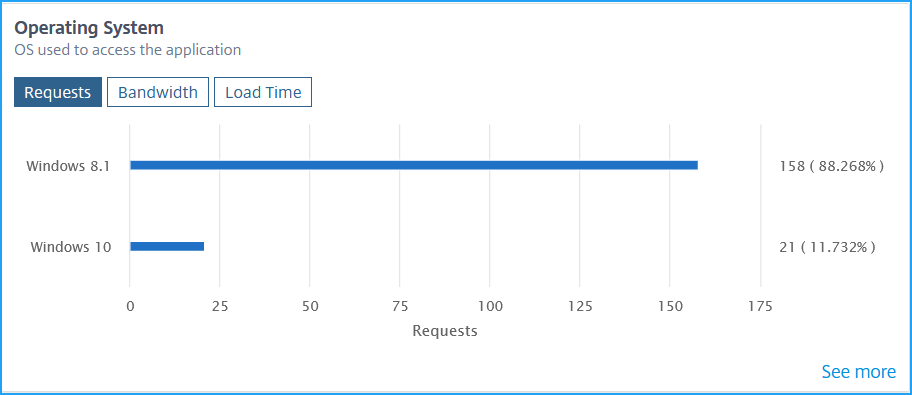
Operating system – Displays the insights for the OS accessing the application.
-
Requests – Displays the total requests from each operating system.
-
Bandwidth – Displays the total bandwidth consumed by each operating system.
-
Load Time – Displays the total time taken from each operating system to load from the server.
-
-
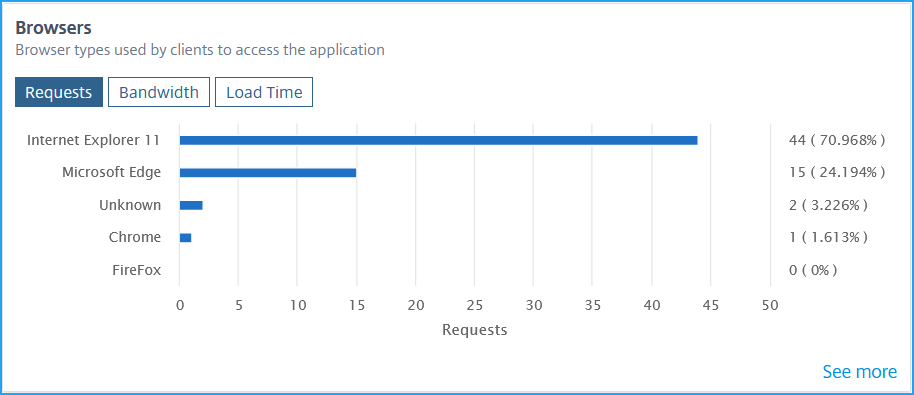
Browsers – Displays the insights for the browser types used by the clients to access the application.
-
Requests – Displays the total requests from each browser.
-
Bandwidth – Displays the total bandwidth consumed by each browser.
-
Load Time – Displays the total time taken for a browser to load from the server.
-
-
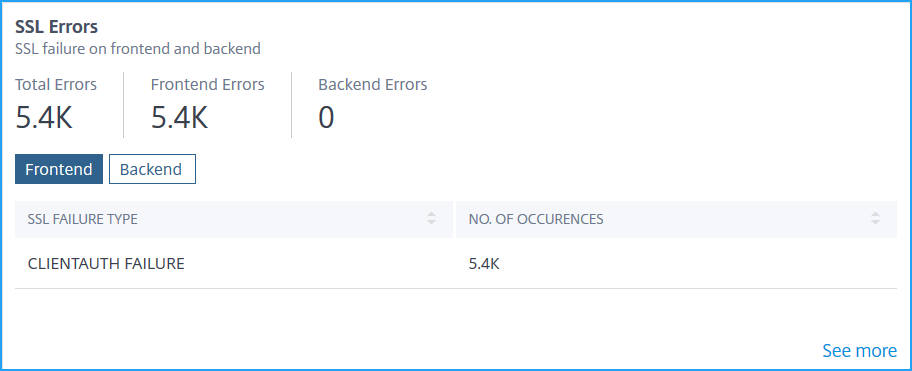
SSL Errors – Displays the insights for the SSL errors from front-end server and back-end server.
-
Total Errors – Displays the total SSL error occurrences.
-
Frontend – Displays the total SSL errors from the front-end server. Click the Frontend tab to view the SSL error type and total occurrences.
-
Backend – Displays the total SSL errors from the back-end server. Click the Backend tab to view the SSL error type and total occurrences.
-
-
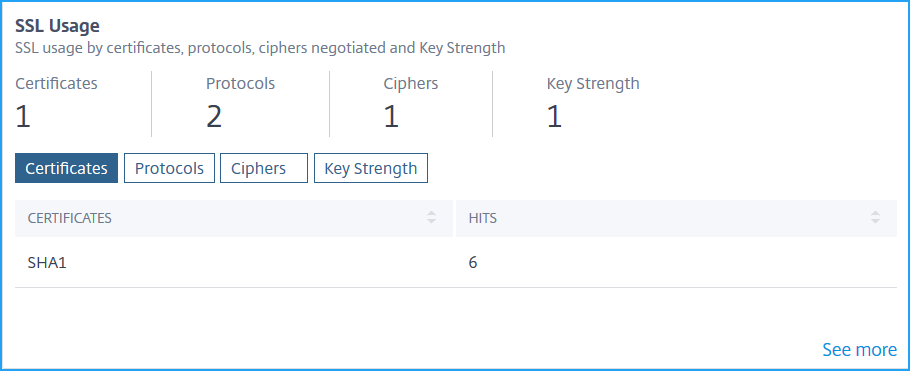
SSL Usage – Displays the insights for the SSL usage such as SSL certificates, protocols, Ciphers, and Key Strength.
-
Certificates – Displays the total SSL certificates. Click the Certificates tab to view the certificate name and total hits.
-
Protocols – Displays the total SSL protocols. Click the Protocols tab to view details with SSL/TSL protocol and total hits.
-
Ciphers – Displays the total Ciphers. Click the Ciphers tab to view details for each cipher suite name and total hits.
-
Key Strength – Displays the total key strength used in SSL certificates. Click the Key Strength tab to view details for each key strength and total hits.
-
View metrics details in graphical format
For each metric, you can view more details in a graphical format by clicking See more option. Click > to view details in a graphical format.
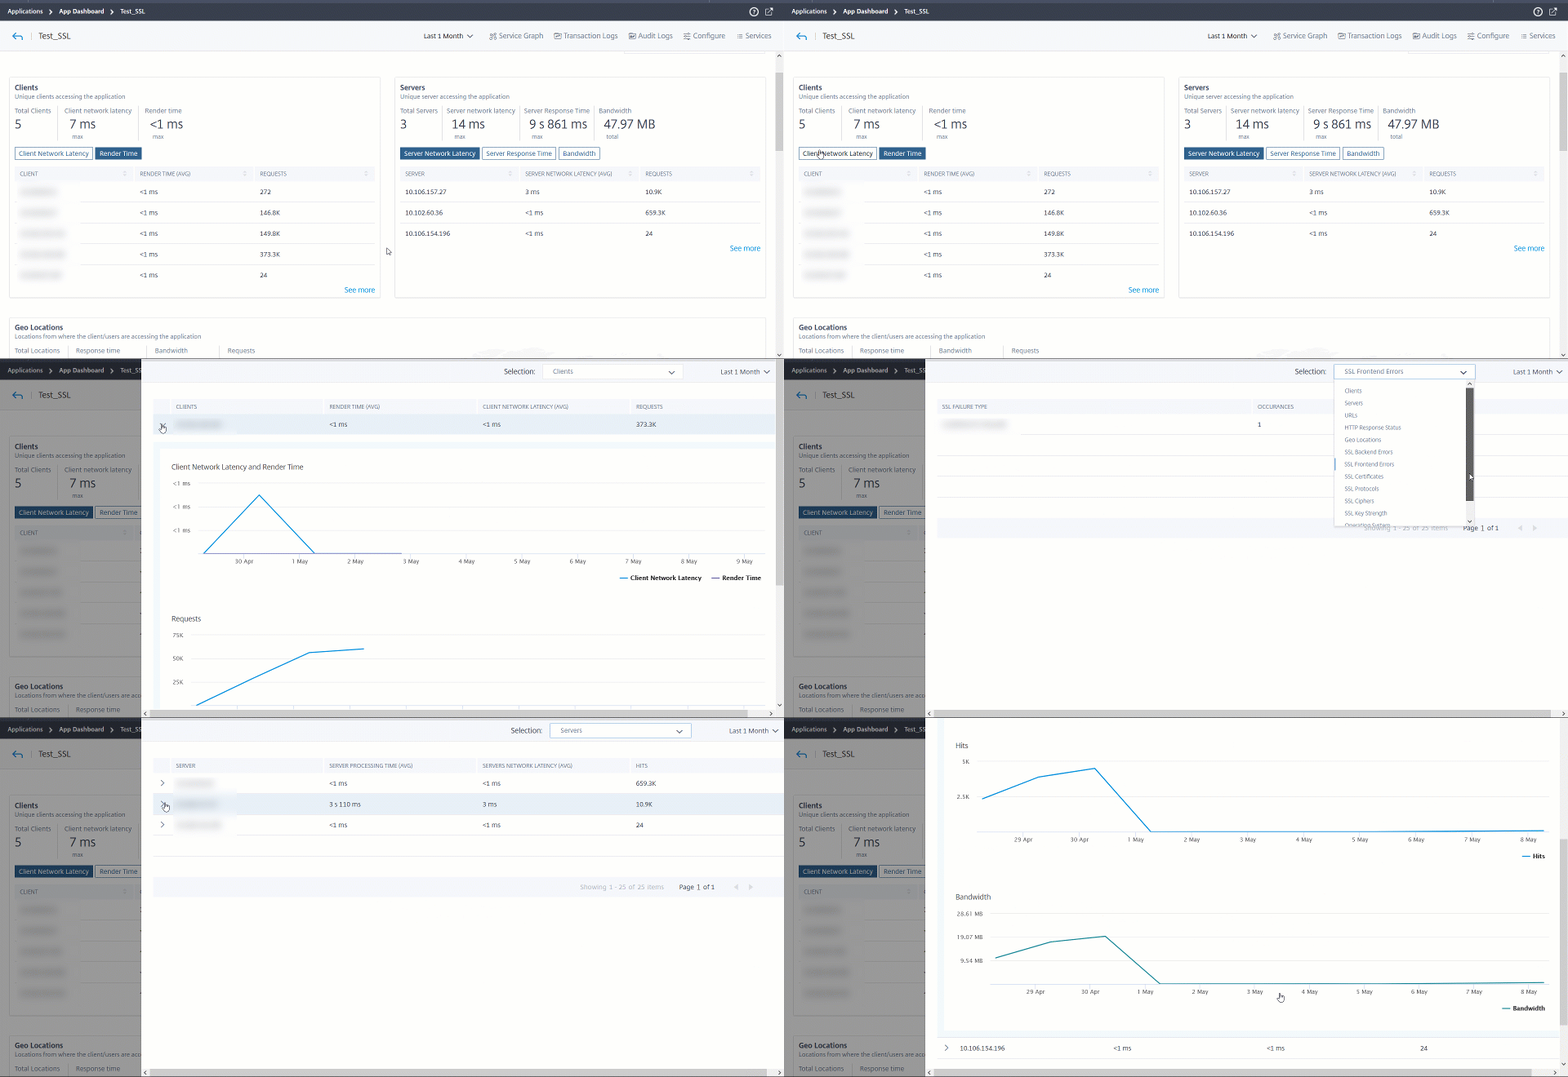
The following are the details you can view for each metric after you click the See more option:
| Insight name | Metrics | Description |
|---|---|---|
| Clients | Clients | Denotes the client list |
| Render Time (AVG) | Denotes the average time taken for the client to render the server response | |
| Client Network Latency (AVG) | Denotes the average network latency from the client to NetScaler instance | |
| Requests | Denotes the total requests from the client | |
| Servers | Server | Denotes the server list |
| Server Processing Time (AVG) | Denotes the average time taken for the server to process the requests | |
| Server Network Latency (AVG) | Denotes the average network latency from the server to NetScaler instance | |
| Hits | Denotes the total hits received by the server | |
| Geo Locations | Locations | Denotes the client locations |
| Response Time | Denotes the total response time from the client location | |
| Bandwidth | Denotes the total bandwidth consumed from the location | |
| Requests | Denotes the total requests from the location | |
| URL | Render Time (AVG) | Denotes the average time taken to load the page from the server |
| Load Time (AVG) | Denotes the average time taken for the URL to render and display | |
| Hits | Denotes the total hits from the URL | |
| HTTP Response Status | Name | Denotes the response status name such as OK, Not found, Internal Server Error, and so on |
| Response Status | Denotes the response status code received from the server such as 200, 400, 500, and so on | |
| Hits | Denotes the total hits from the response code | |
| Bandwidth | Denotes the total bandwidth consumed | |
| Operating System | Operating System | Denotes the operating system name such as Windows, MAC |
| Load Time | Denotes the total time taken for the operating system to load from the server | |
| Bandwidth | Denotes the total bandwidth consumed by the operating system | |
| Requests | Denotes the total requests from the operating system | |
| Browsers | Browsers | Denotes the browser name such as Mozilla Firefox, Chrome, and so on |
| Load Time | Denotes the total time taken for a browser to load from the server | |
| Bandwidth | Denotes the total bandwidth consumed by the browser | |
| Requests | Denotes the total requests from the browser | |
| SSL Errors | SSL Failure Type | Denotes the error name such as CLIENTAUTH FAILURE |
| Occurrences | Denotes the total occurrences for the SSL error | |
| SSL Usage | Denotes the protocol name and versions such as TLS, SSL | |
| Hits | Denotes the total hits from the protocol |
Troubleshoot Web Insight issues
For details, see the troubleshooting document Troubleshoot Web Insight issues