Integration with Splunk
You can now integrate NetScaler® ADM with Splunk to view analytics for:
-
WAF violations
-
Bot violations
-
SSL Certificate Insights
Splunk add-on enables you to:
-
Combine all other external data sources.
-
Provide greater visibility of analytics in a centralized place.
NetScaler ADM collects Bot, WAF, SSL events, and sends to Splunk periodically. The Splunk Common Information Model (CIM) add-on converts the events to CIM compatible data. As an administrator, using the CIM compatible data, you can view the events in the Splunk dashboard.
For a successful integration, you must:
Related information
Configure Splunk to receive data from NetScaler ADM
Setup the Splunk HTTP event collector endpoint and generate a token
You must first setup the HTTP event collector in Splunk. This setup enables the integration between the ADM and Splunk to send the data. Next, you must generate a token in Splunk to:
-
Enable authentication between ADM and Splunk.
-
Receive data through the event collector endpoint.
-
Log on to Splunk.
-
Navigate to Settings > Data Inputs > HTTP event collector and click Add new.
-
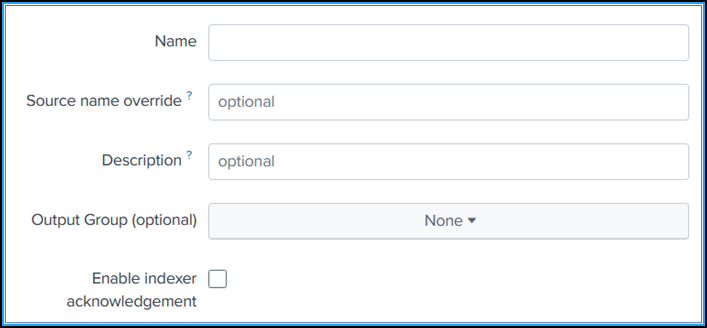
Specify the following parameters:
-
Name: Specify a name of your choice.
-
Source name override (optional): If you set a value, it overrides the source value for HTTP event collector.
-
Description (optional): Specify a description.
-
Output Group (optional): By default, this option is selected as None.
-
Enable indexer acknowledgement: By default, this option is not selected.
-
-
Click Next.
-
Optionally, you can set additional input parameters in the Input Settings page.
-
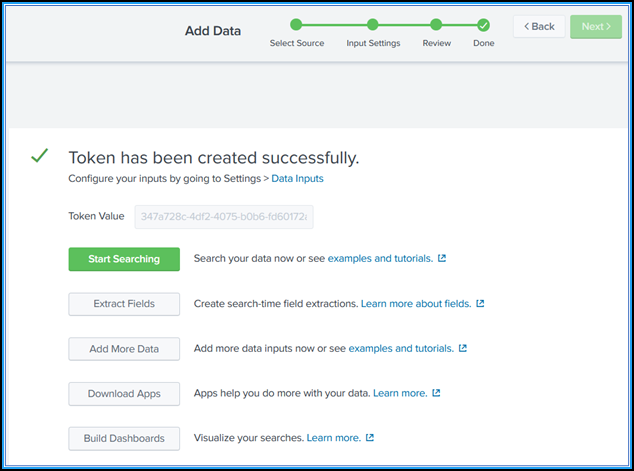
Click Review to verify the entries and then click Submit.A token gets generated. You must use this token when you add details in NetScaler ADM.
Install the Splunk Common Information Model
In Splunk, you must install the Splunk CIM add-on. This add-on ensures that the data received from NetScaler ADM to normalize the ingested data and match a common standard using the same field names and event tags for equivalent events.
-
Log on to Splunk.
-
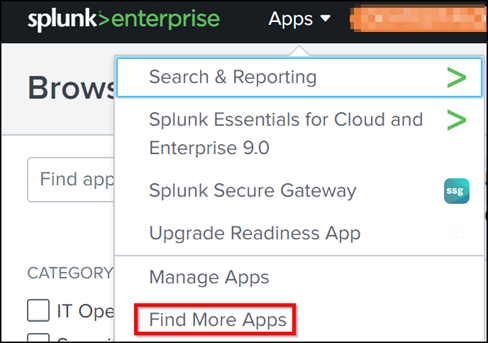
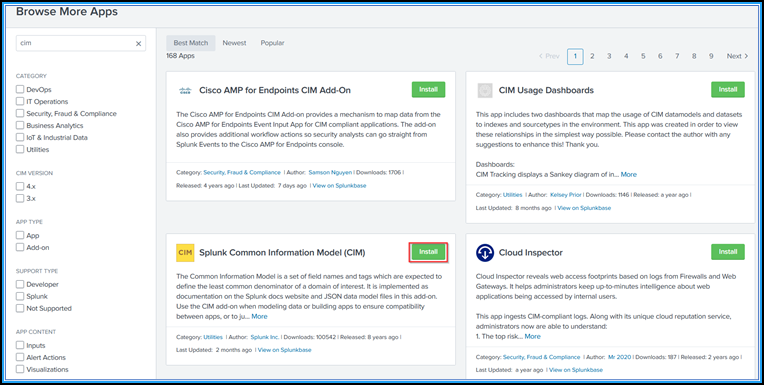
Navigate to Apps > Find More Apps.
-
Type CIM in the search bar and press Enter to get the Splunk Common Information Model (CIM) add-on, and click Install.
Prepare a sample dashboard in Splunk
After you install the Splunk CIM, you must prepare a sample dashboard using a template for WAF and Bot, and SSL Certificate Insights. You can download the dashboard template (
.tgz) file, use any editor (for example, notepad) to copy its contents, and create a dashboard by pasting the data in Splunk.
Note:
The following procedure to create a sample dashboard is applicable for both WAF and Bot, and SSL Certificate Insights. You must use the required
json file.
-
Log on to Citrix downloads page and download the sample dashboard available under Observability Integration.
-
Extract the file, open the
jsonfile using any editor, and copy the data from the file.Note:After you extract, you get twojsonfiles. Useadm_splunk_security_violations.jsonto create the WAF and Bot sample dashboard, and useadm_splunk_ssl_certificate.jsonto create the SSL certificate insight sample dashboard. -
In the Splunk portal, navigate to Search & Reporting > Dashboards and then click Create New Dashboard.

-
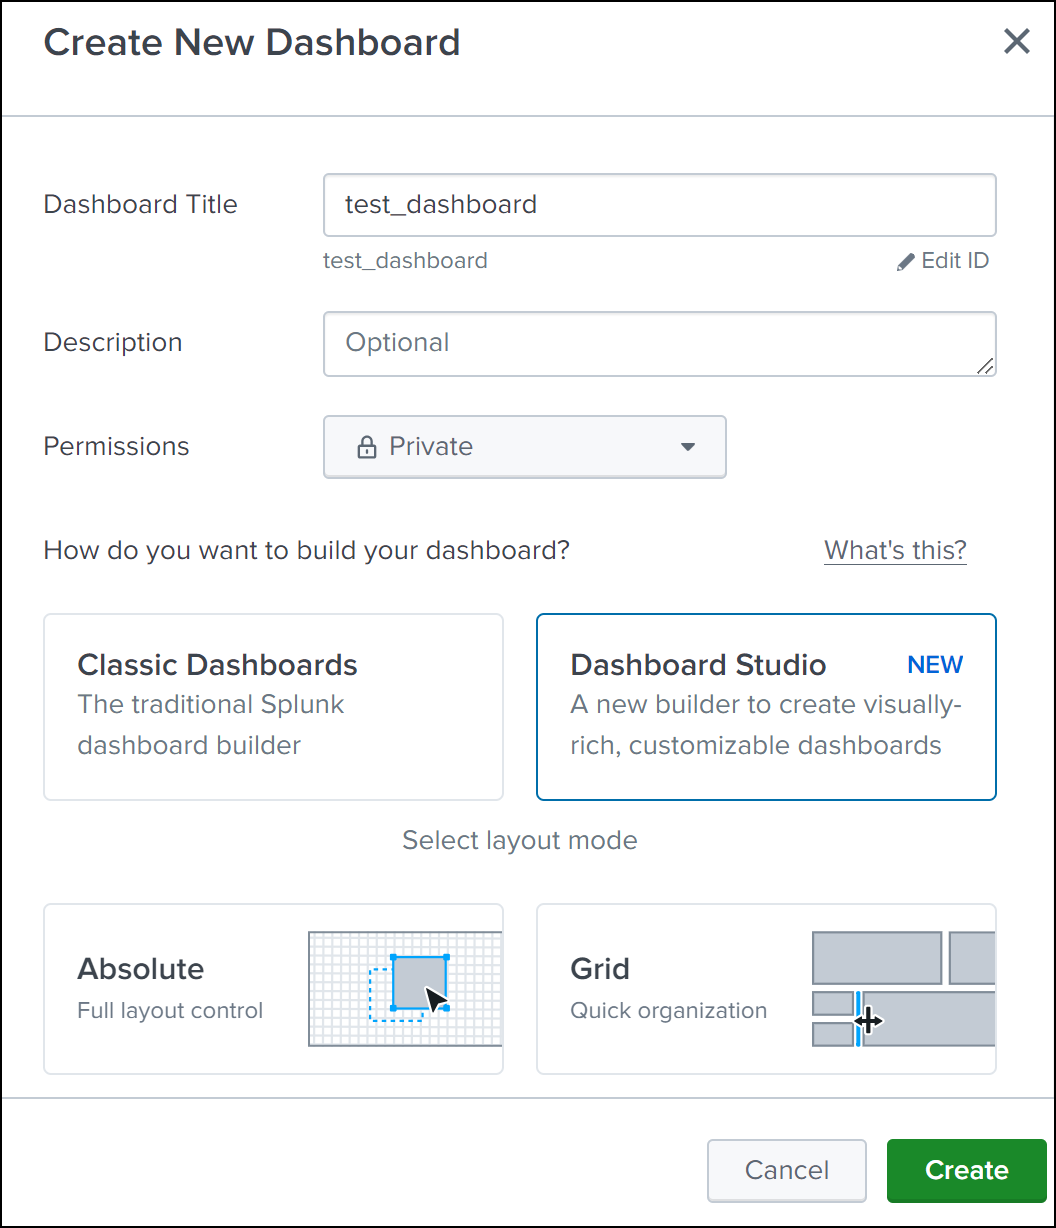
In the Create New Dashboard page, specify the following parameters:
-
Dashboard Title - Provide a title of your choice.
-
Description - Optionally, you can provide a description for your reference.
-
Permission - Select Private or Shared in App based on your requirement.
-
Select Dashboard Studio.
-
Select any one layout (Absolute or Grid), and then click Create.
 After you click Create, select the Source icon from the layout.
-
-
Delete the existing data, paste the data that you copied in step 2, and click Back.
-
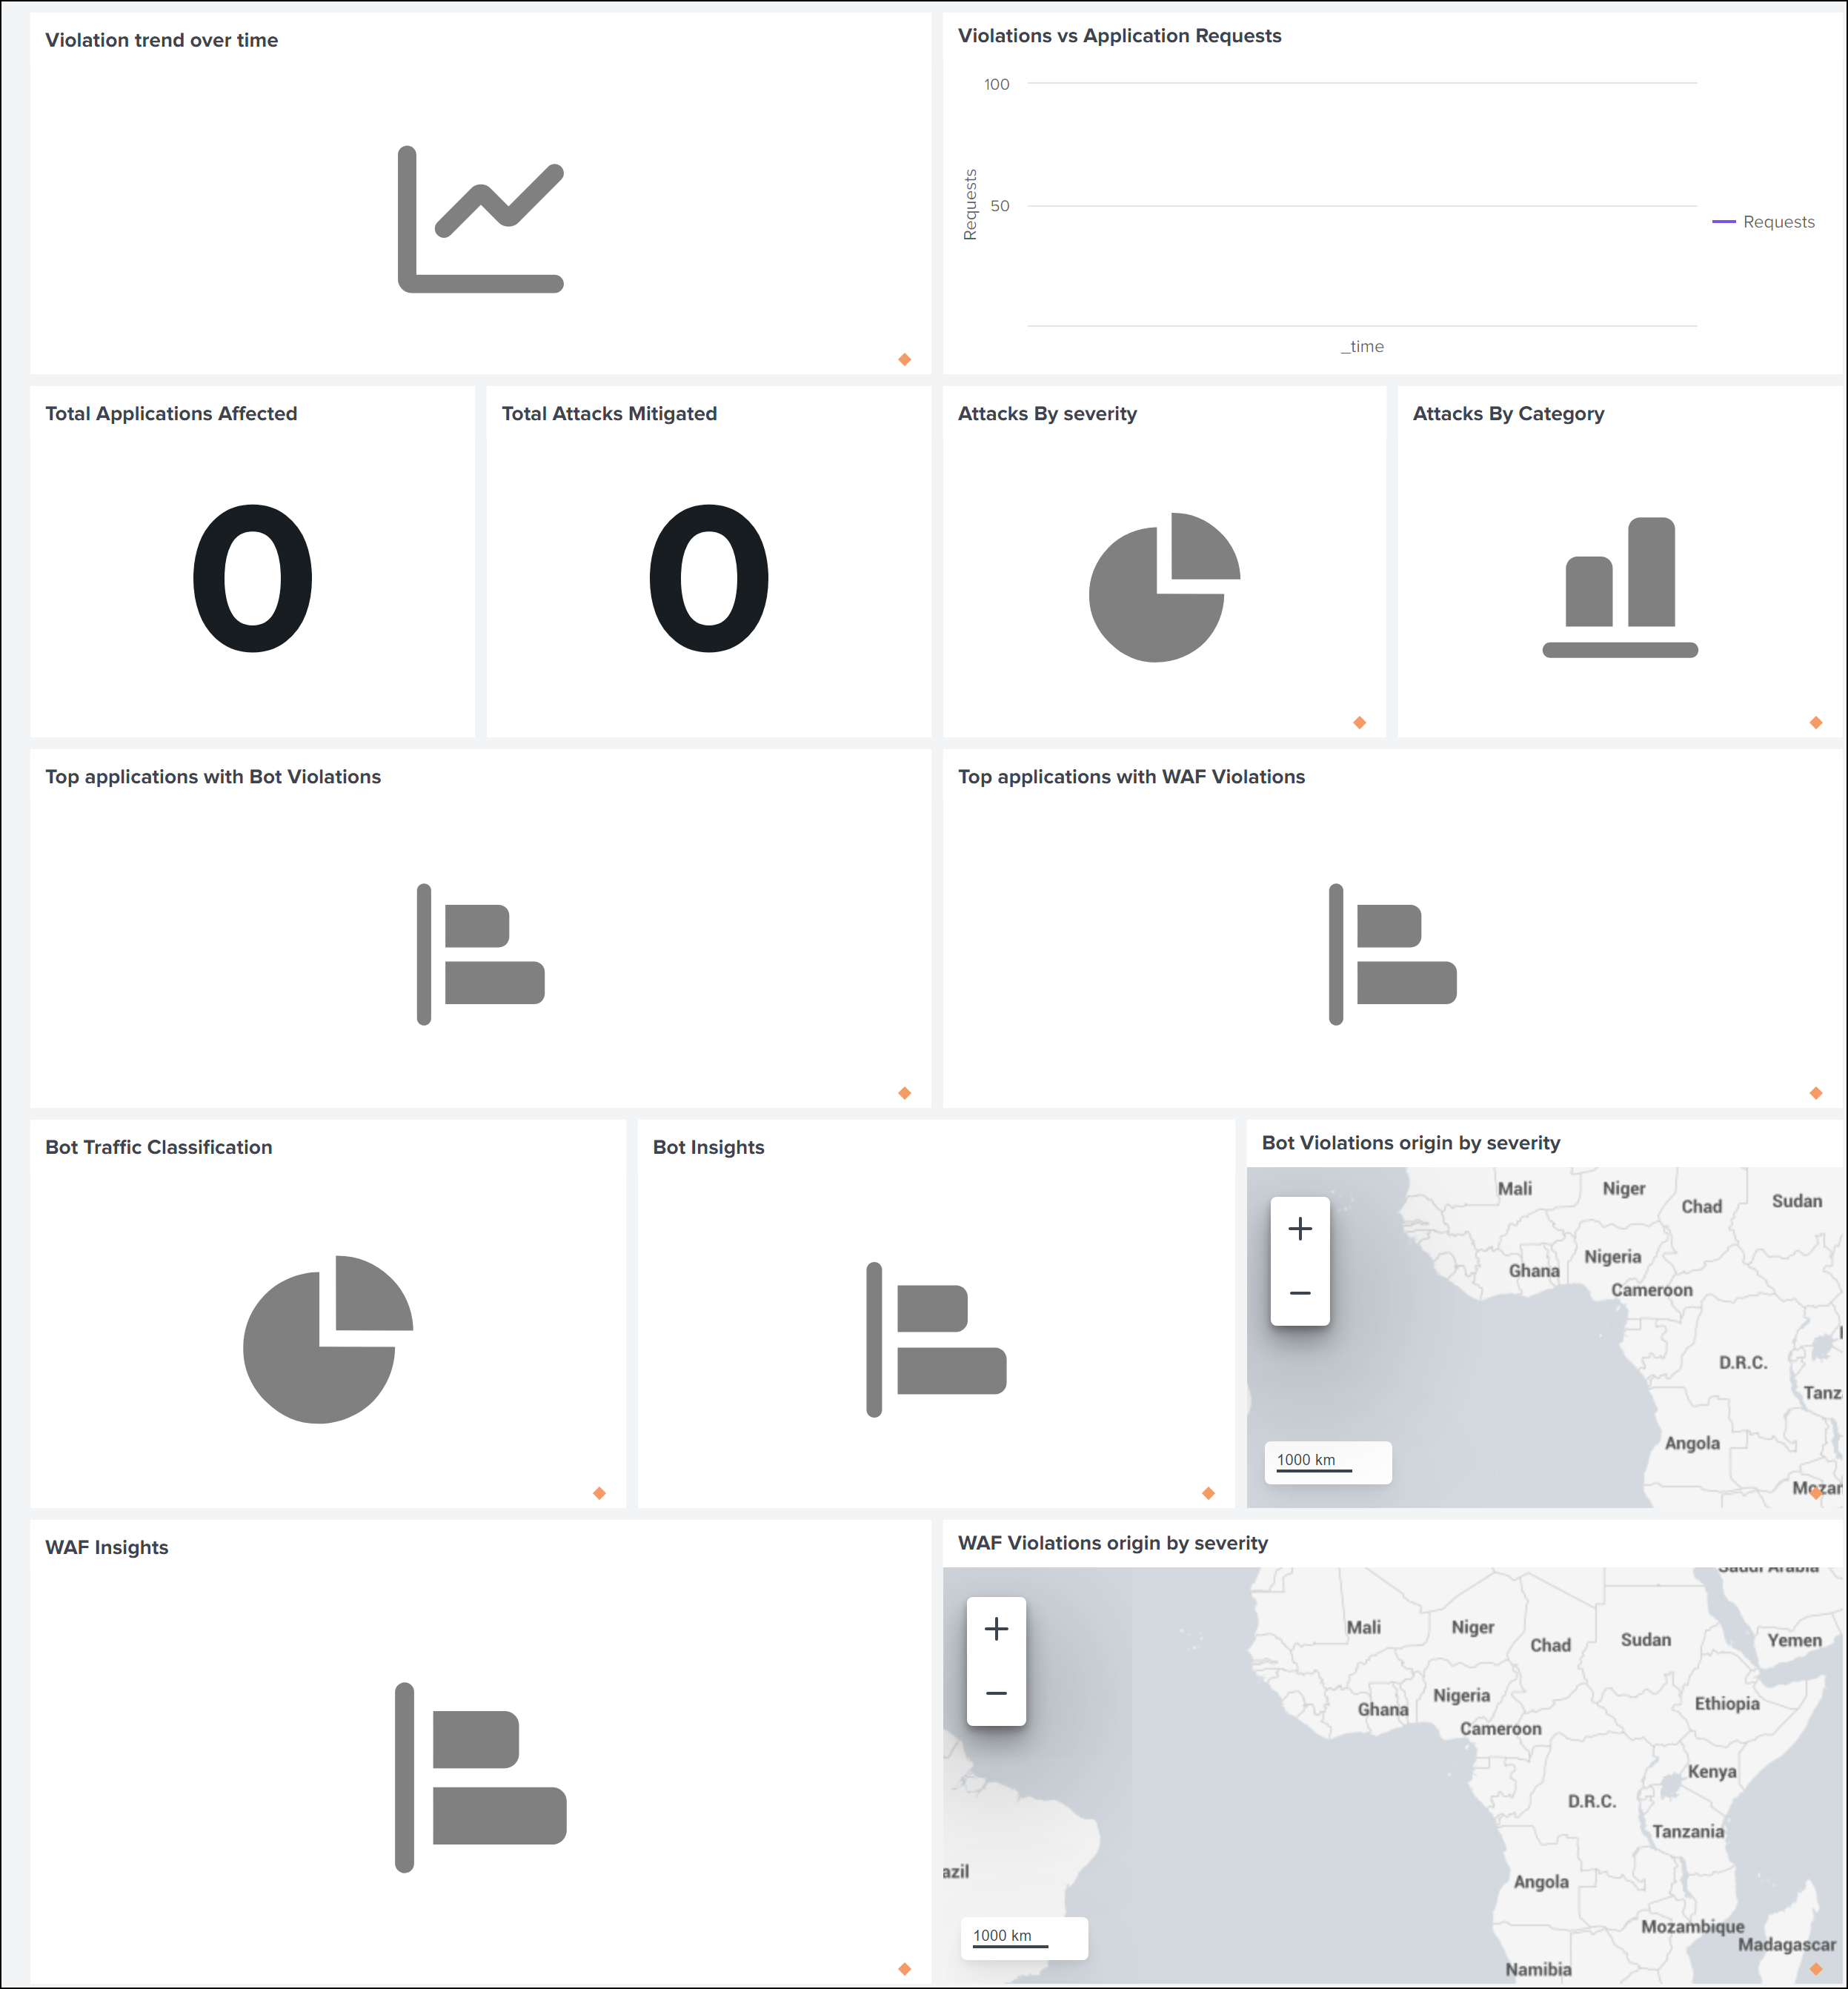
Click Save.You can view the following sample dashboard in your Splunk.
Configure NetScaler ADM to export data to Splunk
You now have everything ready in Splunk. The final step is to configure NetScaler ADM by creating a subscription and adding the token.
Upon completion of the following procedure, you can view the updated dashboard in Splunk that is currently available in your NetScaler ADM:
-
Log on to NetScaler ADM.
-
Navigate to Settings > Ecosystem Integration.
-
In the Subscriptions page, click Add.
-
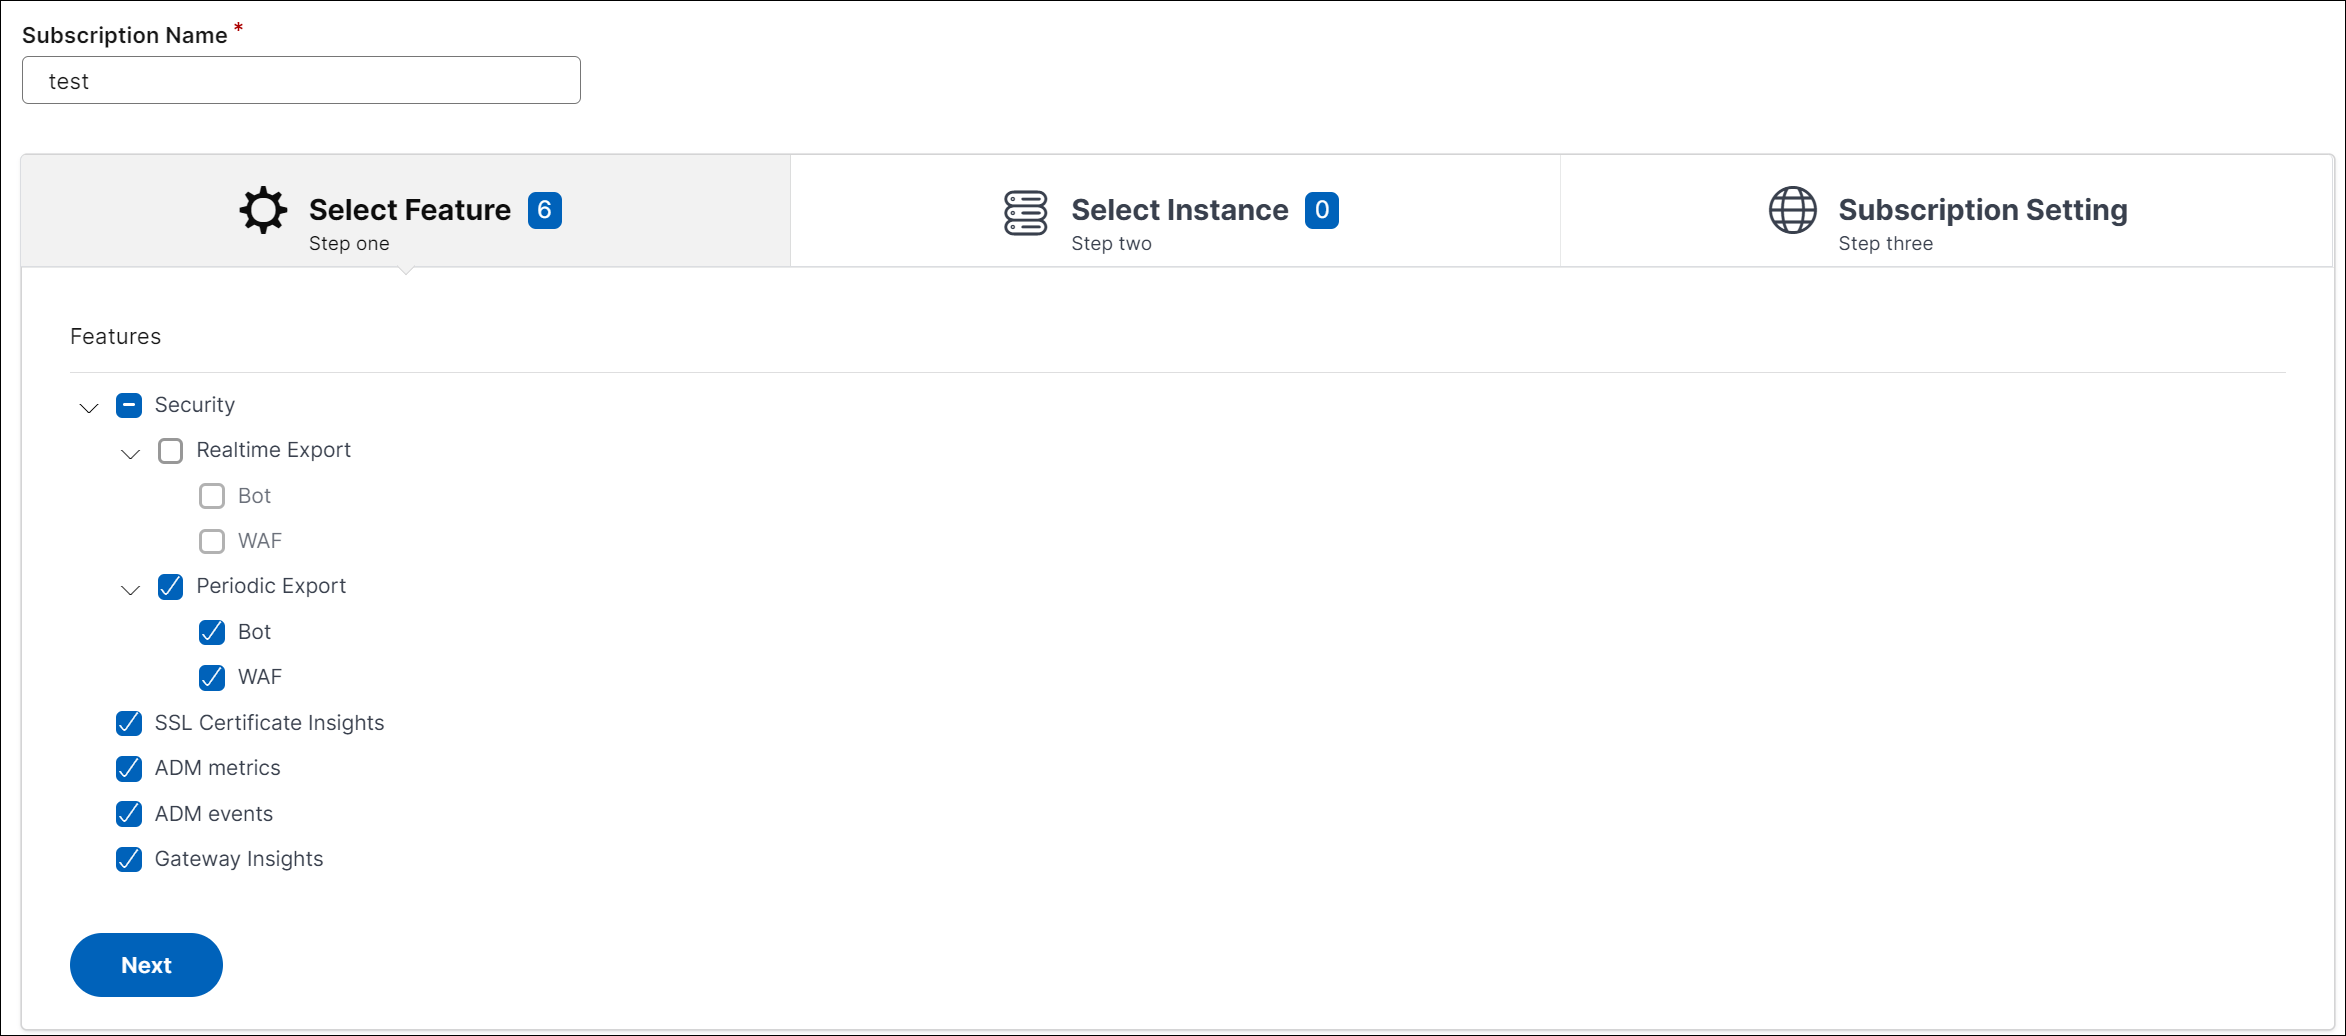
In the Select features to subscribe tab, select the features that you want to export and click Next.
-
Realtime Export - The selected violations are exported to Splunk immediately.
-
Periodic Export - The selected violations are exported to Splunk based on the duration you select.
-
-
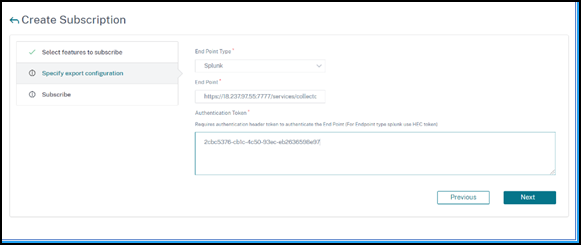
In the Specify export configuration tab:
-
End Point Type – Select Splunk from the list.
-
End Point – Specify the Splunk end point details. The end point must be in the
<https://SPLUNK_PUBLIC_IP:SPLUNK_HEC_PORT/services/collector/event>format.NoteIt is recommended to use HTTPS for security reasons.-
SPLUNK_PUBLIC_IP – A valid IP address configured for Splunk.
-
SPLUNK_HEC_PORT – Denotes the port number that you have specified during the HTTP event endpoint configuration. The default port number is 8088.
-
Services/collector/event – Denotes the path for the HEC application.
-
-
Authentication token – Copy and paste the authentication token from the Splunk page.
-
Click Next.
-
-
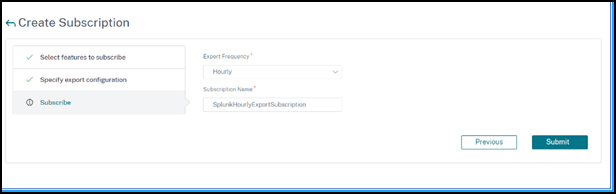
In the Subscribe page:
-
Export Frequency – Select Daily or Hourly from the list. Based on the selection, NetScaler ADM exports the details to Splunk.Note:Applicable only if you have selected violations in Periodic Export.
-
Subscription Name – Specify a name of your choice.
-
Select the Enable Notifications check box.
-
Click Submit.
 Note
Note-
When you configure with Periodic Export option for the first time, the selected features data get pushed to Splunk immediately. The next export frequency happens based on your selection (daily or hourly).
-
When you configure with Realtime Export option for the first time, the selected features data pushed to Splunk immediately when the violations are detected in NetScaler ADM.
-
-
View dashboards in Splunk
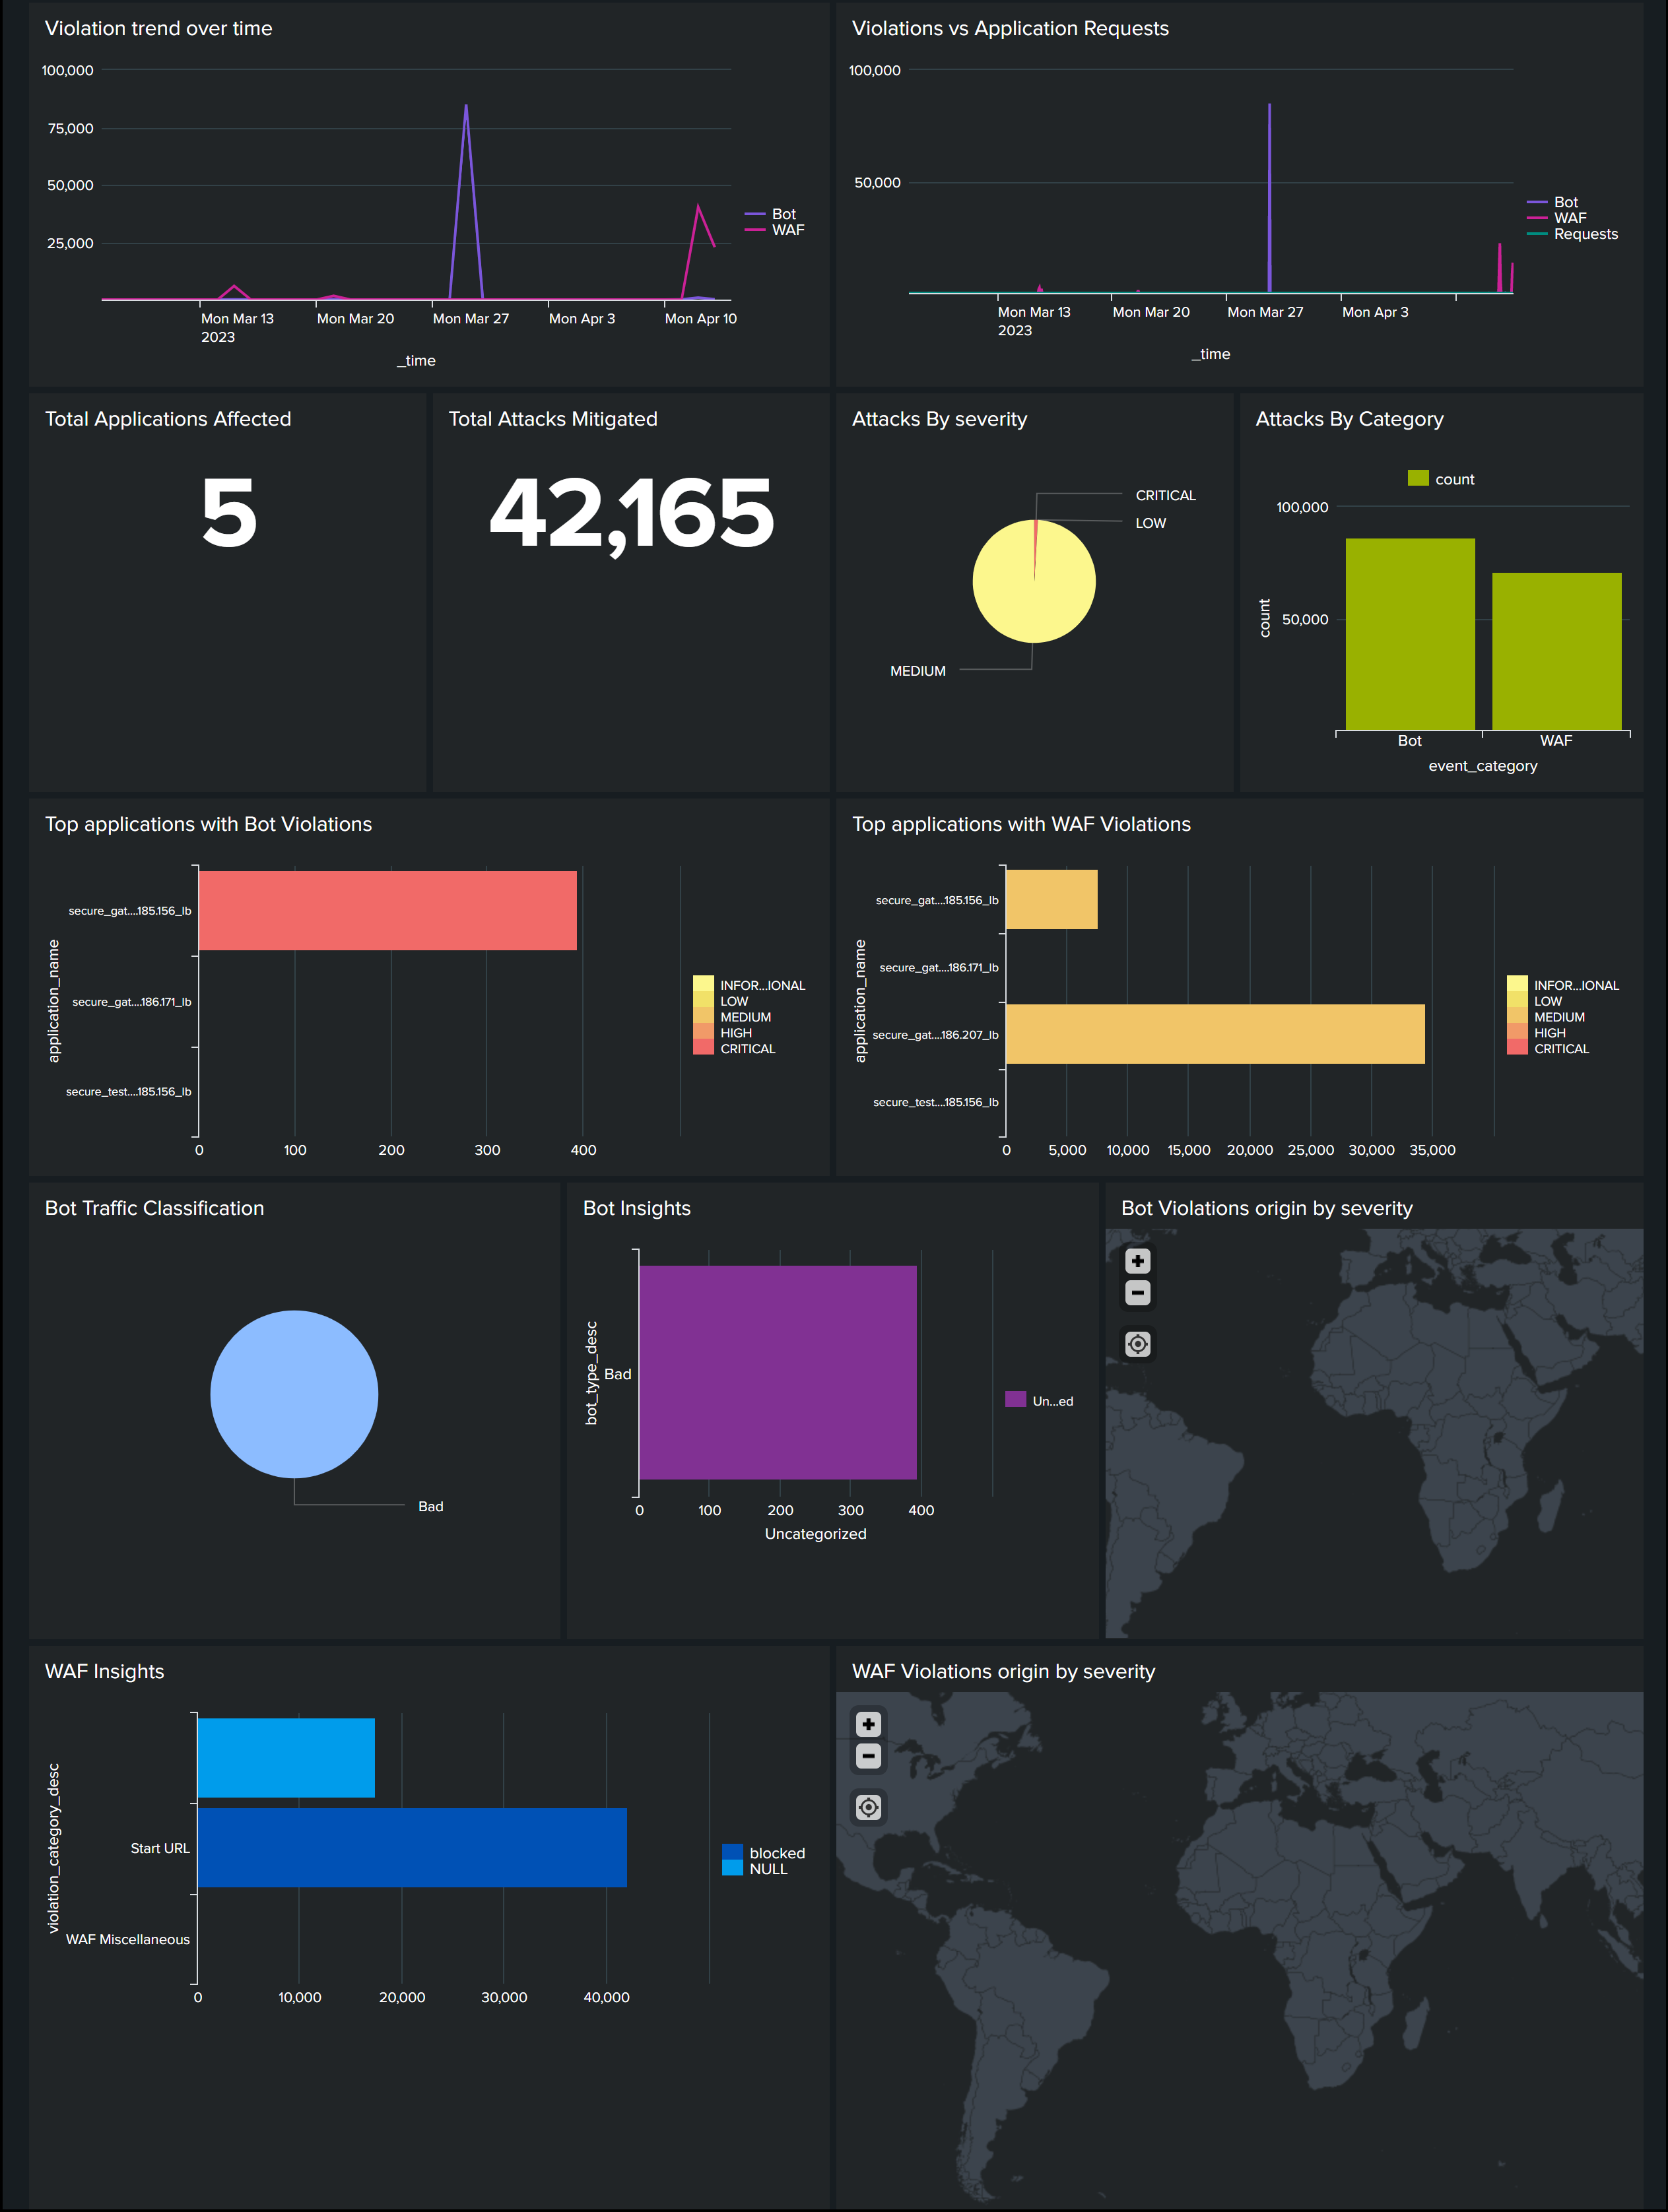
After you complete the configuration in NetScaler ADM, the events appear in Splunk. You are all set to view the updated dashboard in Splunk without any additional steps.
Go to Splunk and click the dashboard that you have created to view the updated dashboard.
The following is an example for the updated WAF and Bot dashboard:
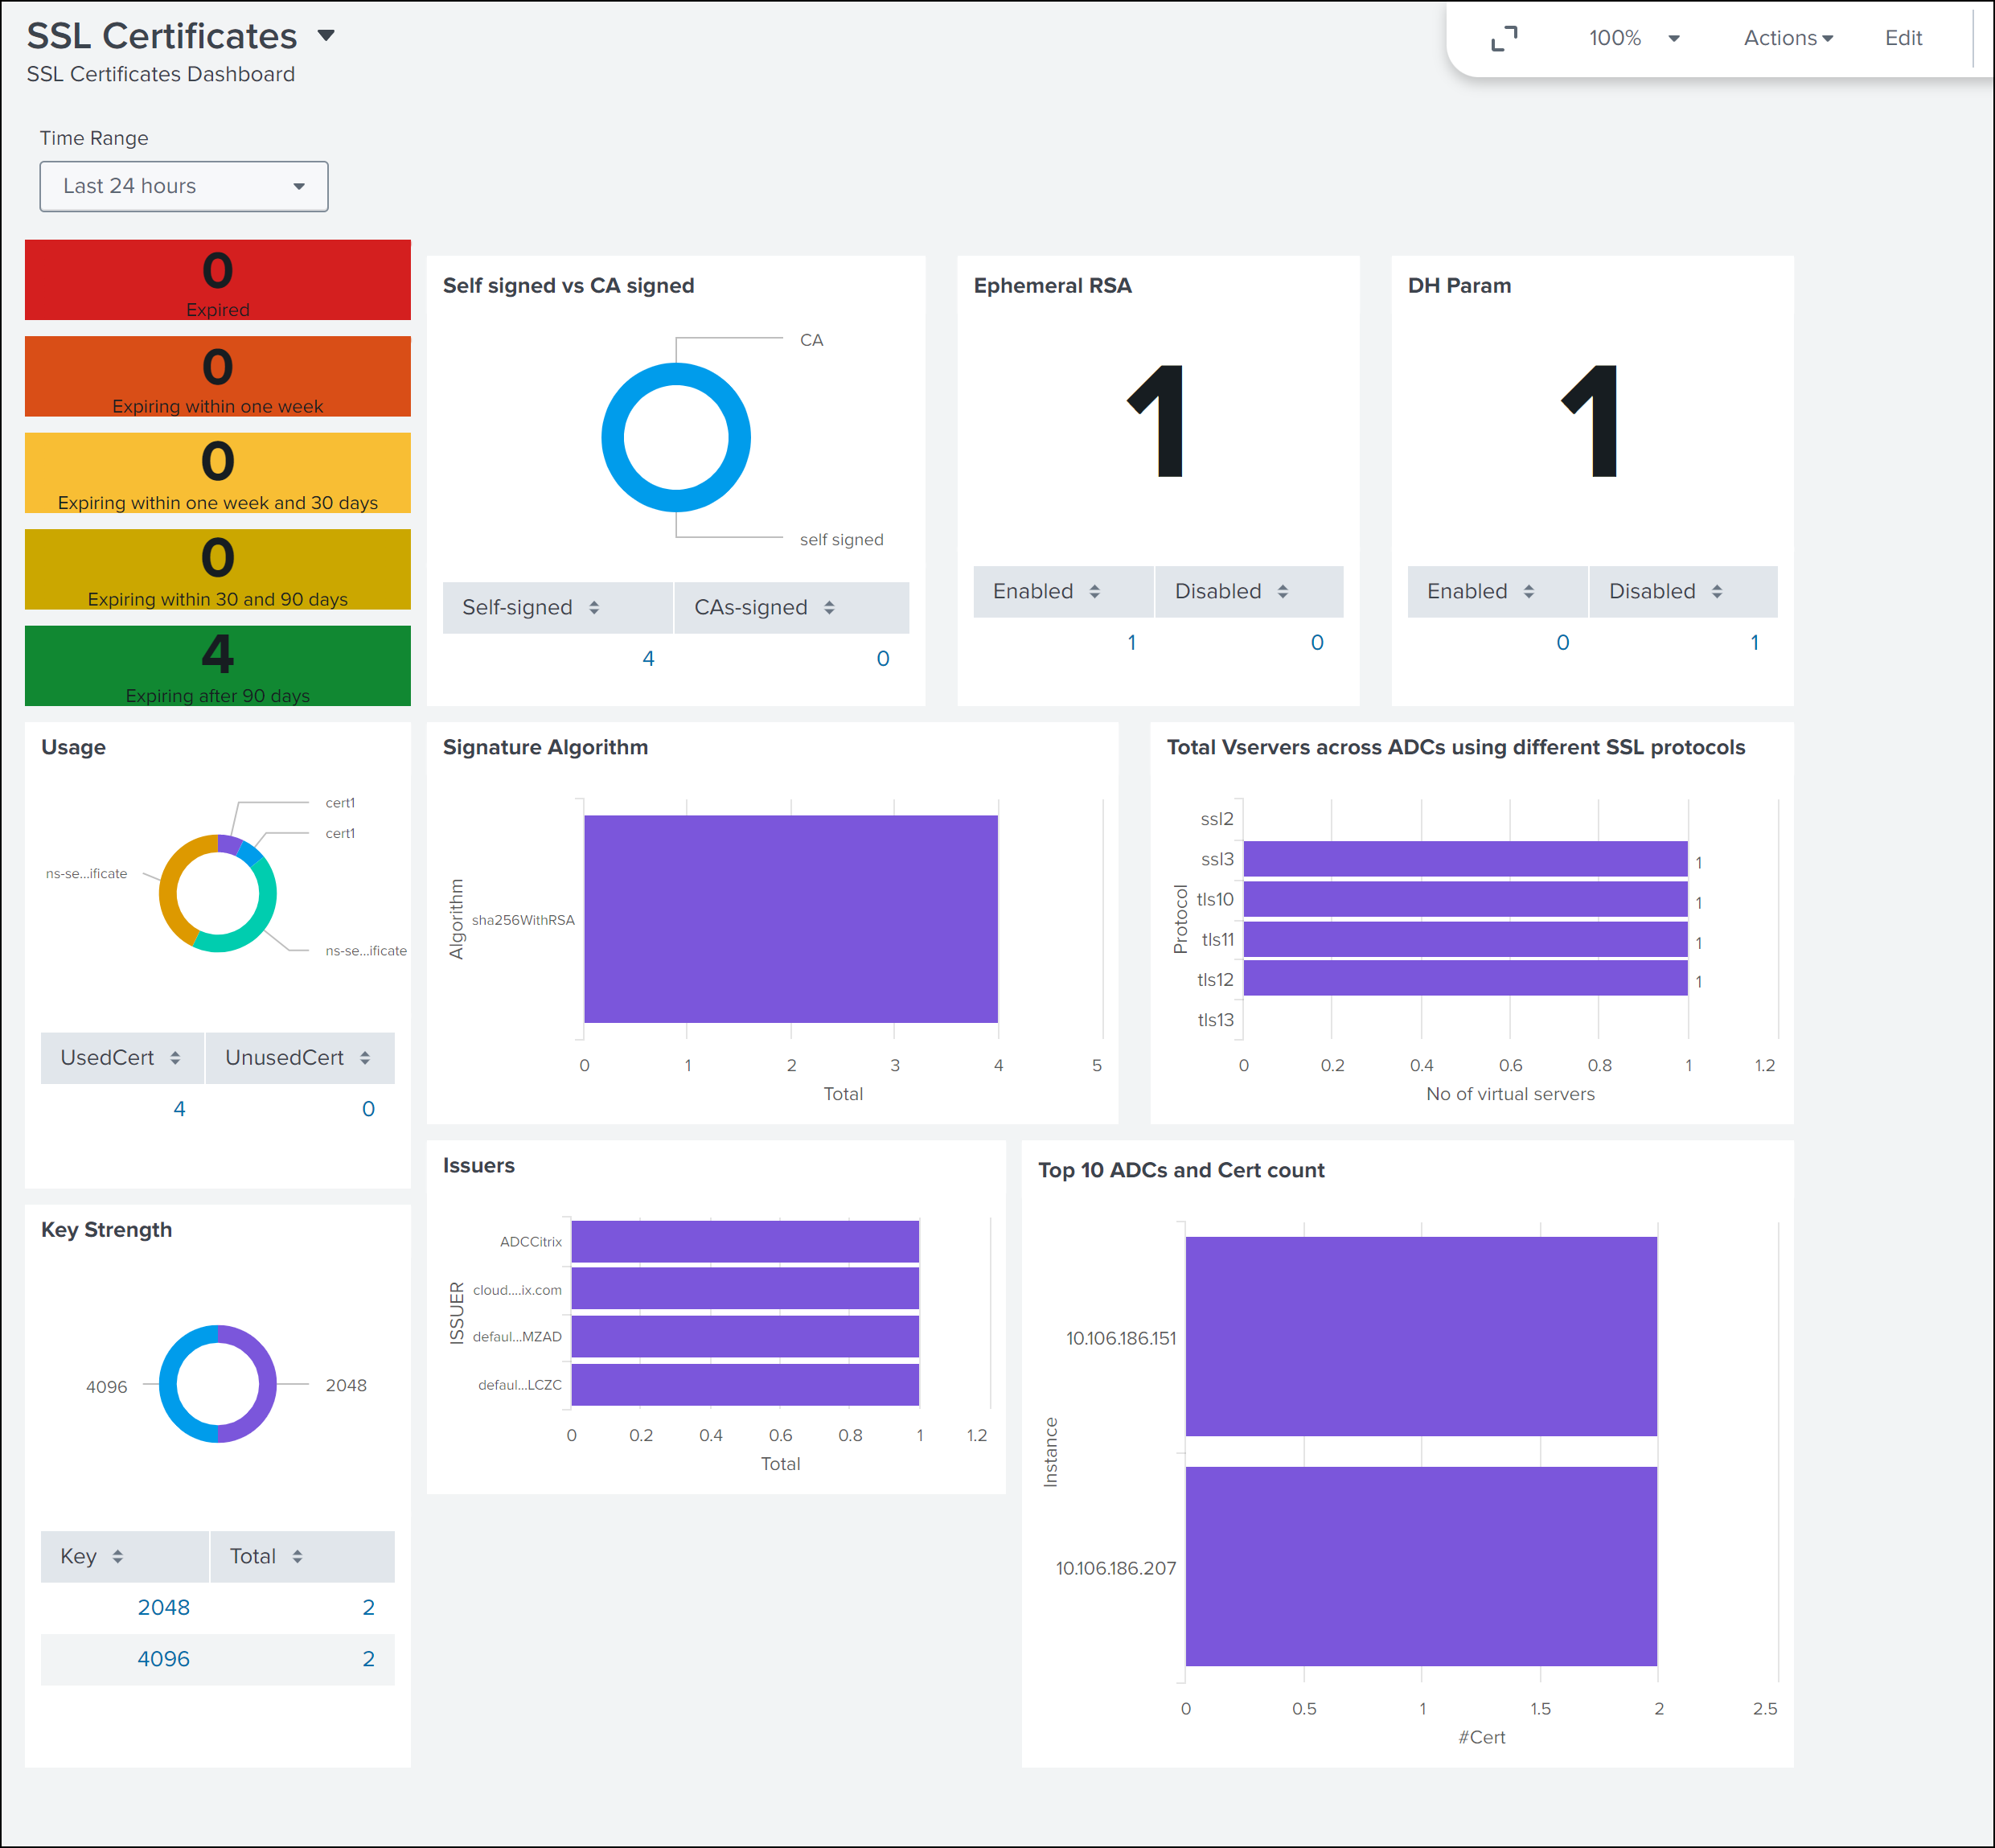
The following dashboard is an example for the updated SSL Certificate Insights dashboard.