
Network reporting
You can optimize resource usage by monitoring your network reporting on NetScaler Application Delivery Management (NetScaler ADM). You may have a distributed deployment with many applications deployed at multiple locations. To ensure optimal performance of your applications, you have also deployed multiple Citrix Application Delivery Controller (NetScaler) instances to load balance, content switch, or compress the traffic. Network performance can impact the application performance. To continue to maintain the performance of your applications, you must regularly monitor your network performance and make sure all resources are used optimally.
NetScaler ADM now allows you to generate reports not only for instances at a global level but also for entities such as the virtual servers and network interfaces. The instance family comprises NetScaler instances. The virtual servers for which you can generate reports are as follows:
-
Load balancing servers, services, and service groups
-
Content switching servers
-
Cache redirection servers
-
Global service load balancing (GSLB)
-
Authentication
-
NetScaler Gateway
The network reporting dashboard in NetScaler® ADM is a highly customizable. You can now create multiple dashboards for various instances, virtual servers, and other entities.
Related information
Network reporting dashboard
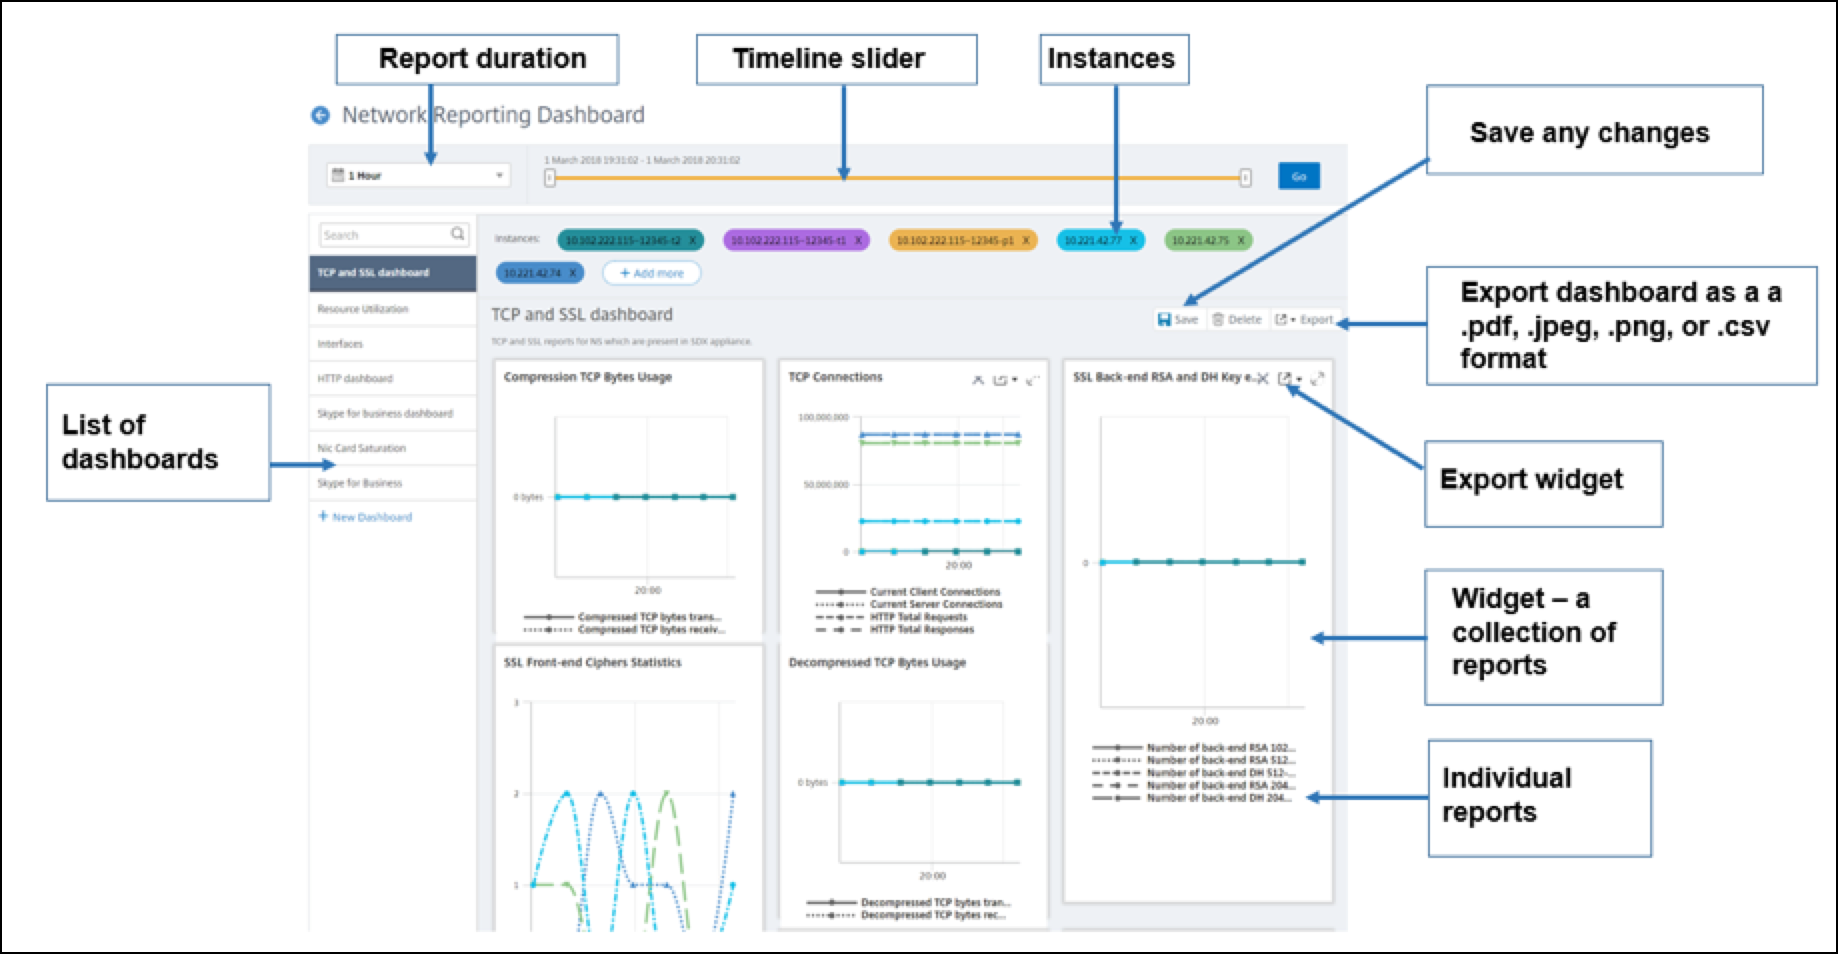
The following image calls out the various features in the dashboard:
-
The left side panel lists all the custom dashboards that are created in NetScaler ADM. You can click one of them to view the various reports that the dashboard is composed of. For example, a TCP and SSL dashboard contains various reports related to TCP and SSL protocols.
-
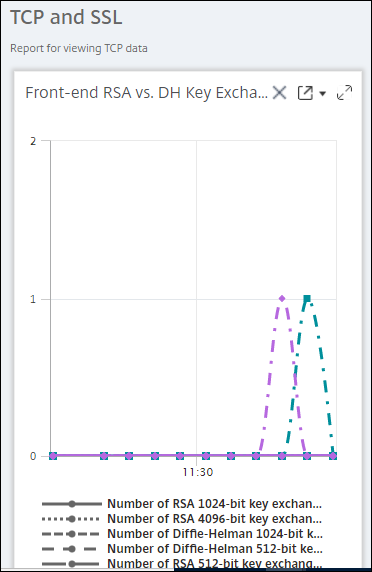
You can customize each dashboard with multiple widgets to display various reports. A widget represents a report on the dashboard, that is a collection of more related reports. For example, a compression TCP Bytes Usage report contains reports for compressed TCP bytes transferred and received per second.
-
You can display reports for one hour, one day, one week, or for one month. In addition, you can now use the timeline slider option to customize the duration of reports being generated on the NetScaler ADM.
-
You can remove a report by clicking "X". You can also export the report as a .pdf, .jpeg, .png, or .csv format to your system. You can also schedule a time and recurrence of when the report must be generated. You can also configure an email distribution list to which the reports must be sent.
-
The Instances section at the top of the dashboard lists the IP addresses of all the instances for which the report is generated.
-
You can either remove instances by clicking "X" or add more instances to the reports. But, currently NetScaler ADM allows you to view reports for 10 instances.
-
You can also export the entire dashboard as a .pdf, .jpeg, .png, or .csv format to your system. Any changes made to the dashboard must be saved. Click Save to save the changes.
The following section explains in detail the tasks to create a dashboard, generate reports, and to export reports.
To view or to create a dashboard:
-
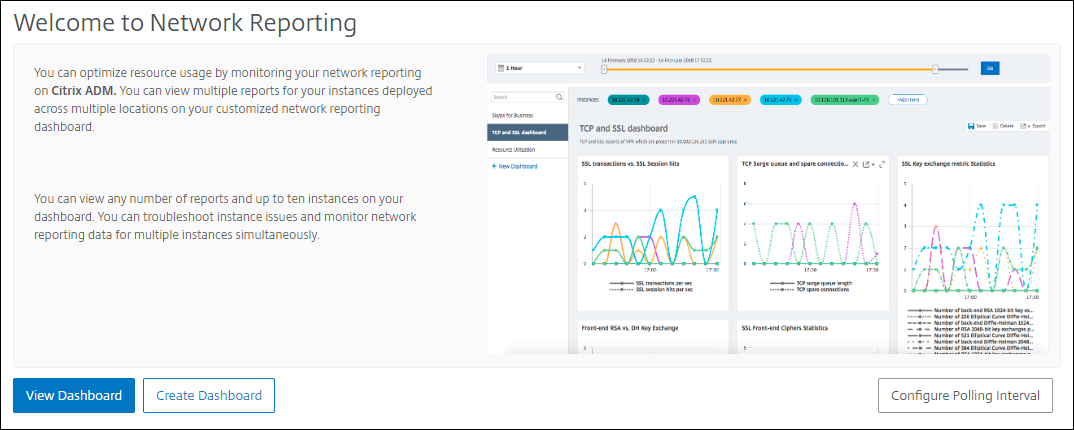
In NetScaler ADM, navigate to Infrastructure > Network Reporting.
-
To view the existing dashboards, click View Dashboard. The Network Reporting Dashboard page opens where you can view all your dashboards and report widgets.
-
To create a dashboard, click New Dashboard. The Create Dashboard page opens.
-
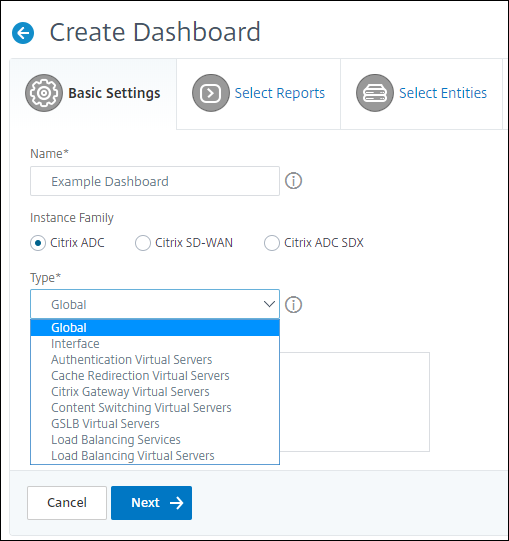
In the Basic Settings tab, enter the following details:
-
Name. Type the name of the dashboard.
-
Instance Family. Select the type of instance - NetScaler or NetScaler SDX.
-
Type. Select the entity type for which you want to generate reports. In this example, select load balancing virtual servers.
-
Description. Type a meaningful description for the dashboard.
-
-
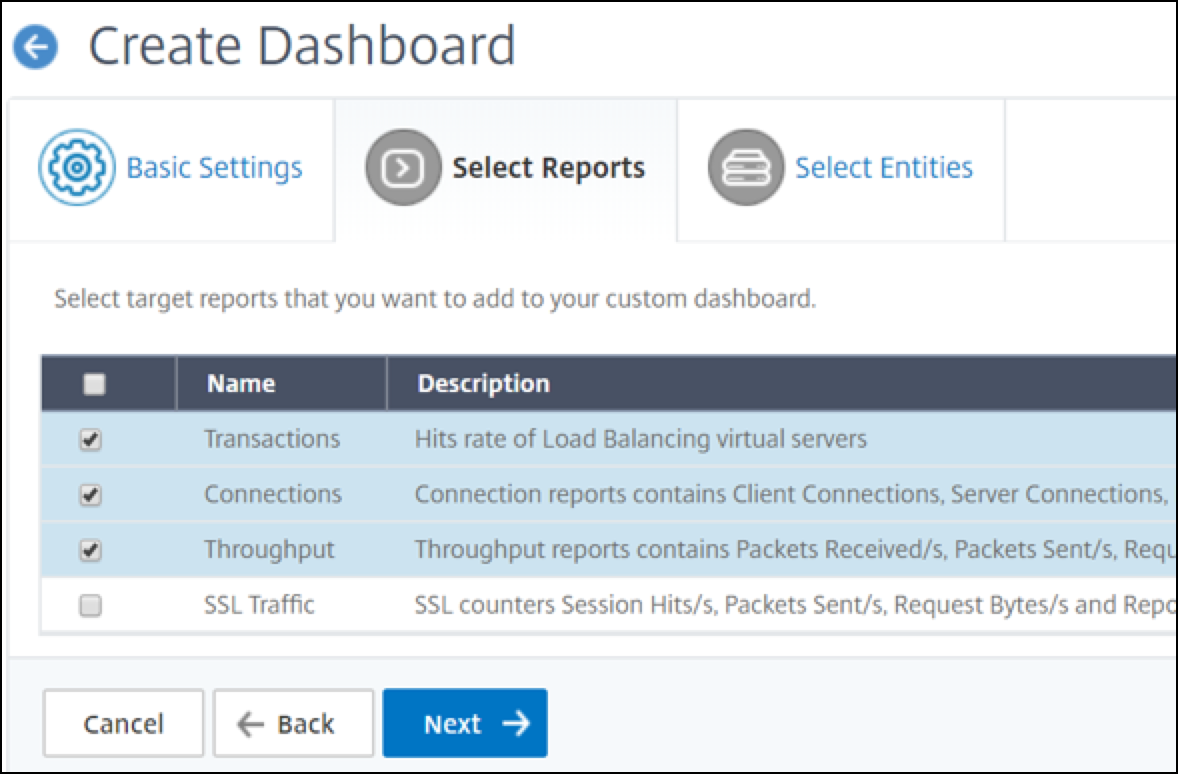
Click Next. All the supported reports for the instance and the specific entity appear.
-
In the Select Reports tab, select the reports required. In this example, you can select transactions, connections, and throughput. Click Next.
-
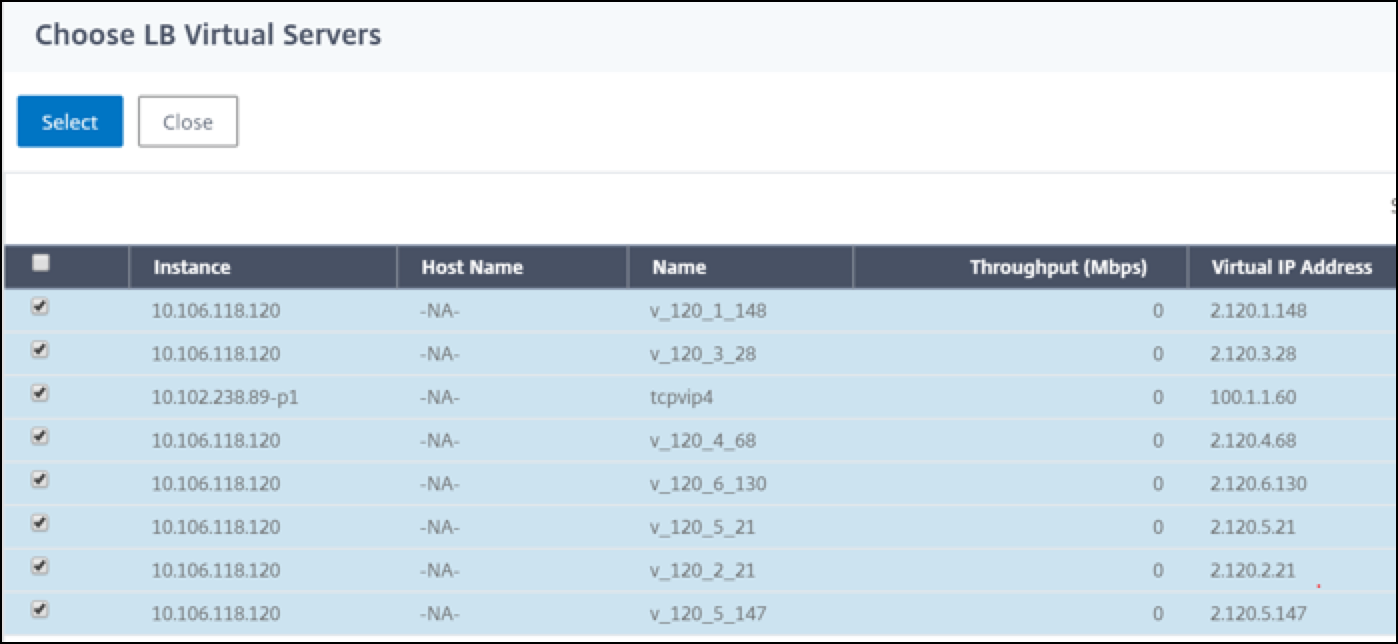
In the Select Entities tab, click Add.A window appears with the entities list depending on the selected entity type in the Basic Settings tab. In this example, Choose LB Virtual Servers window appears.
-
Select the entities that you want to monitor.
-
Click Create.
The dashboard is created and displays all the reports that you have selected.
Note
Currently, any changes that you make to legends or filters cannot be saved.
Exporting network reports
While you can export widget reports in .pdf, .png, .jpeg, or .csv formats, you can export the entire dashboards in only .pdf, .jpeg, or .png formats.
Note
You cannot export reports in NetScaler ADM if you have read-only permissions. You need an edit permission to be able to create a file in NetScaler ADM and to be able to export the file.
To export dashboard reports:
-
Navigate to Infrastructure > Network Reporting
-
Click View Dashboards to view all the dashboards that you have created.
-
In the left pane, click a dashboard. In this example, click Dashboard 1.
-
Click the export button at the top right corner of the page.
-
Under the Export Now tab, select the required format, and then click Export.On the Export page, you can do one of the following:
-
Select Export Now tab. To view and save the report in PDF, JPEG, PNG, or CSV format.
-
Select Schedule Export tab. To schedule the report daily, weekly, or monthly and send the report over an email or slack message.You can schedule an export of the Network Reporting dashboard page on a recurrent basis. For example, you can set an option to generate a dashboard report every week for the previous one hour at a particular time. The report is generated every week then and shows the status of the dashboard. The report overrides the time and date stamp, if set by the user.
Note
-
if you select Weekly recurrence, ensure that you select the weekdays on which you want the report to be scheduled.
-
If you select Monthly recurrence, ensure that you enter all the days that you want the report to be scheduled separated by commas.
While scheduling network reports, you can customize the heading of the report by entering a text string in the Subject field. The report created at the scheduled time has this string as its name.
For example, for network reports originating from a particular virtual server, you can type in the subject as "authentication-reports-10.106.118.120," where 10.106.118.120 is the IP address of the monitored virtual server.
Note
Currently, this option is available only when you schedule the export of reports. You cannot add a heading to the report when you export them instantly.
View network reporting data by applying aggregations
You can apply aggregations to the network performance data and view application performance on the dashboard. You can also export the results based on your requirement. Using these aggregations applied to the data, you can analyze and ensure if all resources are used optimally. Navigate to Network > Network Reporting and select the time duration 1 day or later to get the View By option.
In the existing average data, you can apply aggregations by selecting the option from the View By list. When you apply aggregation, the data is updated for each metric in the dashboard. Click Settings and select Aggregation Filters.
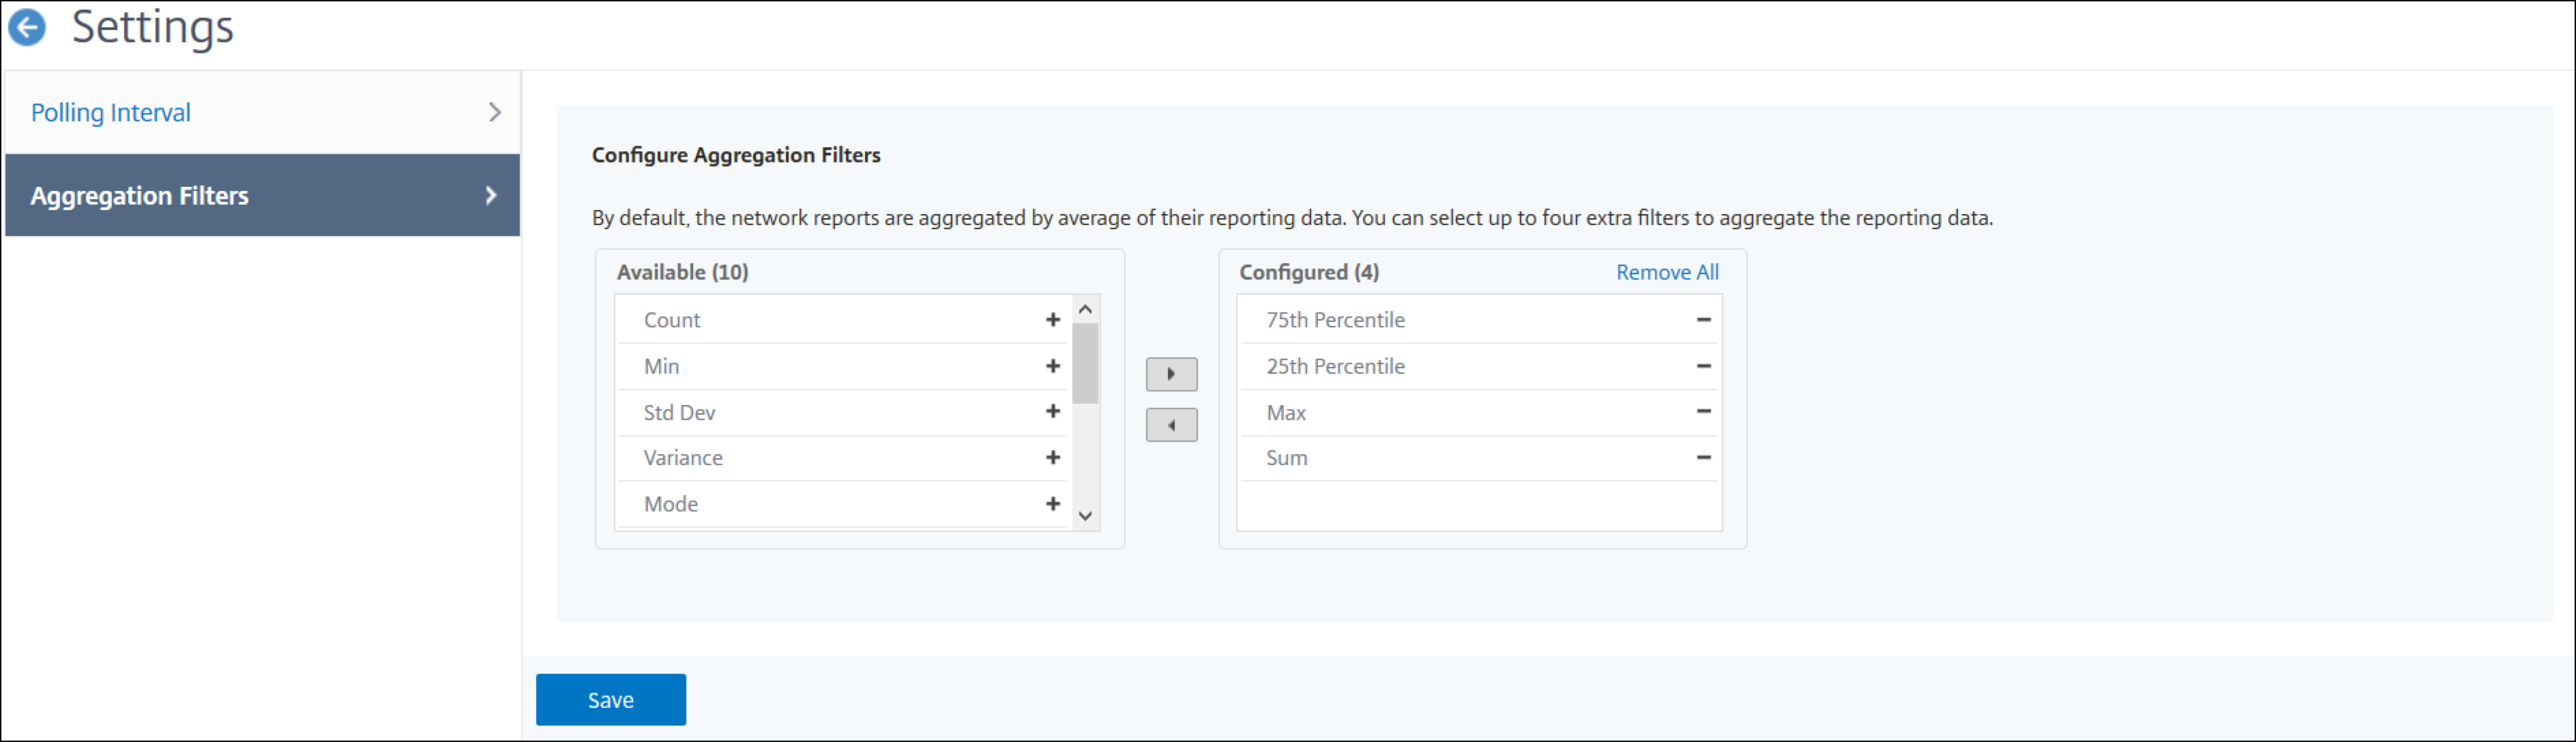
The following are the aggregations that you can add:
-
Count
-
Max
-
Min
-
Sum
-
Std Dev
-
Variance
-
Mode
-
Median
-
25th Percentile
-
75th Percentile
-
95th Percentile
-
99th Percentile
-
First
-
Last
You can add up to 4 aggregation options to the dashboard. After you add the aggregation options, NetScaler ADM takes approximately 1 hour to generate reports for the selected aggregation options.
To export widget reports:
-
Navigate to Infrastructure > Network Reporting.
-
Click View Dashboards to view all the dashboards that you have created.
-
In the left pane, click a dashboard. In this example also click Skype for Business.
-
Select a widget. For example, select Load Balancing Virtual Server Transactions.
-
Click the export button at the top right corner of the page
-
Under the Export Now tab, select the required format, and then click Export.
How to manage Thresholds for Network Reports on NetScaler ADM
To monitor the state of a NetScaler instance, you can set thresholds on counters and receive notifications when a threshold is exceeded. On NetScaler ADM, you can configure thresholds and view, edit, and delete them.
For example, you can receive an email notification when the Connections counter for a content switching virtual server reaches a specified value. You can define a threshold for a specific instance type. You can also choose the reports you want to generate for specific counter metrics from your chosen instance.
When the value of a counter exceeds or falls below (as specified by the rule) the threshold value, an event of the specified severity is generated to signify a performance-related issue. When the counter value returns to a value that you consider normal, the event is cleared. These events can be viewed by navigating to Infrastructure > Events > Reports. On the Reports page, you can click the Events by Severity donut to view events by their severity.
You can also associate an action with a threshold such as sending an email or SMS message when the threshold is breached.
To create a threshold:
-
In NetScaler ADM, navigate to Infrastructure > Network Reporting > Thresholds. Under Thresholds, click Add.
-
On the Create Threshold page, specify the following details:
-
Name. Name of the threshold.
-
Instance Type. Choose NetScaler.
-
Report Name. Name of the performance report that provides information about this threshold.
-
-
You can also set rules to specify when an event is to be generated or cleared. You can specify the following details under the Configure Rule section:
-
Metric. Select the metric for which you want to set a threshold.
-
Comparator. Select a comparator to check whether the monitored value is greater than or equal to or less than or equal to the threshold value.
-
Threshold Value. Type the value for which the event severity is calculated. For example, you might want to generate an event with critical event severity if the monitored value for Current Client Connections reaches 80 percent. In this case, type 80 as the threshold value. You can view “critical severity” events by navigating to Infrastructure > Events > Reports. On the Reports page, you can click the Events by Severity donut to view events by their severity.
-
Clear Value. Type the value that indicates when to clear the value. For example, you might want to clear the Current Client Connections threshold when the monitored value reaches 50 percent. In this case, type 50 as the clear value.
-
Event Severity. Select the security level that you want to set for the threshold value.
-
-
You can choose instances and entities to be set with the threshold value. In the Instances section, choose one of the following options:
-
All Instances. The threshold is set for all the instances.
-
Specific Instances. The threshold is set for specific instances. Use the right arrow to move instances from the Available list to the Configured list. The threshold is set for the instances in the Configured list.
-
Specific Entities. The threshold is set for specific entities.Click Add to select the entities.A window appears with the entities list depending on the selected report type in the Report Name field. In this example, the Choose LB Virtual Servers window appears.
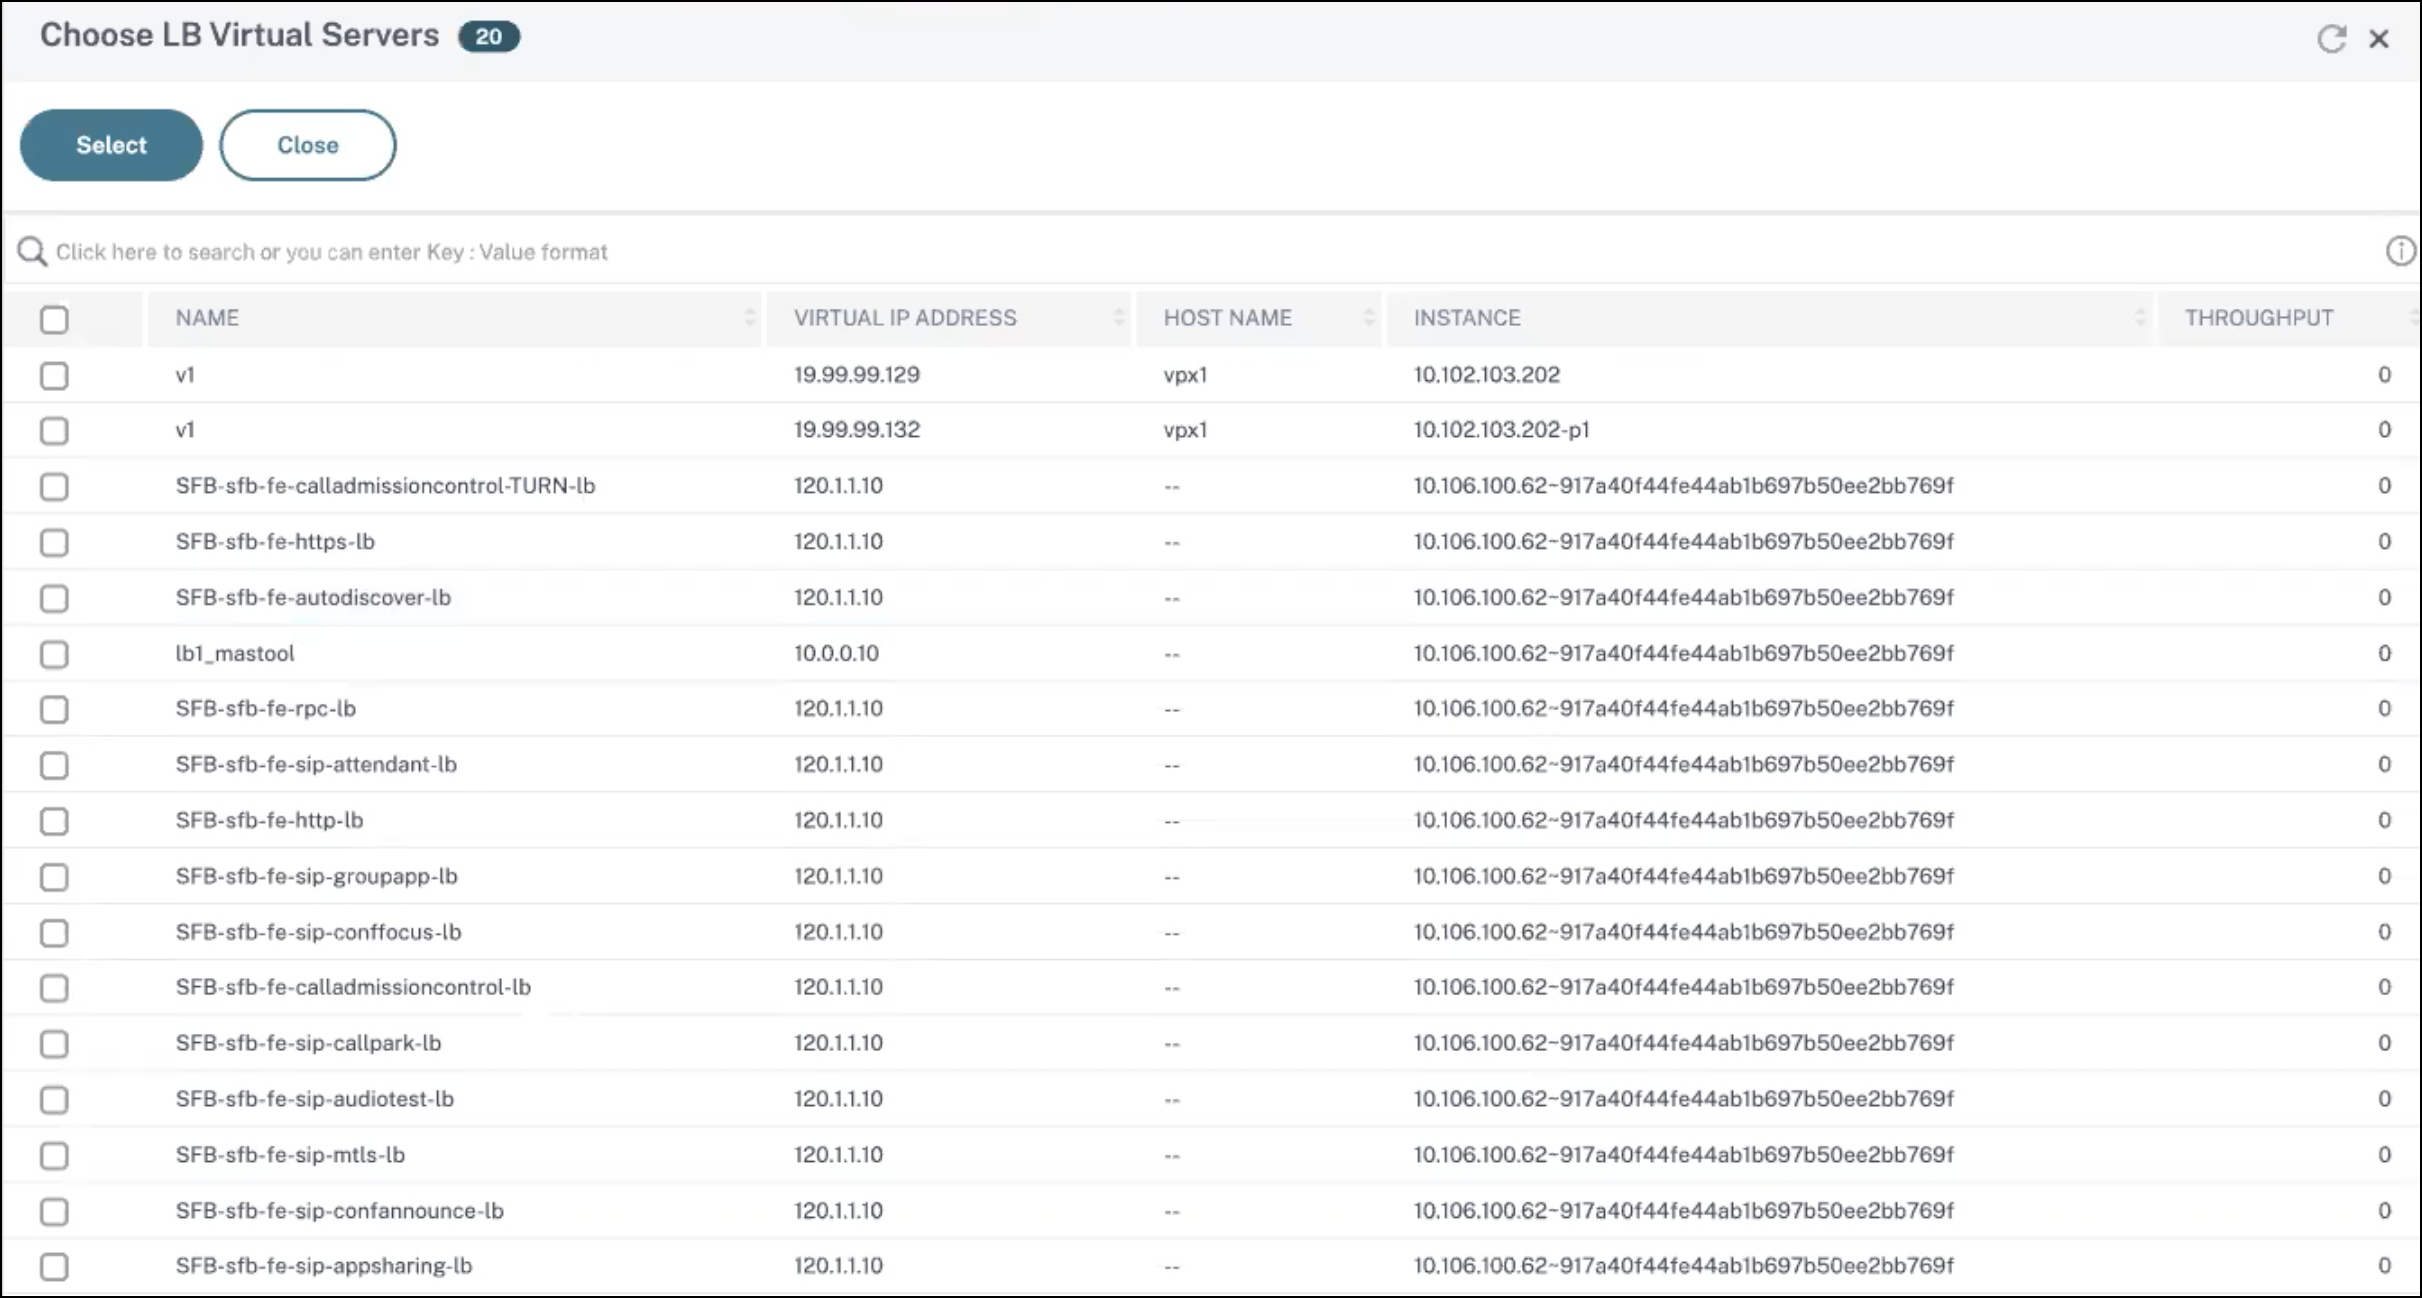 Select the entities for which you want to set a threshold. Click Select. The selected entities appear in the Instances section.NoteThe Specific Entities option appear only if you select vserver based reports in Report Name. For example, if you select LB Service Statistics
-
-
You can also add an Event Message. Type a message that you want to appear when the threshold is reached. NetScaler ADM appends the monitored value and the threshold value to this message.
-
Select Enable to enable the threshold to generate alarms.
-
Optionally, you can configure Actions such as email or Slack notifications or both email and Slack notifications.
-
Click Create.
Set Performance Polling Interval for Network Reports
By default, every 5 minutes, NITRO calls collect performance data for network reporting. ADM retrieves instance statistics such as counter information and aggregates them based on per minute, per hour, per day, or per week. You can view this aggregated data in predefined reports.
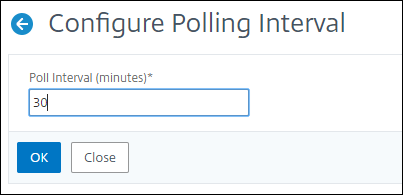
To set the performance polling interval, navigate to Infrasturcture > Network Reporting and click Configure Polling Interval. Your polling interval cannot be less than 5 minutes or more than 60 minutes.
Configuring Network Reporting Prune Settings
You can configure the purge interval of network reporting data in NetScaler ADM. This setting limits the amount of network reporting data being stored in the NetScaler ADM server's database. By default, pruning happens every 24 hours (at 01.00 hours) for the network reporting historical data.
Note
The value that you can specify cannot exceed 30 days or be less than 1 day.