
Viewing HDX™ Insight reports and metrics
HDX insight provides complete visibility of the reports and metrics pertaining to HDX traffic on your NetScaler instances.
You can view the HDX metrics for any selected entity. The views include the following categories of entities:
-
Users: Displays the reports for all the users accessing the Citrix Virtual App or Desktop within the selected time interval.
-
Applications: Displays the reports for total number of applications, and all related relevant information like the total number of times the applications were launched within the specified time interval.
-
Instances: Displays the reports on the NetScaler instances that act as gateways for incoming traffic.
-
Desktops: Displays the reports for the desktops used in the selected time frame.
-
Licenses: Displays the reports for total SSL VPN licenses used within the specified time slot.
User view reports and metrics
The reports and metrics in this view are displayed per Citrix Virtual Apps and Desktops user.
To navigate to the users view:
-
Navigate to Gateway > HDX Insight > Users
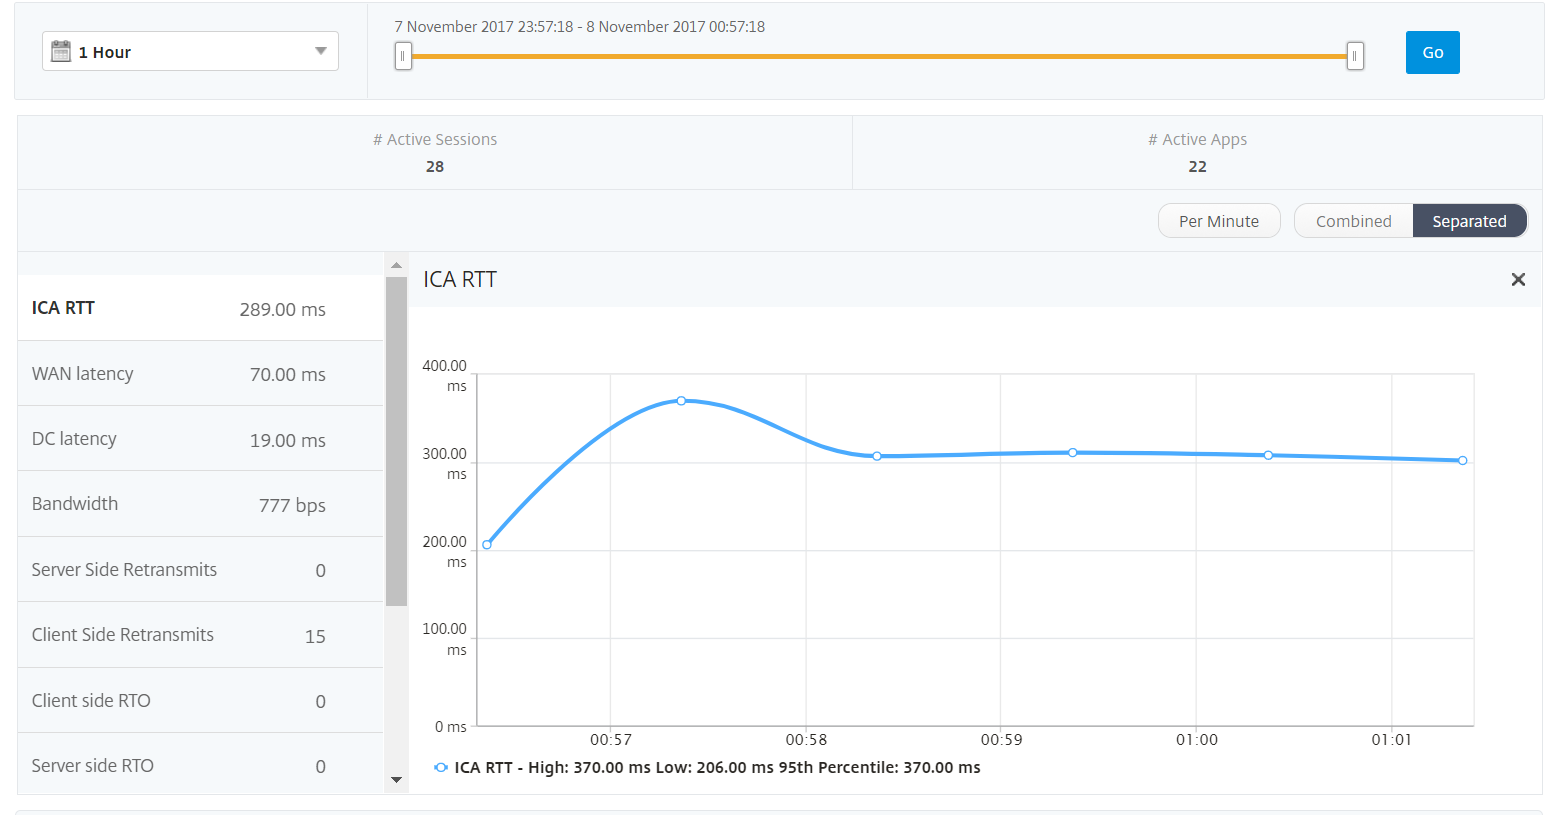
User view reports and metrics consist of the following sections:
Summary view
The summary view displays the reports for all the users that have logged in during the selected timeline. All the metrics/reports in this view display the values corresponding to them for the selected time period unless specified otherwise.
To change the selected time period:
-
Use the time period list or the time slider to set the desired time interval.
-
Click Go.
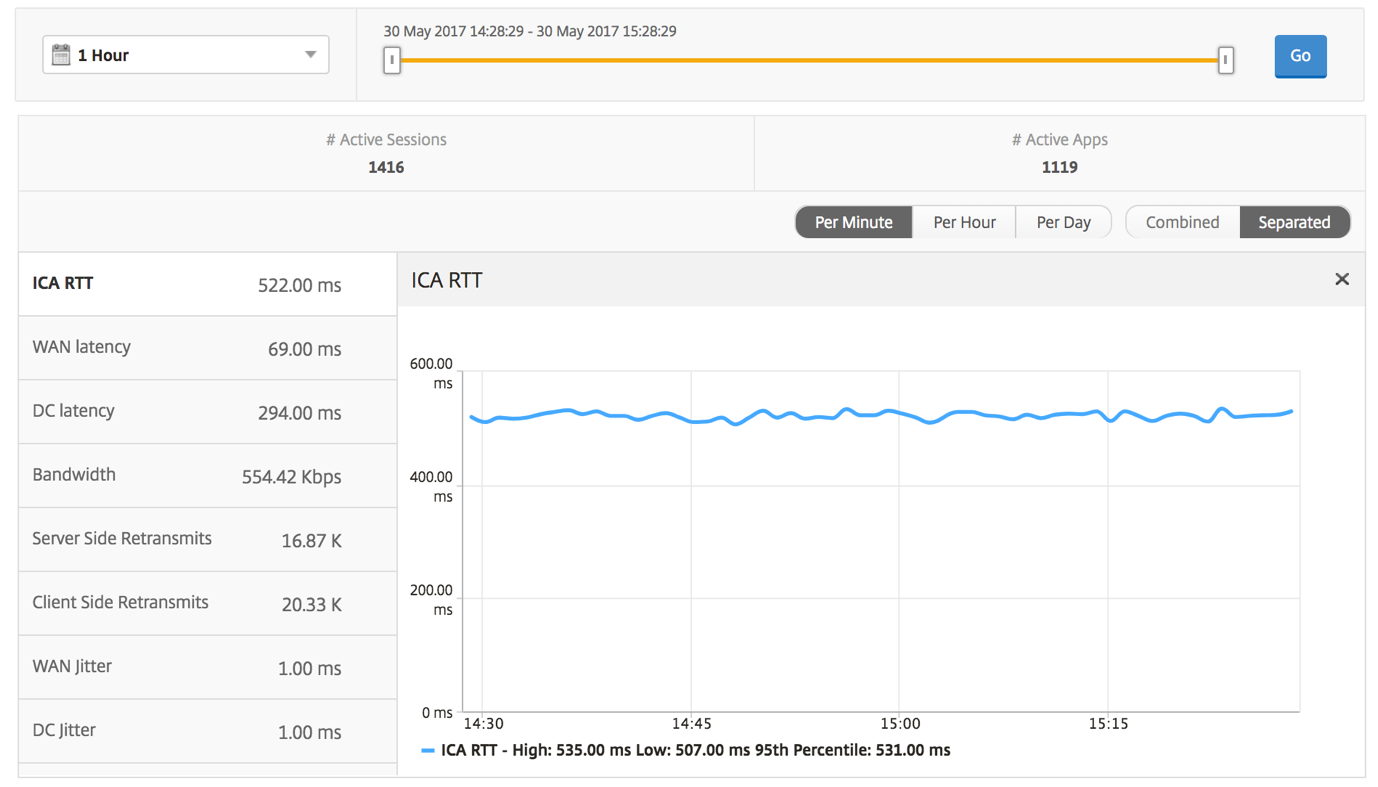
Line chart
| Metrics | Description |
|---|---|
| # Active Sessions | This number indicates the count of active Citrix Virtual Apps and Desktops sessions. |
| # Active Apps | This number indicates the count of active Citrix Virtual App sessions. |
| ICA RTT | ICA RTT is the screen lag that the user experiences while interacting with an application or desktop hosted on Citrix Virtual App or Desktop respectively. |
| WAN latency | Latency caused by the client side of the network. That is, from NetScaler to end user. |
| DC latency | Latency caused by the server side of the network. That is, between NetScaler Gateway and VDI OR CVAD or StoreFront servers. |
| Bandwidth | Total bytes per second taken for end-to-end communication during the selected time interval. |
| Server Side Retransmits | The number of packets retransmitted on the connection between NetScaler and back end server. |
| Client Side Retransmits | The number of packets retransmitted on the connection between NetScaler and the end user. A high value of this metric does not mean that the user experience will not be seamless but indicates high bandwidth utilization due to retransmits. |
| Client side fast RTO | Number of times the retransmission timeout occurred the connection between NetScaler and the end user. |
| Server side fast RTO | Number of times the retransmission timeout occurred on the connection between NetScaler and back end server. |
| Client side Zero Window size event | This counter indicates the number of times the client advertised a zero TCP window. |
| Server side Zero Window size event | This counter indicates the number of times the server advertised a zero TCP window. |
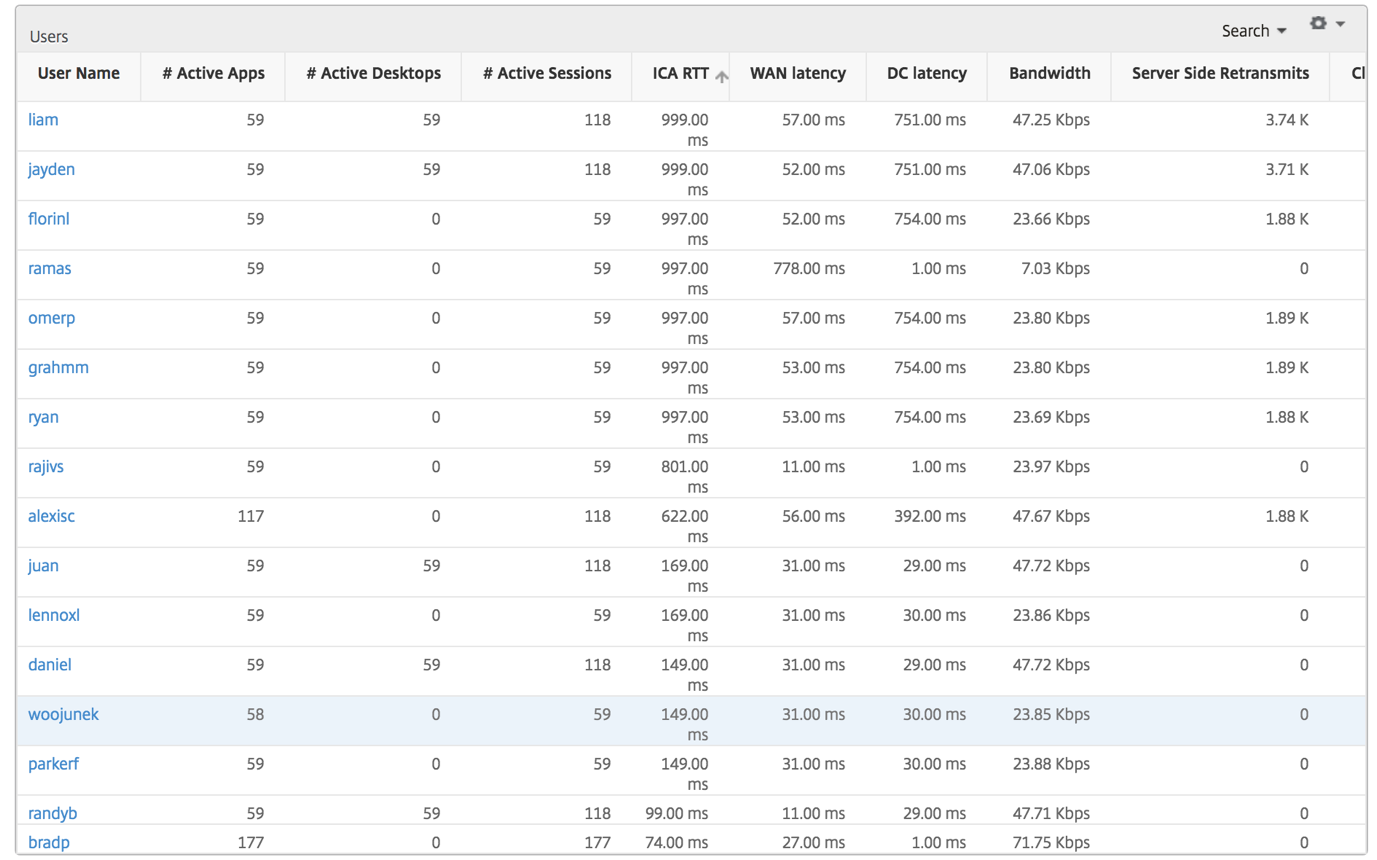
User summary report
Following are the metrics that are specific to this report.
| Metrics | Description |
|---|---|
| # Active Sessions | This number indicates the count of active Citrix Virtual Apps and Desktops sessions. |
| # Active Apps | This number indicates the count of active Citrix Virtual App sessions. |
| ICA RTT | ICA RTT is the screen lag that the user experiences while interacting with an application or desktop hosted on Citrix Virtual App or Desktop respectively. |
| WAN latency | Latency caused by the client side of the network. That is, from NetScaler to end user. |
| DC latency | Latency caused by the server side of the network. That is, between NetScaler Gateway and VDI or CVAD or StoreFront servers. |
| Bandwidth | Total bytes per second taken for end-to-end communication during the selected time interval. |
| Server Side Retransmits | The number of packets retransmitted on the connection between NetScaler and back end server. |
| Client Side Retransmits | The number of packets retransmitted on the connection between NetScaler and the end user. A high value of this metric does not mean that the user experience will not be seamless but indicates high bandwidth utilization due to retransmits. |
| Client side fast RTO | Number of times the retransmission timeout occurred the connection between NetScaler and the end user. |
| Server side fast RTO | Number of times the retransmission timeout occurred on the connection between NetScaler and back end server. |
| Client side Zero Window size event | This counter indicates the number of times the client advertised a zero TCP window. |
| Server side Zero Window size event | This counter indicates the number of times the server advertised a zero TCP window. |
| Total App Launch Count | Total Apps launched by the user during the selected time period. |
| Total Bytes | Total Bytes consumed by the user during the selected time period. |
| Active Desktops | Total number of active Citrix Virtual Desktops during a given time interval. |
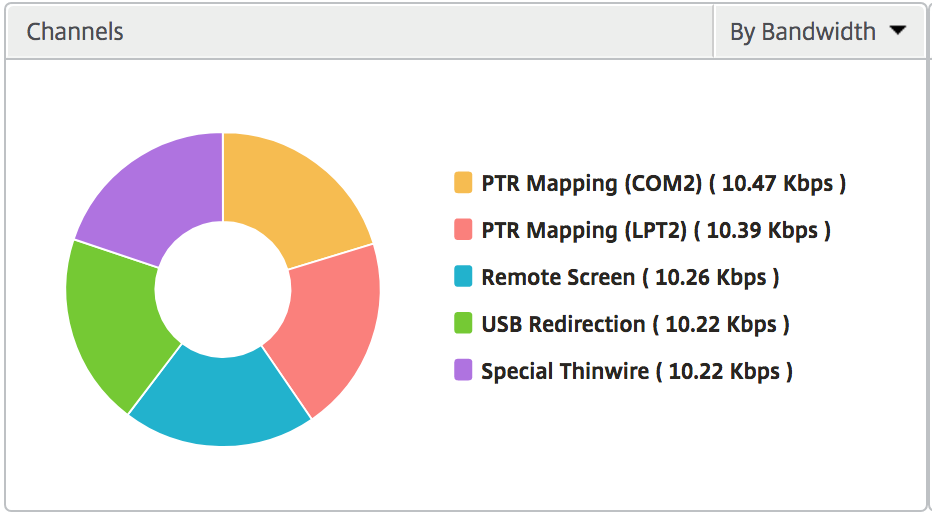
Channels
Channels represent the overall bandwidth or the total bytes consumed by each ICA® virtual channel in the form of a doughnut chart. You can also sort the metrics by bandwidth, or Total bytes.
User agents
User agents represent the overall bandwidth/total bytes consumed by each workspace client in the form of a doughnut chart. Each colored segment in the chart represents one workspace client. The length of the segment depends on the number of users launching their applications on that workspace client. You can also sort the metrics by bandwidth, or total bytes.
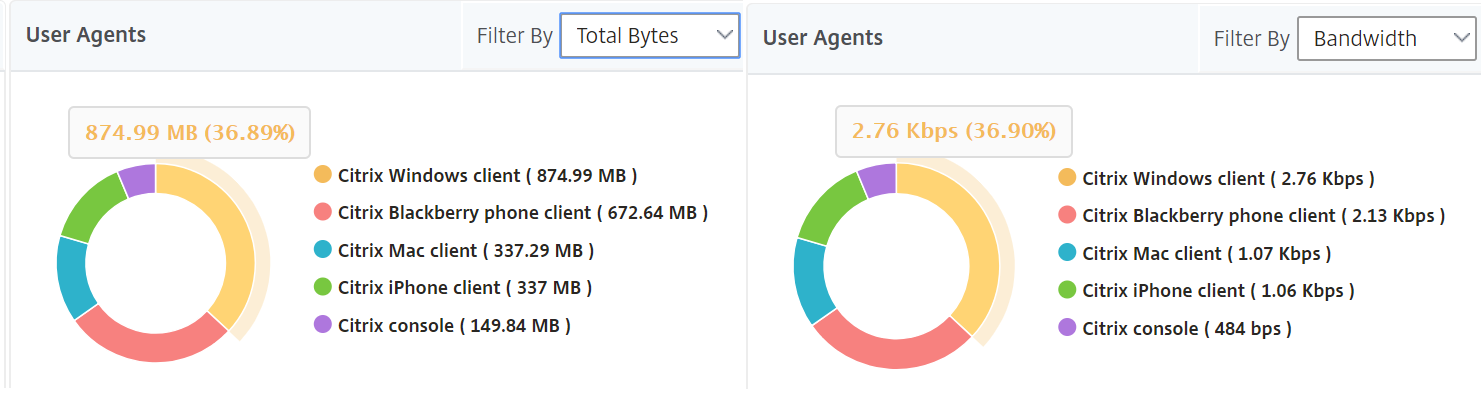
Click each segment to view the details of the users using that workspace client.

Thresholds breach count
The Thresholds breach count metrics represent the count of thresholds breached in the selected time period.
World map
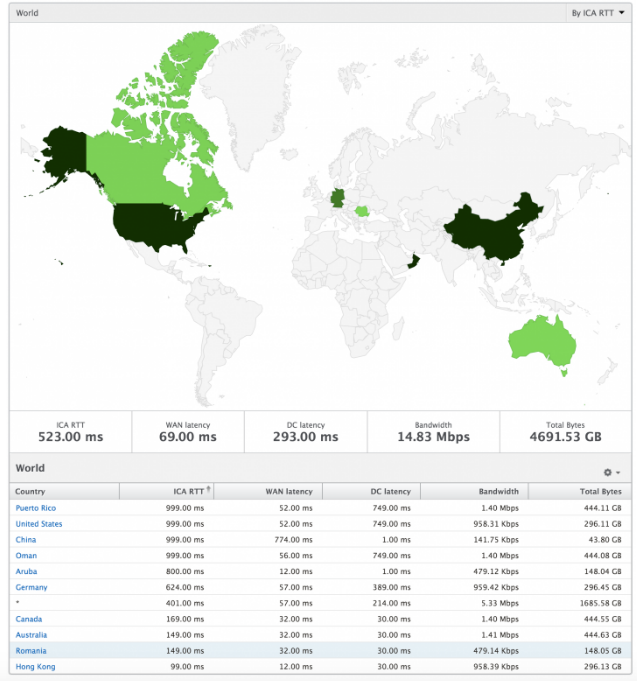
The World map view in HDX insight allows the administrators to view the historical and active users details from a geographical point of view. The administrators can have a World view of the system, drill down to a particular country and further into cities as well by simply clicking the region. The administrators can further drill down to view information by city and state. From NetScaler ADM version 12.0 and later, you can drill down to users connected from a Geo location.
The following details can be viewed on the World Map in HDX insight, and the density of each metric is displayed in the form of a heat map:
-
ICA RTT
-
WAN Latency
-
DC Latency
-
Bandwidth
-
Total Bytes
Per User view
The per user view provides detailed end user experience reporting for any particular selected user.
To navigate to specific user’s metrics:
-
Log on to your NetScaler® ADM using a supported web browser.
-
Navigate to Gateway > HDX Insight > Users.
-
Select a particular user from the Users summary report.
Line chart
Line chart displays the summary of all the metrics for the particular selected user during the selected time period.
Current/Terminated sessions report
This report is pertinent to all current/terminated user sessions for the selected user. These metrics can be sorted by start time, session reconnects and ACR count.
| Metrics | Description |
|---|---|
| Session ID | A unique identity for an ICA session. |
| Session Type | Application/Desktop. |
| State | Green/Red for active/Inactive sessions. |
| Host Delay | Average delay in ICA traffic that passes through the NetScalers caused by server network. |
| Bandwidth per Interval | The bandwidth consumed by the session during that particular interval of time. |
| Session Bandwidth | The bandwidth consumed by the session irrespective of the interval of time. |
| Bytes per Interval | Number of bytes consumed by the session during that particular interval of time. |
| Start Time | Session start time. |
| Up Time | Session duration. |
| Client IP Address | End user IP. |
| Server IP Address | Backend/ Citrix Virtual App server IP. |
| NetScaler IP Address | NetScaler Management IP (NSIP). |
| Client Type | Workspace type- Citrix Windows Client and so on |
| Client Version | Workspace version. |
| MSI | Boolean (Yes/No). Indicates if the session is multi-stream ICA. |
| Session Reconnects | Number of times the session reconnected. |
| ACR Counts | Total number of times a client automatically reconnects users to disconnected sessions. |
| User Access Type | Displays the mode of access of the ICA session. For example, NetScaler Gateway user/transparent mode. |
| Country | Country from which the session was established. |
| Region | Region from which the session was established. |
| City | City from which the session was established. |
| USB Status | Active/Inactive -Green/Red. |
| Number of USB Instances Accepted | The count of USB instances accepted. |
| Number of USB Instances Rejected | The count of USB instances rejected. |
| Number of USB Instances Stopped | The count of USB instances stopped. |
| Client Host Name | The host name of the client. |
| HA Failover Count | Number of times HA failover occurred. |
| Reason for termination | Displays the reason for a session termination. For example, ICA Session Timeout, Session terminated by the user. |
| ICA RTT | ICA RTT is the screen lag that the user experiences while interacting with an application or desktop hosted on Citrix Virtual App or Desktop respectively. |
| WAN latency | Latency caused by the client side of the network. That is, from NetScaler to end user. |
| DC latency | Latency caused by the server side of the network. That is, between NetScaler Gateway and VDI or CVAD or StoreFront servers. |
| Total Bytes | Total Bytes consumed by the user during the selected time period. |
| Server Side Retransmits | The number of packets retransmitted on the connection between NetScaler and back end server. |
| Client Side Retransmits | The number of packets retransmitted on the connection between NetScaler and the end user. A high value of this metric does not mean that the user experience will not be seamless but indicates high bandwidth utilization due to retransmits. |
| Client side Zero Window size event | This counter indicates the number of times the client advertised a zero TCP window. |
| Client side fast RTO | Number of times the retransmission timeout occurred the connection between NetScaler and the end user. |
| Server side Zero Window size event | This counter indicates the number of times the server advertised a zero TCP window. |
| Server side fast RTO | Number of times the retransmission timeout occurred on the connection between NetScaler and back end server. |
Support for EDT in HDX insight
NetScaler Application Delivery Management (ADM) now supports enlightened data transport (EDT) for displaying analytics for HDX Insight. That is, ADM now supports both UDP and TCP protocol. EDT support for NetScaler Gateway ensures a high definition in-session user experience of virtual desktops for users running Citrix Workspace.
HDX Insight now displays the number of EDT sessions and non-EDT sessions as part of the active sessions report. The Users table displays a detailed report of all the users in the system. The table shows metrics such as WAN latency, DC latency, retransmits, RTOs and some of these metrics are not available for users who do have EDT sessions as they are calculated from the TCP stack currently. Therefore, they appear as "NA".
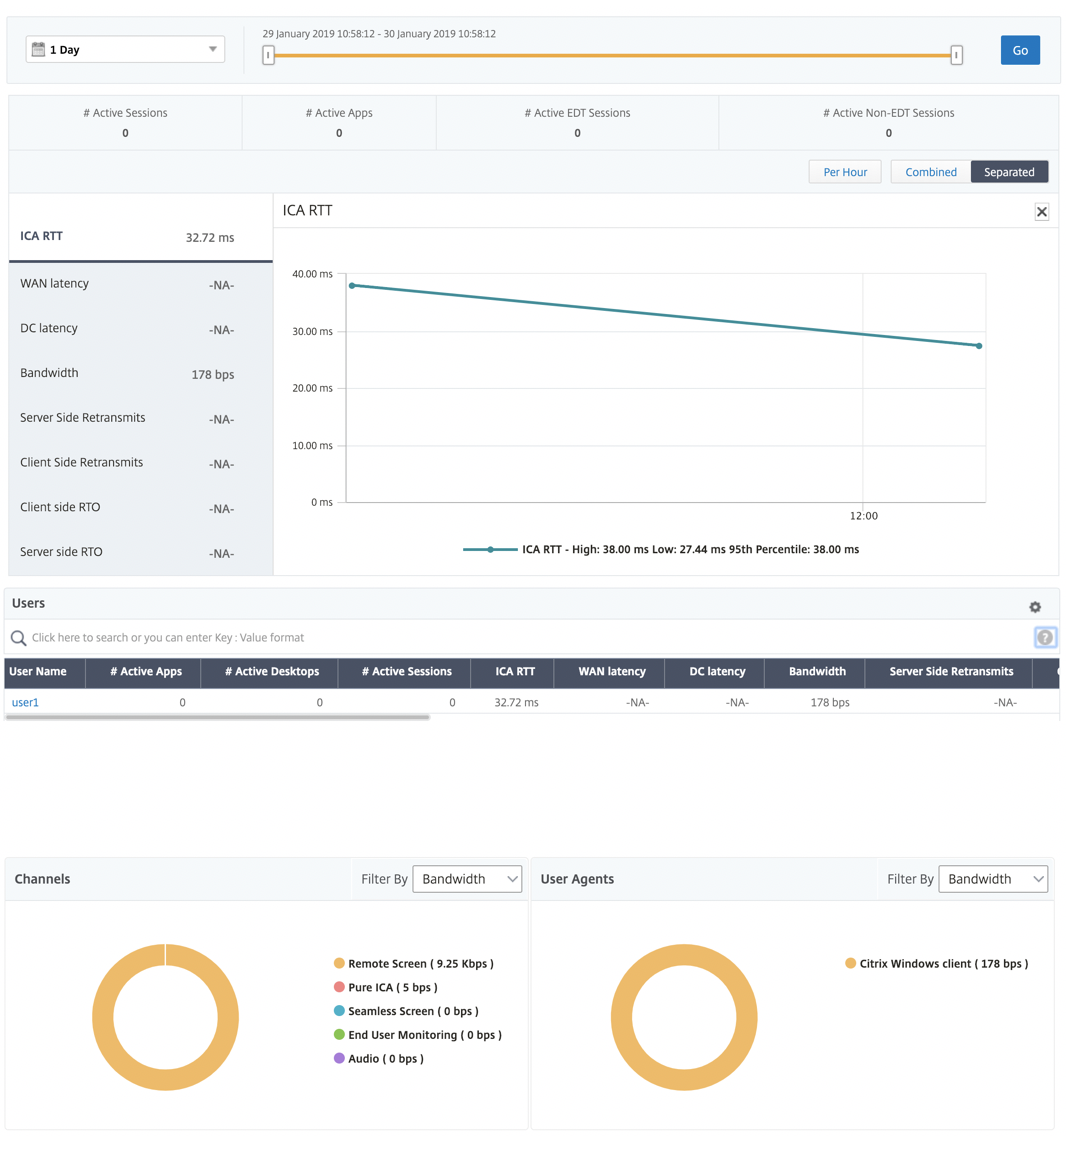
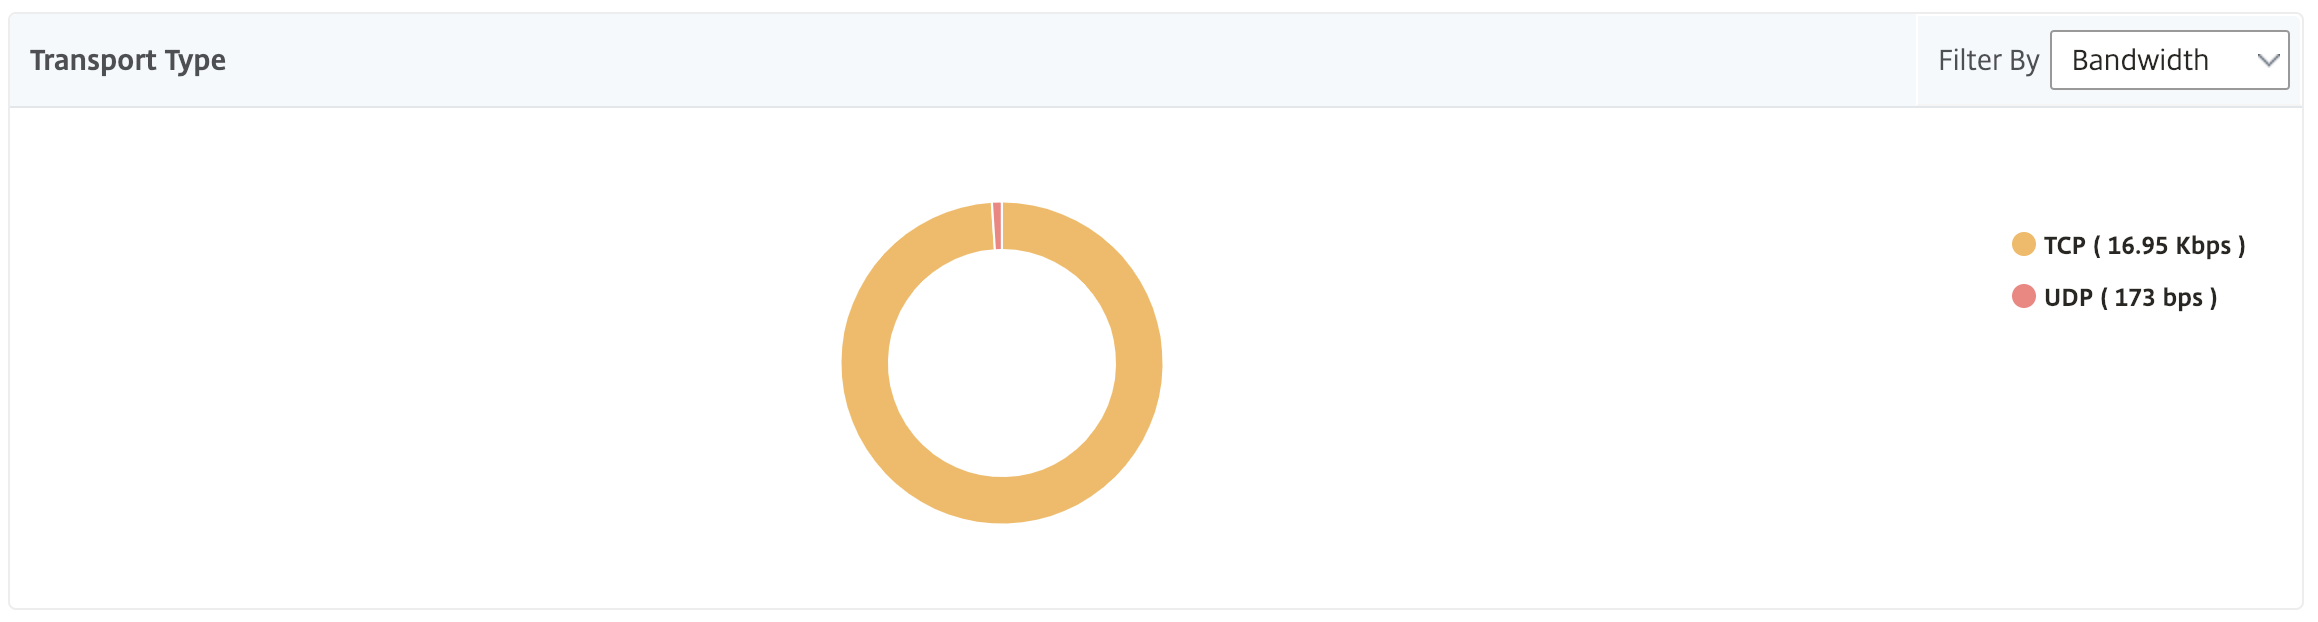
A new donut chart has been introduced to allow you to see bandwidth consumed by the user and also the total number of bytes based on the type of protocol used by the users.
Note
EDT in HDX Insight is supported on NetScaler ADM from release 12.1 build 50.28 and is available on ADC instances from release 12.1 build 49.23.
HDX Insight metrics available from NetScaler ADM 12.0 and later:
| L7 Client-side Latency | The average L7 latency observed between the ICA client and the NetScaler instance. This metric is useful in case of non-Citrix devices being present in the delivery path. |
|---|---|
| L7 Server-side Latency | The average L7 latency observed between the NetScaler device and the Citrix Virtual App. This metric is useful in case of non-Citrix devices being present in the delivery path. |
| Maximum Breach Latency | The highest value of the L7 latency when a breach of a defined threshold for a set time interval occurs. |
| Average Breach Latency | The average value of L7 latency when the system is in a "L7 latency breached" state. |
| L7 Threshold Breach Count | The number of times a L7 threshold breach has occurred. |


Desktop users
This table gives the insight into the Citrix Virtual Desktop sessions for a particular user. These metrics can be sorted by Desktop Launch Count and Bandwidth.
| Metrics | Description |
|---|---|
| Name | Name of the Citrix Virtual Desktop. |
| Desktop Launch Count | Number of times the desktop has launched. |
| Bandwidth | Total bytes per second taken for end-to-end communication during the selected time interval. |
| DC latency | Latency caused by the server side of the network. between NetScaler Gateway and VDI or CVAD or StoreFront servers. |
| WAN latency | Latency caused by the client side of the network. That is, from NetScaler to end user. |
| ICA RTT | ICA RTT is the screen lag that the user experiences while interacting with an application or desktop hosted on Citrix Virtual App or Desktop respectively. |

Applications
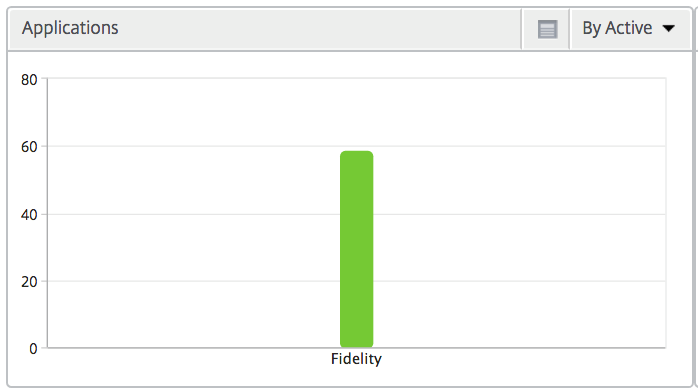
A bar graph representing apps sorted by Active, total session launch count, total app launch count, and launch duration.
Instances
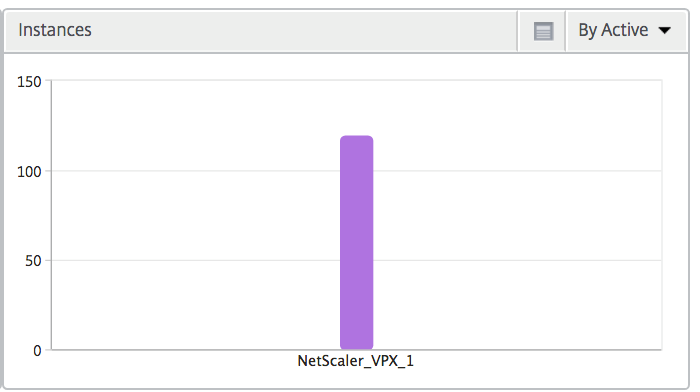
A bar graph representing NetScaler instances sorted by Active and total apps
Channels
Channels represent the overall bandwidth or the total bytes consumed by each ICA virtual channel in the form of a doughnut chart. You can also sort the metrics by bandwidth, or Total bytes.
User agents
User Agents represent the overall bandwidth/total bytes consumed by each end point in the form of a doughnut chart. You can also sort the metrics by bandwidth, or Total bytes.
Per User session view
The per user session view provides reporting for a particular selected user’s session.
To view the metrics for a selected user’s session:
-
Navigate to Gateway > HDX Insight > Users.
-
Select a particular user from the User Summary Report section.
-
Select a session from Current Sessions or Terminated Sessions column.
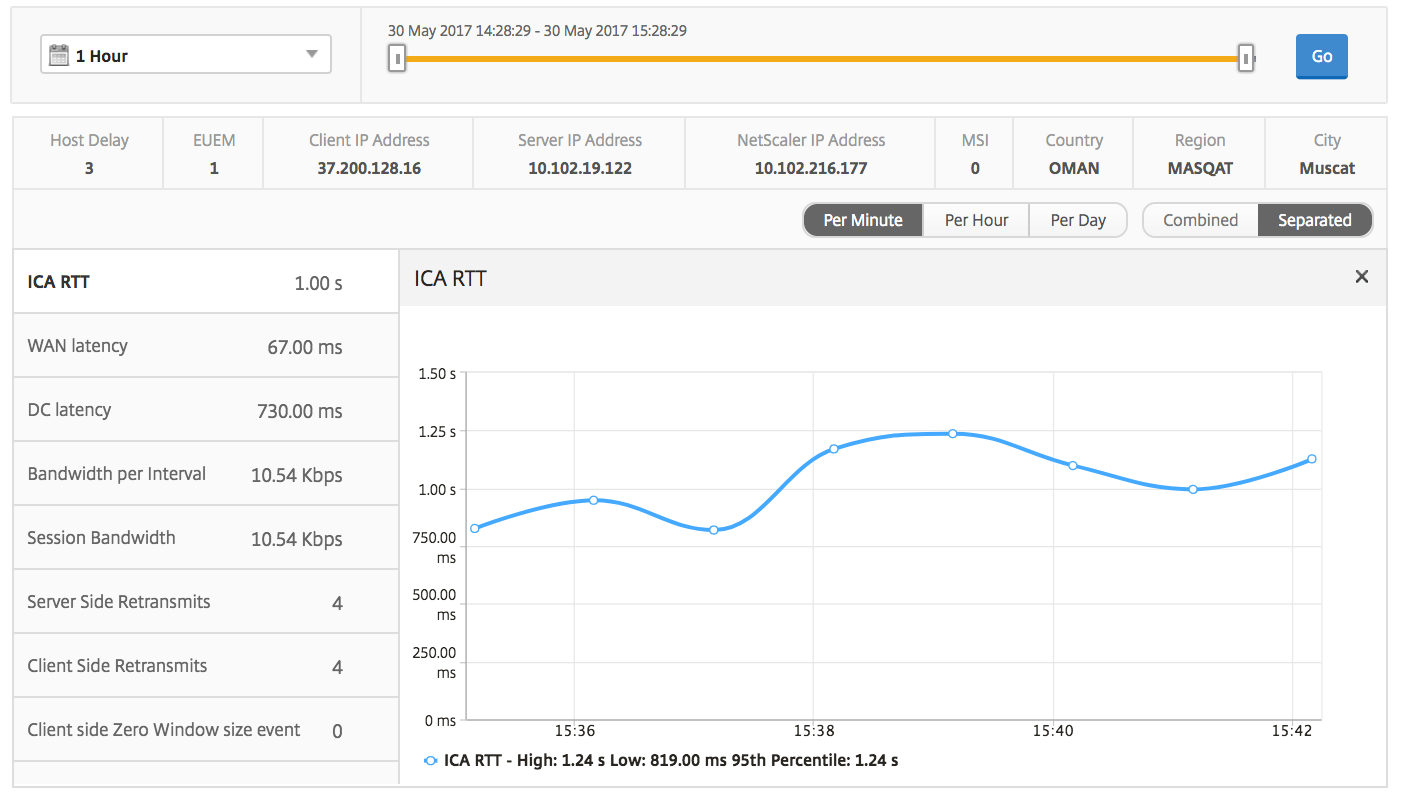
Timeline chart
| Metrics | Description |
|---|---|
| Session Reconnects | This number indicates the count of active Citrix Virtual Apps and Desktops sessions. |
| ACR Counts | This number indicates the count of active Citrix Virtual App sessions. |
| ICA RTT | ICA RTT is the screen lag that the user experiences while interacting with an application or desktop hosted on Citrix Virtual Apps or Desktops respectively. |
| WAN latency | Latency caused by the client side of the network. That is, from NetScaler to end user. |
| DC latency | Latency caused by the server side of the network. between NetScaler Gateway and VDI or CVAD or StoreFront servers. |
| Session Bandwidth | The bandwidth consumed by the session irrespective of the interval of time. |
| Server Side Retransmits | The number of packets retransmitted on the connection between NetScaler and back end server. |
| Client Side Retransmits | The number of packets retransmitted on the connection between NetScaler and the end user. A high value of this metric does not mean that the user experience will not be seamless but indicates high bandwidth utilization due to retransmits. |
| Client side fast RTO | Number of times the retransmission timeout occurred the connection between NetScaler and the end user. |
| Server side fast RTO | Number of times the retransmission timeout occurred on the connection between NetScaler and back end server. |
| Bandwidth per Interval | The bandwidth consumed by the session during that particular interval of time. |
| Server side Zero Window size event | This counter indicates the number of times the server advertised a zero TCP window. |
| Client side Zero Window size event | This counter indicates the number of times the client advertised a zero TCP window. |
Active application
The Active Applications section displays the active applications of the selected user. These applications can also be sorted by number of active sessions and launch durations.

Related sessions
The related Sessions section displays the related sessions of the selected user’s sessions. The relationship can be selected as common servers or common NetScaler.

Application view reports and metrics
The reports and metrics in this view are focused on the Citrix Virtual Apps.
To navigate to the Application view:
-
Navigate to Gateway > HDX Insight > Applications.
Summary view
The summary view displays the reports for all the applications that are logged in during the selected timeline.
All the metrics/reports, unless explicitly mentioned will have the values corresponding to them for the select time period.
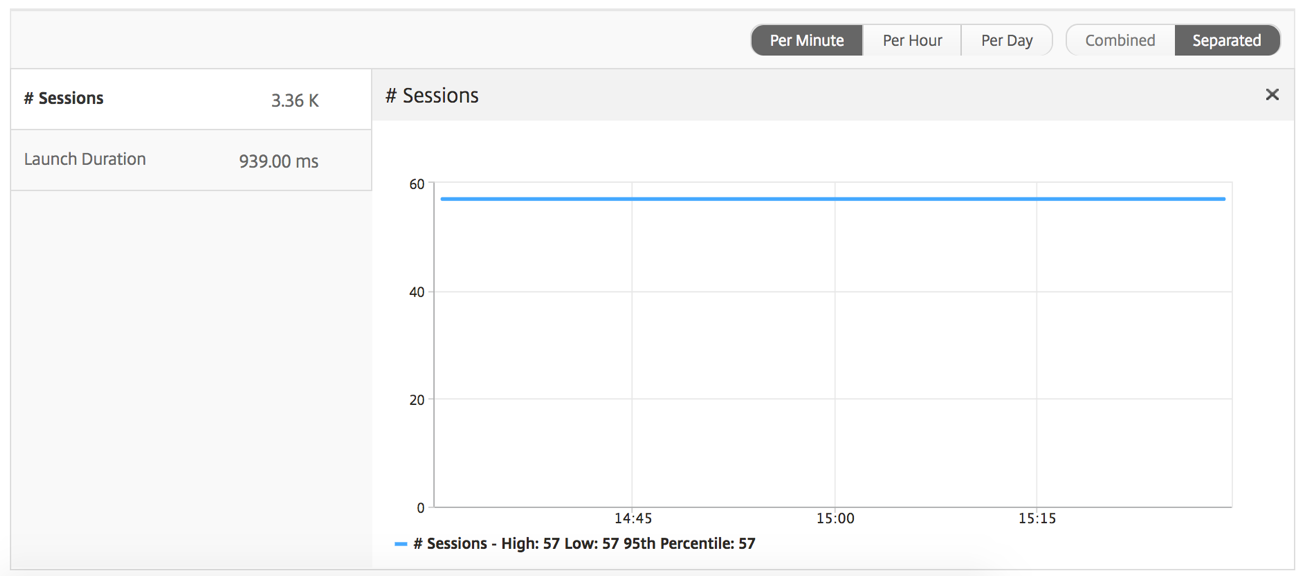
Line chart
| Metrics | Description |
|---|---|
| # Sessions | Total number of sessions during a given time interval. |
| Launch duration | Average time taken to launch an application. |
Applications summary report
| Metrics | Description |
|---|---|
| Name | Name of the Citrix Virtual App. |
| Total Session Launch count | Total number of active Citrix Virtual App sessions during the given time interval. |
| Total App Launch Count | Total number of Citrix Virtual App applications launched during the given time interval. |
| Launch Duration | Average time taken to launch the Citrix Virtual App. |

Active application report
| Metrics | Description |
|---|---|
| Name | Name of the Citrix Virtual App. |
| State | Displays the state of the application: Green-Active, Red-Inactive |
| #Active Sessions | Number of active user sessions using this app during a given time interval. |
| #Active Apps | Number of active sessions for this application. |

Threshold report
The Threshold Report represents the count of thresholds breached where the entity is selected as Application in the selected period. For more information, see how to create thresholds.
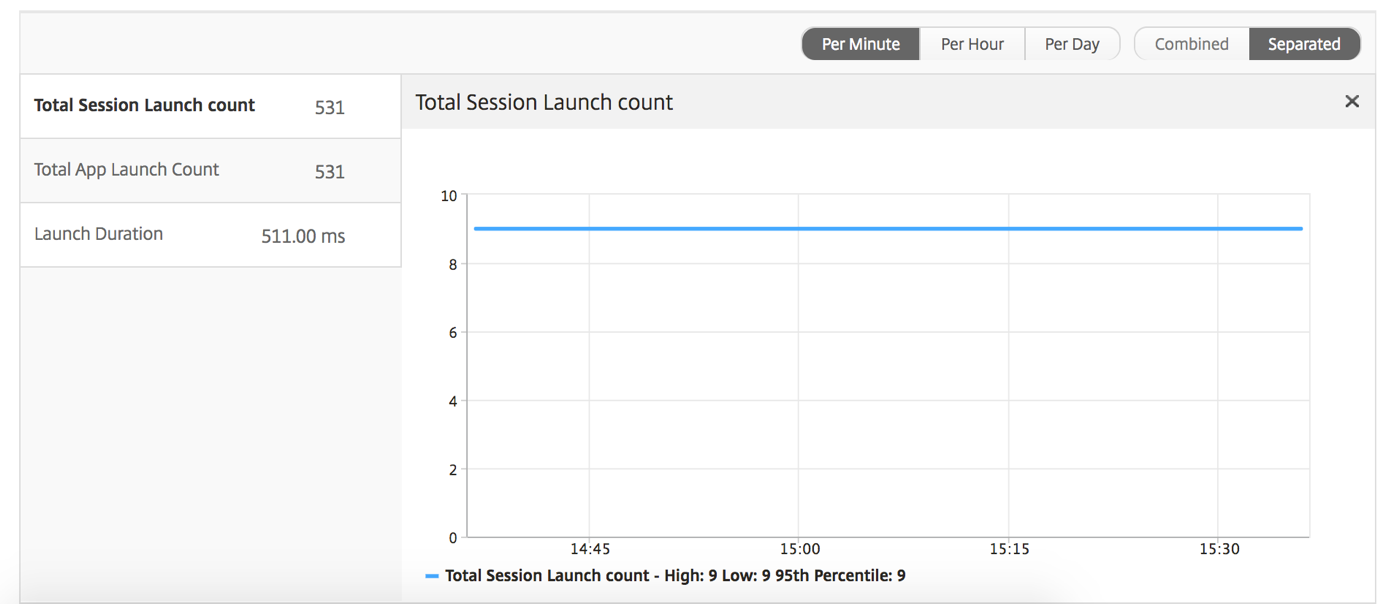
Line chart
| Metrics | Description |
|---|---|
| # Active Sessions | This number indicates the count of active Citrix Virtual Apps and Desktops sessions. |
| Launch duration | Average time taken to launch an application. |
Current sessions report
| Metrics | Description |
|---|---|
| Session ID | A unique identity for an ICA session. |
| Session Type | Application/Desktop. |
| State | Green/Red for active/Inactive sessions. |
| Host Delay | Average delay in ICA traffic that passes through the NetScalers caused by server network. |
| Bandwidth per Interval | The bandwidth consumed by the session during that particular interval of time. |
| Session Bandwidth | The bandwidth consumed by the session irrespective of the interval of time. |
| Bytes per Interval | Number of bytes consumed by the session during that particular interval of time. |
| Start Time | Session start time. |
| Up Time | Session duration. |
| Client IP Address | End user IP. |
| Server IP Address | Backend/ Citrix Virtual App server IP. |
| NetScaler IP Address | NetScaler Management IP (NSIP). |
| Client Type | Workspace type- Citrix Windows Client and so on |
| Client Version | Workspace version. |
| MSI | Boolean (Yes/No). Indicates if the session is multi-stream ICA. |
| Session Reconnects | Number of times the session reconnected. |
| ACR Counts | Total number of times a client automatically reconnects users to disconnected sessions. |
| User Access Type | Displays the mode of access of the ICA session. For example, NetScaler Gateway user/transparent mode. |
| Country | Country from which the session was established. |
| Region | Region from which the session was established. |
| City | City from which the session was established. |
| USB Status | Active/Inactive -Green/Red. |
| Number of USB Instances Accepted | The count of USB instances accepted. |
| Number of USB Instances Rejected | The count of USB instances rejected. |
| Number of USB Instances Stopped | The count of USB instances stopped. |
| Client Host Name | The host name of the client. |
| HA Failover Count | Number of times HA failover occurred. |
| Reason for termination | Displays the reason for a session termination. For example, ICA Session Timeout, Session terminated by the user. |
| ICA RTT | ICA RTT is the screen lag that the user experiences while interacting with an application or desktop hosted on Citrix Virtual Apps or Desktops respectively. |
| WAN latency | Latency caused by the client side of the network. That is, from NetScaler to end user. |
| DC latency | Latency caused by the server side of the network. That is, between NetScaler Gateway and VDI or CVAD or StoreFront servers. |
| Total Bytes | Total Bytes consumed by the user during the selected time period. |
| Server Side Retransmits | The number of packets retransmitted on the connection between NetScaler and back end server. |
| Client Side Retransmits | The number of packets retransmitted on the connection between NetScaler and the end user. A high value of this metric does not mean that the user experience will not be seamless but indicates high bandwidth utilization due to retransmits. |
| Client side Zero Window size event | This counter indicates the number of times the client advertised a zero TCP window. |
| Client side fast RTO | Number of times the retransmission timeout occurred the connection between NetScaler and the end user. |
| Server side Zero Window size event | This counter indicates the number of times the server advertised a zero TCP window. |
| Server side fast RTO | Number of times the retransmission timeout occurred on the connection between NetScaler and back end server. |
| User Name | The user name of the user accessing this particular Citrix Virtual App. |
| Session ID | Unique identifier for the Citrix Virtual App session. |
| Session Type | Will be “Application”. |
| State | Session state: Green for active, Red for in-active. |
| Maximum Breach Latency | The highest value of the L7 latency when a breach of a defined threshold for a set time interval occurs. |
| Average Breach Latency | The average value of L7 latency when the system is in a "L7 latency breached" state. |
| L7 Threshold Breach Count | The number of times a L7 threshold breach has occurred. |
| L7 Client-side Latency | The average L7 latency observed between the ICA client and the NetScaler instance. This metric is useful in case of non-Citrix devices being present in the delivery path. |
| L7 Server-side Latency | The average L7 latency observed between the NetScaler device and the Citrix Virtual App. This metric is useful in case of non-Citrix devices being present in the delivery path. |

Per application session view
The per application session view displays reports for a particular selected application session.
To view the Session reports:
-
Log on to your NetScaler ADM using a supported web browser.
-
Navigate to Gateway > HDX Insight > Applications.
-
Select a particular user from the Application Summary Report.
-
Selected a session from current sessions report.
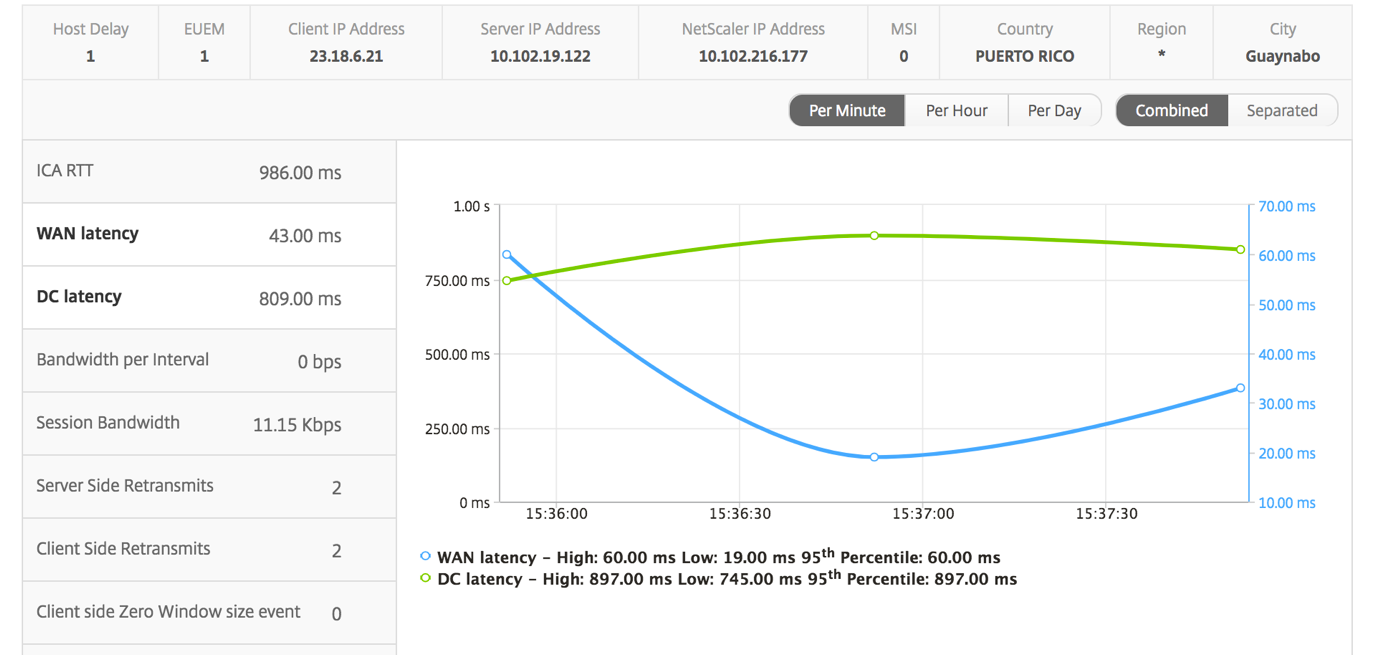
Line chart
| Metrics | Description |
|---|---|
| Session Reconnects | Number of times the session reconnected. |
| ACR Counts | Total number of times a client automatically reconnects users to disconnected sessions. |
| ICA RTT | ICA RTT is the screen lag that the user experiences while interacting with an application or desktop hosted on Citrix Virtual Apps and Desktops respectively. |
| WAN latency | Latency caused by the client side of the network. That is, from NetScaler to end user. |
| Server side Zero Window size event | Latency caused by the server side of the network. That is, from NetScaler to back end servers. |
| Bandwidth per Interval | The bandwidth consumed by the session during that particular interval of time. |
| Server Side Retransmits | The number of packets retransmitted on the connection between NetScaler and back end server. |
| Client Side Retransmits | The number of packets retransmitted on the connection between NetScaler and the end user. A high value of this metric does not mean that the user experience will not be seamless but indicates high bandwidth utilization due to retransmits. |
| Session Bandwidth | The bandwidth consumed by the session irrespective of the interval of time. |
| Server side Zero Window size event | This counter indicates the number of times the server advertised a zero TCP window. |
| Client side fast RTO | Number of times the retransmission timeout occurred the connection between NetScaler and the end user. |
| Server side fast RTO | Number of times the retransmission timeout occurred on the connection between NetScaler and back end server. |
| Client side Zero Window size event | This counter indicates the number of times the client advertised a zero TCP window. |
User bar graph
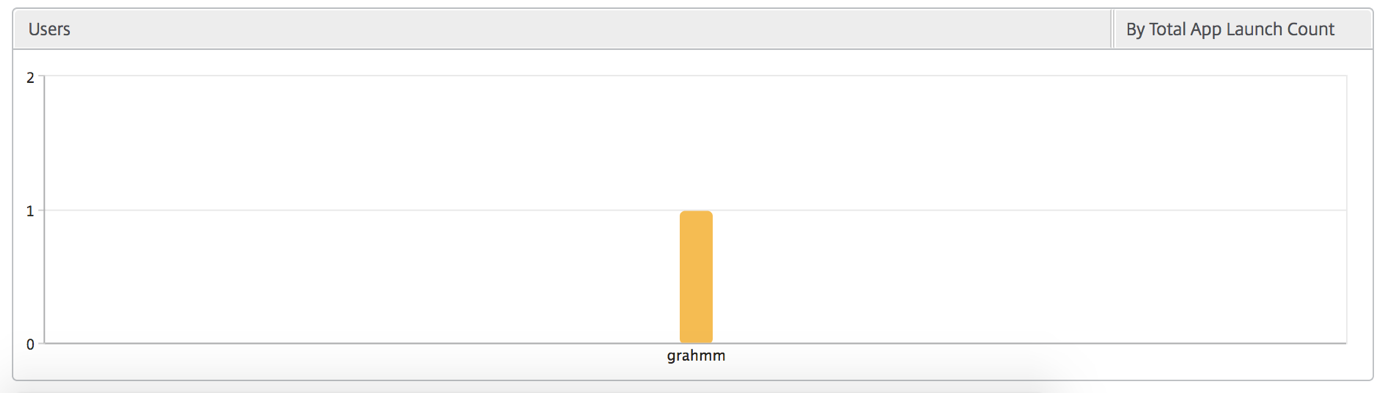
The User’s bar graph represents the users logged into this particular app.
Desktop view reports and metrics
The reports and metrics in this view are focused on the Citrix Virtual Desktops.
To navigate to the Desktop view:
-
Log on to your NetScaler ADM using a supported web browser.
-
Navigate to Gateway > HDX Insight > Desktop.
Summary view
The summary view displays the reports for all the Citrix Virtual Desktops that are logged in during the selected timeline.
All the metrics/reports, unless explicitly mentioned will have the values corresponding to them for the select time period.
Line chart
| Metrics | Description |
|---|---|
| # Active Sessions | This number indicates the count of active Citrix Virtual Apps and Desktops sessions. |
| # Active Apps | This number indicates the count of active Citrix Virtual App sessions. |
| ICA RTT | ICA RTT is the screen lag that the user experiences while interacting with an application or desktop hosted on Citrix Virtual Apps and Desktops respectively. |
| WAN latency | Latency caused by the client side of the network. That is, from NetScaler to end user. |
| DC latency | Latency caused by the server side of the network. That is, between NetScaler Gateway and VDI or CVAD or StoreFront servers. |
| Bandwidth | Total bytes per second taken for end-to-end communication during the selected time interval. |
| Server Side Retransmits | The number of packets retransmitted on the connection between NetScaler and back end server. |
| Client Side Retransmits | The number of packets retransmitted on the connection between NetScaler and the end user. A high value of this metric does not mean that the user experience will not be seamless but indicates high bandwidth utilization due to retransmits. |
| Client side fast RTO | Number of times the retransmission timeout occurred the connection between NetScaler and the end user. |
| Server side fast RTO | Number of times the retransmission timeout occurred on the connection between NetScaler and back end server. |
| Client side Zero Window size event | This counter indicates the number of times the client advertised a zero TCP window. |
| Server side Zero Window size event | This counter indicates the number of times the server advertised a zero TCP window. |
Desktop summary report
| Metrics | Description |
|---|---|
| Active Sessions | Total number of active Citrix Virtual Desktop sessions during a given time interval. |
| Active Desktops | Total number of active Citrix Virtual Desktops during a given time interval. |
| ICA RTT | ICA RTT is the screen lag that the user experiences while interacting with an application or desktop hosted on Citrix Virtual Apps and Desktops respectively. |
| WAN latency | Latency caused by the client side of the network. That is, from NetScaler to end user. |
| DC latency | Latency caused by the server side of the network. That is, between NetScaler Gateway and VDI or CVAD or StoreFront servers. |
| Bandwidth | Total bytes per second taken for end-to-end communication during the selected time interval. |
| Total Bytes | Total Bytes consumed by the user during the selected time period. |

Threshold report
The threshold report represents the count of thresholds breached where the entity is selected as Desktop in the selected period. For more information, see how to create thresholds.
Per Desktop view
Per desktop view provides detailed end user experience reporting for a selected Citrix Virtual Desktop.
To navigate to the particular Desktop view:
-
Log on to your NetScaler ADM using a supported web browser.
-
Navigate to Analytics \> HDX Insight \> Desktop.
-
Select a particular Desktop from the Desktop Summary Report.
Line chart
| Metrics | Description |
|---|---|
| # Active Sessions | This number indicates the count of active Citrix Virtual Apps and Desktops sessions. |
| # Active Apps | This number indicates the count of active Citrix Virtual App sessions. |
| ICA RTT | ICA RTT is the screen lag that the user experiences while interacting with an application or desktop hosted on Citrix Virtual Apps and Desktops respectively. |
| WAN latency | Latency caused by the client side of the network. That is, from NetScaler to end user. |
| DC latency | Latency caused by the server side of the network. That is, between NetScaler Gateway and VDI or CVAD or StoreFront servers. |
| Bandwidth | Total bytes per second taken for end-to-end communication during the selected time interval. |
| Server Side Retransmits | The number of packets retransmitted on the connection between NetScaler and back end server. |
| Client Side Retransmits | The number of packets retransmitted on the connection between NetScaler and the end user. A high value of this metric does not mean that the user experience will not be seamless but indicates high bandwidth utilization due to retransmits. |
| Client side fast RTO | Number of times the retransmission timeout occurred the connection between NetScaler and the end user. |
| Server side fast RTO | Number of times the retransmission timeout occurred on the connection between NetScaler and back end server. |
| Client side Zero Window size event | This counter indicates the number of times the client advertised a zero TCP window. |
| Server side Zero Window size event | This counter indicates the number of times the server advertised a zero TCP window. |
Desktop Users report
This table gives the insight into the Citrix Virtual Desktop sessions for a particular user. These metrics can be sorted by Desktop Launch Count and Bandwidth.
| Metrics | Description |
|---|---|
| Name | Name of the Citrix Virtual Desktop. |
| Desktop Launch Count | Number of times the desktop has launched. |
| Bandwidth | Total bytes per second taken for end-to-end communication during the selected time interval. |
| DC latency | Latency caused by the server side of the network. That is, between NetScaler Gateway and VDI or CVAD or StoreFront servers. |
| WAN latency | Latency caused by the client side of the network. That is, from NetScaler to end user. |
| ICA RTT | ICA RTT is the screen lag that the user experiences while interacting with an application or desktop hosted on Citrix Virtual Apps and Desktops respectively. |
User Desktops Active/Inactive report
These following metrics can be sorted by Bandwidth per interval, session reconnects, and ACR counts.
| Metrics | Description |
|---|---|
| Session ID | A unique identity for an ICA session. |
| Session Type | Application/Desktop. |
| State | Green/Red for active/Inactive sessions. |
| Host Delay | Average delay in ICA traffic that passes through the NetScalers caused by server network. |
| Bandwidth per Interval | The bandwidth consumed by the session during that particular interval of time. |
| Session Bandwidth | The bandwidth consumed by the session irrespective of the interval of time. |
| Bytes per Interval | Number of bytes consumed by the session during that particular interval of time. |
| Start Time | Session start time. |
| Up Time | Session duration. |
| Client IP Address | End user IP. |
| Server IP Address | Backend/ Citrix Virtual App server IP. |
| NetScaler IP Address | NetScaler Management IP (NSIP). |
| Client Type | Workspace type- Citrix Windows Client and so on |
| Client Version | Workspace version. |
| MSI | Boolean (Yes/No). Indicates if the session is multi-stream ICA. |
| Session Reconnects | Number of times the session reconnected. |
| ACR Counts | Total number of times a client automatically reconnects users to disconnected sessions. |
| User Access Type | Displays the mode of access of the ICA session. For example, NetScaler Gateway user/transparent mode. |
| Country | Country from which the session was established. |
| Region | Region from which the session was established. |
| City | City from which the session was established. |
| USB Status | Active/Inactive -Green/Red. |
| Number of USB Instances Accepted | The count of USB instances accepted. |
| Number of USB Instances Rejected | The count of USB instances rejected. |
| Number of USB Instances Stopped | The count of USB instances stopped. |
| Client Host Name | The host name of the client. |
| HA Failover Count | Number of times HA failover occurred. |
| Reason for termination | Displays the reason for a session termination. For example, ICA Session Timeout, Session terminated by the user. |
| ICA RTT | ICA RTT is the screen lag that the user experiences while interacting with an application or desktop hosted on Citrix Virtual Apps and Desktops respectively. |
| WAN latency | Latency caused by the client side of the network. That is, from NetScaler to end user. |
| DC latency | Latency caused by the server side of the network. That is, between NetScaler Gateway and VDI or CVAD or StoreFront servers. |
| Total Bytes | Total Bytes consumed by the user during the selected time period. |
| Server Side Retransmits | The number of packets retransmitted on the connection between NetScaler and back end server. |
| Client Side Retransmits | The number of packets retransmitted on the connection between NetScaler and the end user. A high value of this metric does not mean that the user experience will not be seamless but indicates high bandwidth utilization due to retransmits. |
| Client side Zero Window size event | This counter indicates the number of times the client advertised a zero TCP window. |
| Client side fast RTO | Number of times the retransmission timeout occurred the connection between NetScaler and the end user. |
| Server side Zero Window size event | This counter indicates the number of times the server advertised a zero TCP window. |
| Server side fast RTO | Number of times the retransmission timeout occurred on the connection between NetScaler and back end server. |
| VDI Image Name | Name of the Citrix Virtual Desktop to which the user is connected |
| Diagram |

Per Desktop session view
Per desktop session view provides reporting for a particular selected Citrix Virtual Desktop session.
To navigate to the Desktop session view:
-
Log on to your NetScaler ADM using a supported web browser.
-
Navigate to Analytics \> HDX Insight \> Desktop.
-
Select a particular desktop from the Desktop Summary Report.
-
Select a session from current sessions report.
Timeline chart
The per user session view provides reporting for a particular selected user’s session.
To view the metrics for a selected user’s session:
-
Log on to your NetScaler ADM using a supported web browser.
-
Navigate to Gateway > HDX Insight > Users.
-
Select a particular user from the User Summary Report section.
-
Select a session from Current Sessions or Terminated Sessions column.
| Metrics | Description |
|---|---|
| Session Reconnects | This number indicates the count of active Citrix Virtual Apps and Desktops sessions. |
| ACR Counts | This number indicates the count of active Citrix Virtual App sessions. |
| ICA RTT | ICA RTT is the screen lag that the user experiences while interacting with an application or desktop hosted on Citrix Virtual Apps and Desktops respectively. |
| WAN latency | Latency caused by the client side of the network. That is, from NetScaler to end user. |
| DC latency | Latency caused by the server side of the network. That is, between NetScaler Gateway and VDI or CVAD or StoreFront servers. |
| Session Bandwidth | The bandwidth consumed by the session irrespective of the interval of time. |
| Server Side Retransmits | The number of packets retransmitted on the connection between NetScaler and back end server. |
| Client Side Retransmits | The number of packets retransmitted on the connection between NetScaler and the end user. A high value of this metric does not mean that the user experience will not be seamless but indicates high bandwidth utilization due to retransmits. |
| Client side fast RTO | Number of times the retransmission timeout occurred the connection between NetScaler and the end user. |
| Server side fast RTO | Number of times the retransmission timeout occurred on the connection between NetScaler and back end server. |
| Bandwidth per Interval | The bandwidth consumed by the session during that particular interval of time. |
| Server side Zero Window size event | This counter indicates the number of times the server advertised a zero TCP window. |
| Client side Zero Window size event | This counter indicates the number of times the client advertised a zero TCP window. |
Related Desktop sessions report
These following metrics can be sorted by Bandwidth per interval, session reconnects, and ACR counts.
| Metrics | Description |
|---|---|
| Session ID | A unique identity for an ICA session. |
| Session Type | Application/Desktop. |
| State | Green/Red for active/Inactive sessions. |
| Host Delay | Average delay in ICA traffic that passes through the NetScalers caused by server network. |
| Bandwidth per Interval | The bandwidth consumed by the session during that particular interval of time. |
| Session Bandwidth | The bandwidth consumed by the session irrespective of the interval of time. |
| Bytes per Interval | Number of bytes consumed by the session during that particular interval of time. |
| Start Time | Session start time. |
| Up Time | Session duration. |
| Client IP Address | End user IP. |
| Server IP Address | Backend/ Citrix Virtual App server IP. |
| NetScaler IP Address | NetScaler Management IP (NSIP). |
| Client Type | Workspace type- Citrix Windows Client and so on |
| Client Version | Workspace version. |
| MSI | Boolean (Yes/No). Indicates if the session is multi-stream ICA. |
| Session Reconnects | Number of times the session reconnected. |
| ACR Counts | Total number of times a client automatically reconnects users to disconnected sessions. |
| User Access Type | Displays the mode of access of the ICA session. For example, NetScaler Gateway user/transparent mode. |
| Country | Country from which the session was established. |
| Region | Region from which the session was established. |
| City | City from which the session was established. |
| USB Status | Active/Inactive -Green/Red. |
| Number of USB Instances Accepted | The count of USB instances accepted. |
| Number of USB Instances Rejected | The count of USB instances rejected. |
| Number of USB Instances Stopped | The count of USB instances stopped. |
| Client Host Name | The host name of the client. |
| HA Failover Count | Number of times HA failover occurred. |
| Reason for termination | Displays the reason for a session termination. For example, ICA Session Timeout, Session terminated by the user. |
| ICA RTT | ICA RTT is the screen lag that the user experiences while interacting with an application or desktop hosted on Citrix Virtual Apps and Desktops respectively. |
| WAN latency | Latency caused by the client side of the network. That is, from NetScaler to end user. |
| DC latency | Latency caused by the server side of the network. That is, between NetScaler Gateway and VDI or CVAD or StoreFront servers. |
| Total Bytes | Total Bytes consumed by the user during the selected time period. |
| Server Side Retransmits | The number of packets retransmitted on the connection between NetScaler and back end server. |
| Client Side Retransmits | The number of packets retransmitted on the connection between NetScaler and the end user. A high value of this metric does not mean that the user experience will not be seamless but indicates high bandwidth utilization due to retransmits. |
| Client side Zero Window size event | This counter indicates the number of times the client advertised a zero TCP window. |
| Client side fast RTO | Number of times the retransmission timeout occurred the connection between NetScaler and the end user. |
| Server side Zero Window size event | This counter indicates the number of times the server advertised a zero TCP window. |
| Server side fast RTO | Number of times the retransmission timeout occurred on the connection between NetScaler and back end server. |
Instance view reports and metrics
The reports and metrics in the instance view are focused on the NetScaler instances.
To navigate to the Instance view:
-
Log on to your NetScaler ADM using a supported web browser.
-
Navigate to Analytics \> HDX Insight \> Instances.
Instance view reports and metrics consist of the following sections:
Instance summary view
This view is called the summary view as it shows the reports for all the NetScaler instances that are added to NetScaler ADM.
All the below metrics/reports, unless explicitly mentioned will have the values corresponding to them for the selected time period.
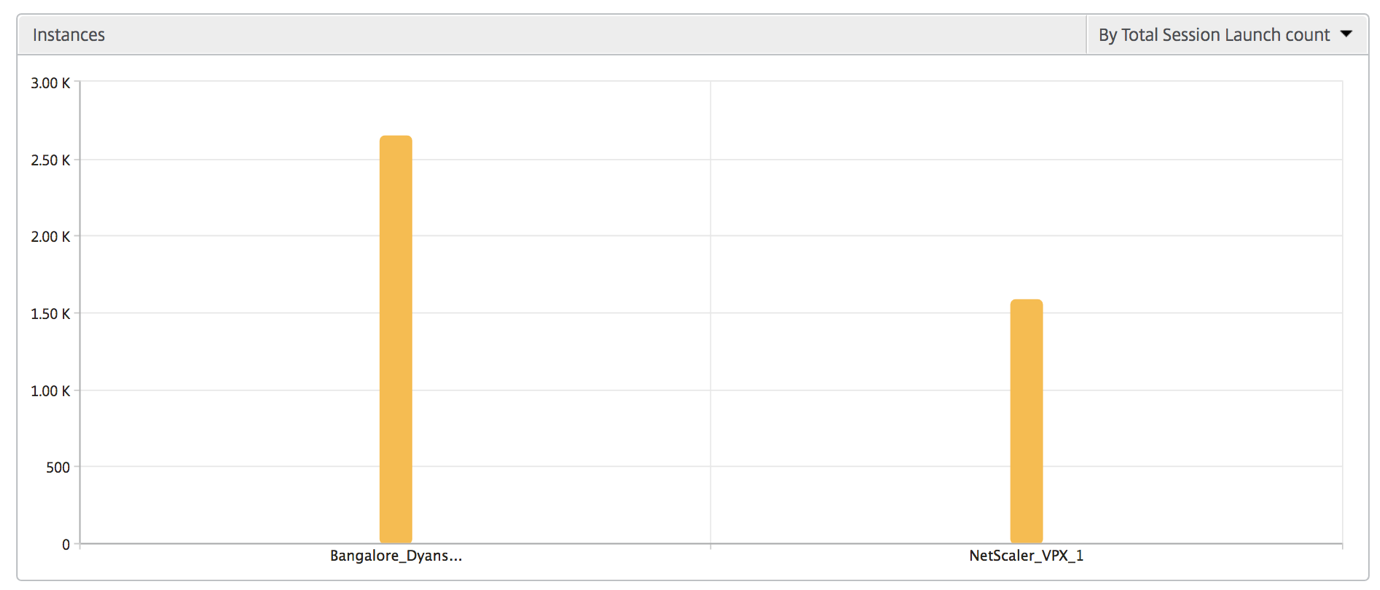
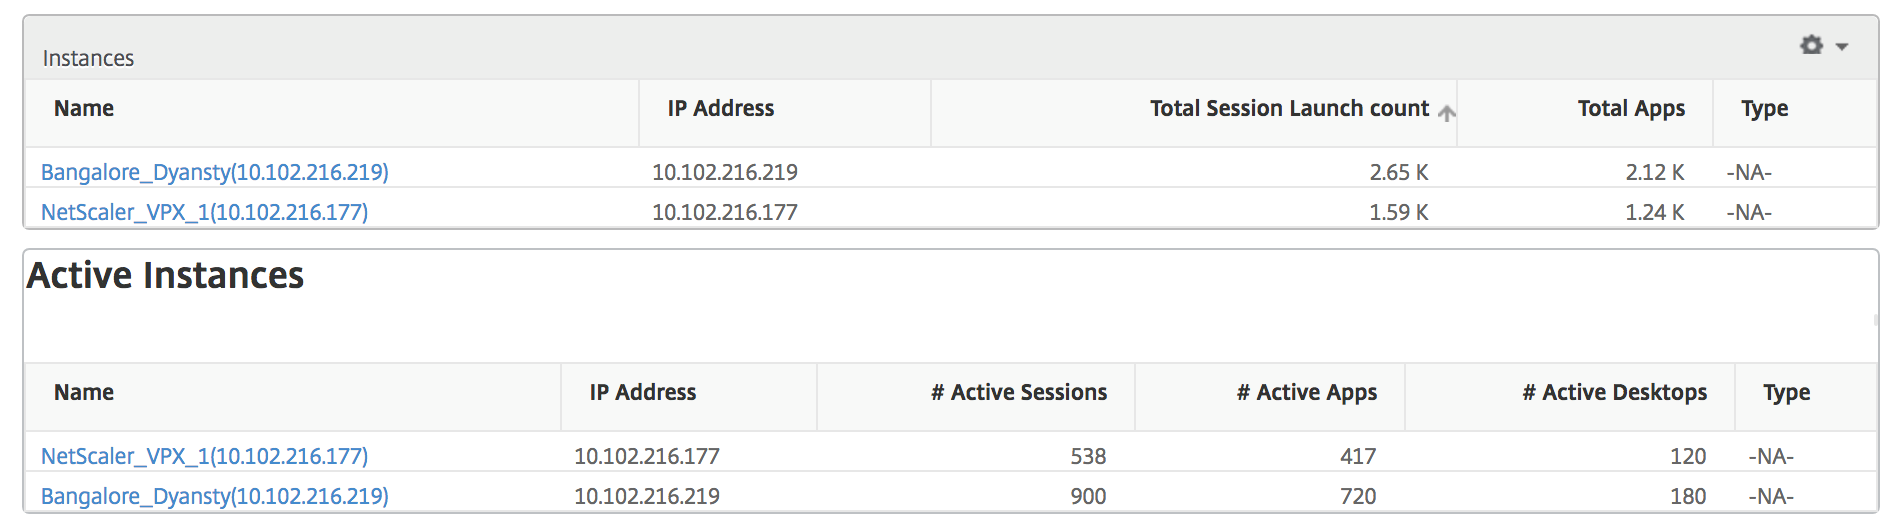
Instance bar graph
This graph displays the instance vs the Total Session Launch count | Total Apps which can be selected from the list on the top right on the graph canvas.
Instance/Active instances summary report
| Metrics | Description |
|---|---|
| Name | Host name of the NetScaler instance. |
| IP Address | NetScaler IP address. |
| Total Session Launch count | Total number of unique user sessions created during a given time interval. |
| Total Apps | Total number of unique applications launched during a given time interval. |
| Type | N/A |
Threshold report
Threshold report represents the count of thresholds breached where the entity is selected as Instance in the selected period. For more information, see how to create thresholds.
Skipped flows
A skipped flow is a record which skipped parsing ICA connection. This can occur due to multiple reasons like using unsupported Citrix Virtual Apps and Desktops versions, unsupported version of workspace or workspace type and so on This table shows the IP address and the skipped flow count. These workspaces may not be part of whitelisted workspaces. Hence these sessions are skipped from monitoring.

World view
The World Map view in HDX insight allows the administrators to view the historical and active users details from a geographical point of view. The administrators can have a World view of the system, drill-down to a particular country and further into cities as well by simply clicking the region. The administrators can further drill down to view information by city and state. From NetScaler ADM version 12.0 and later, you can drill down to users connected from a Geo location.
The following details can be viewed on the World Map in HDX insight, and the density of each metric is displayed in the form of a heat map:
-
ICA RTT
-
WAN Latency
-
DC Latency
-
Bandwidth
-
Total Bytes
Per instance view
Per instance view provides detailed end user experience reporting for a particular selected NetScaler instance.
To navigate to the instance view:
-
Log on to your NetScaler ADM using a supported web browser.
-
Navigate to Analytics \> HDX Insight \> Instances.
-
Select a particular instance from the Instance Summary Report.
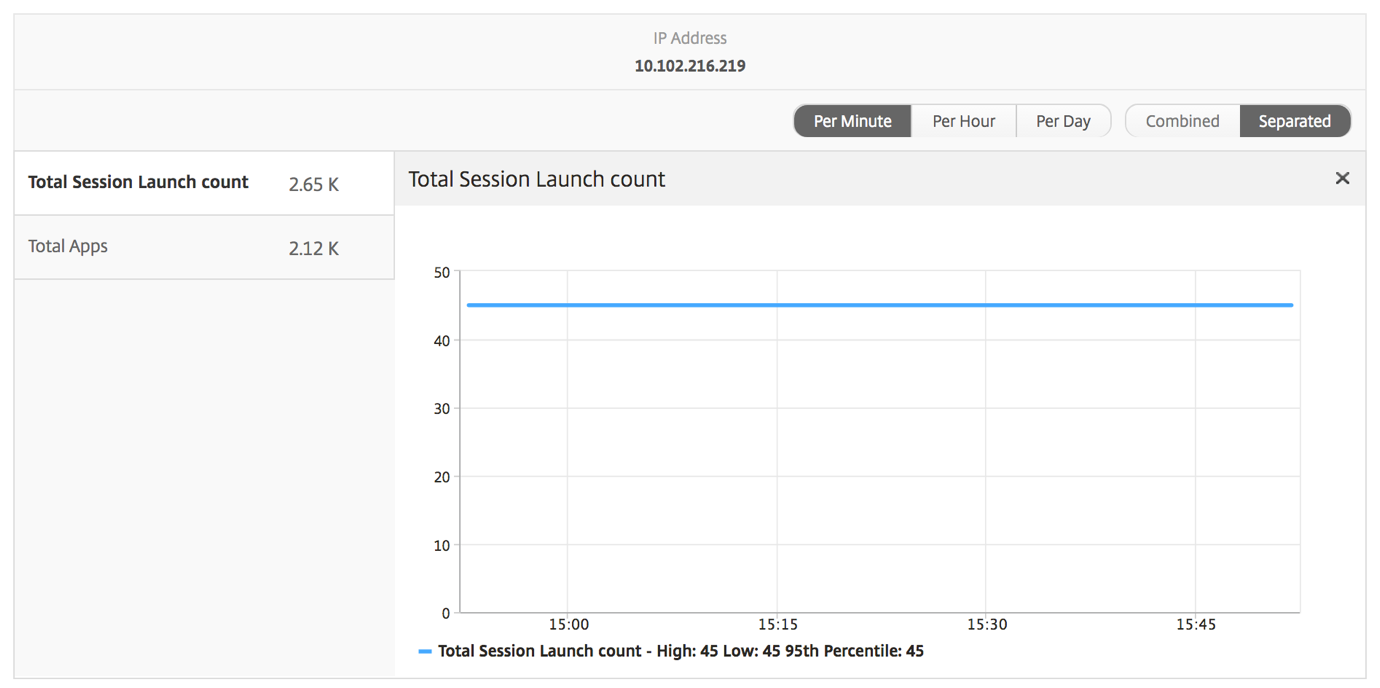
Line chart
| Metrics | Description |
|---|---|
| IP Address | This represents the NetScaler IP address of the selected instance. |
| Total session launch count | Total number of active Citrix Virtual App sessions during the given time interval. |
| Total Apps | Total number of unique applications launched during a given time interval. |
Applications bar graph
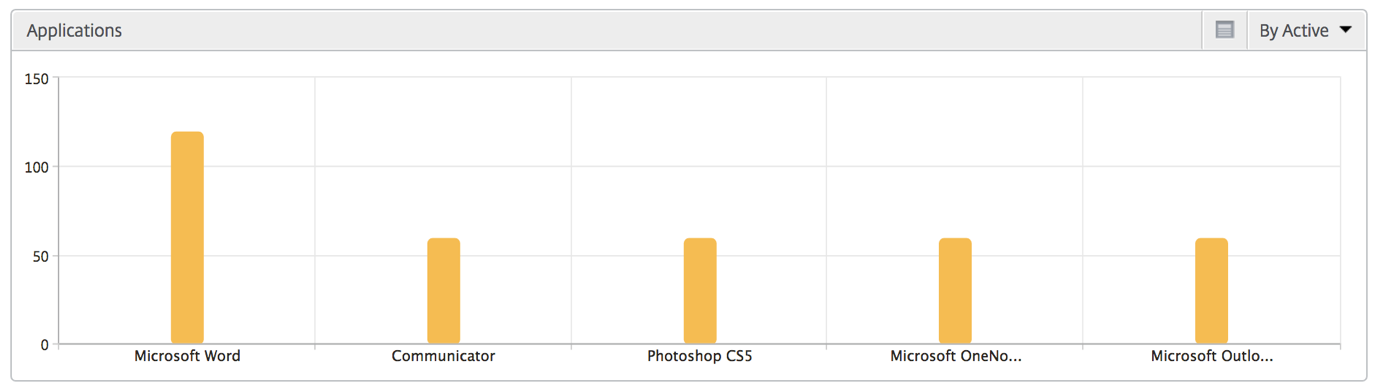
Displays top 5 applications based on the following criteria- by Active apps, total session launch count, total app launch count, or launch duration.
Users bar graph
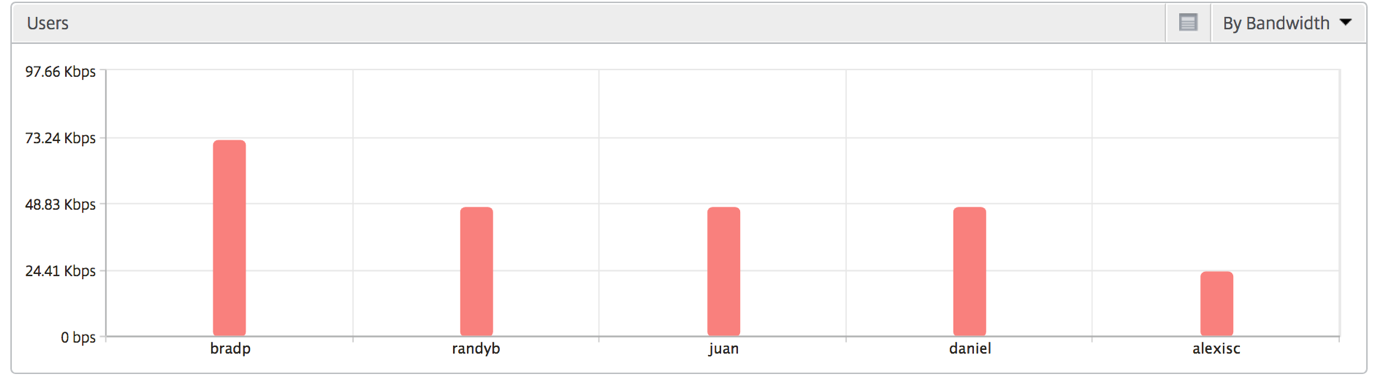
The Users bar graph displays top 5 users based on the following criteria
-
Bandwidth
-
WAN Latency
-
DC Latency
-
ICA RTT
Desktop Users report
This table gives the insight into the Citrix Virtual Desktop sessions for a particular user. These metrics can be sorted by Desktop Launch Count and Bandwidth.
| Metrics | Description |
|---|---|
| Name | Name of the Citrix Virtual Desktop. |
| Desktop Launch Count | Number of times the desktop has launched. |
| Bandwidth | Total bytes per second taken for end-to-end communication during the selected time interval. |
| DC latency | Latency caused by the server side of the network. That is, between NetScaler Gateway and VDI or CVAD or StoreFront servers. |
| WAN latency | Latency caused by the client side of the network. That is, from NetScaler to end user. |
| ICA RTT | ICA RTT is the screen lag that the user experiences while interacting with an application or desktop hosted on Citrix Virtual Apps and Desktops respectively. |
World view
The World Map view in HDX insight allows the administrators to view the historical and active users details from a geographical point of view. The administrators can have a World view of the system, drill-down to a particular country and further into cities as well by clicking the region. The administrators can further drill-down to view information by city and state. From NetScaler ADM version 12.0 and later, you can drill-down to users connected from a Geo location.
The following details can be viewed on the World Map in HDX insight, and the density of each metric is displayed in the form of a heat map:
-
ICA RTT
-
WAN Latency
-
DC Latency
-
Bandwidth
-
Total Bytes
License view reports and metrics
The license view gives details on the NetScaler Gateway license information.
To navigate to the License view:
-
Log on to your NetScaler ADM using a supported web browser.
-
Navigate to Analytics \> HDX Insight \> Licenses.
Line chart
| Metrics | Description |
|---|---|
| Licenses in use | The NetScaler Gateway CCU licenses being used during the selected timeline. Each count represents the number of user sessions. This is independent of the application and desktop sessions launched by that user. |
| Total licenses | Total number of NetScaler Gateway CCU licenses available for the customer to utilize. |
Threshold report
The threshold report represents the count of thresholds breached where the entity is selected as License in the selected period. For more information, see how to create thresholds.