Service graph for applications
To view service graph for an application:
-
Navigate to Applications > Dashboard.
-
Select an application.The application details page is displayed.
-
Select the time duration and click Service Graph.
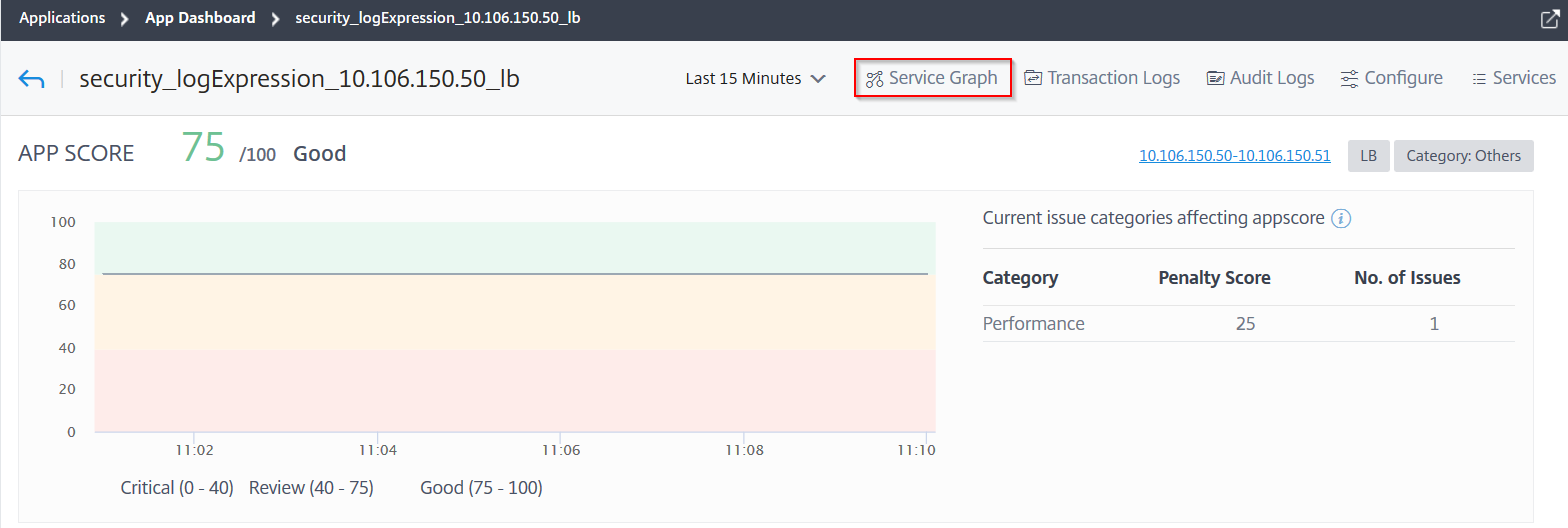 The service graph page is displayed for the selected application.
You can view service graph in Application View or in Network Functions View.
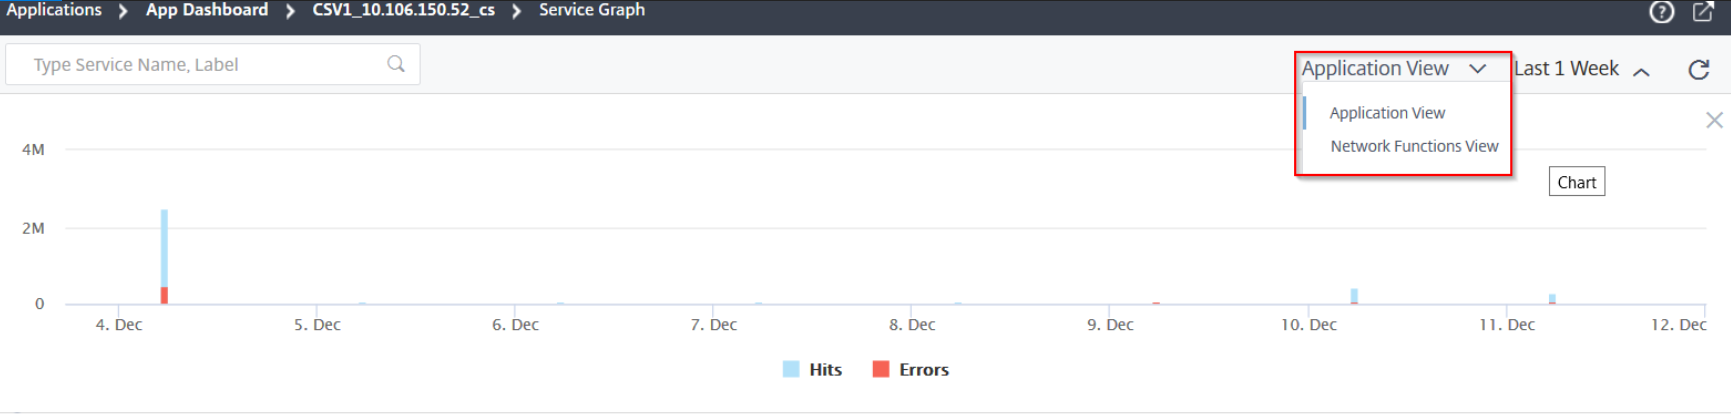
You can also drag and select the hits and errors to modify the results.

Related information
Application view
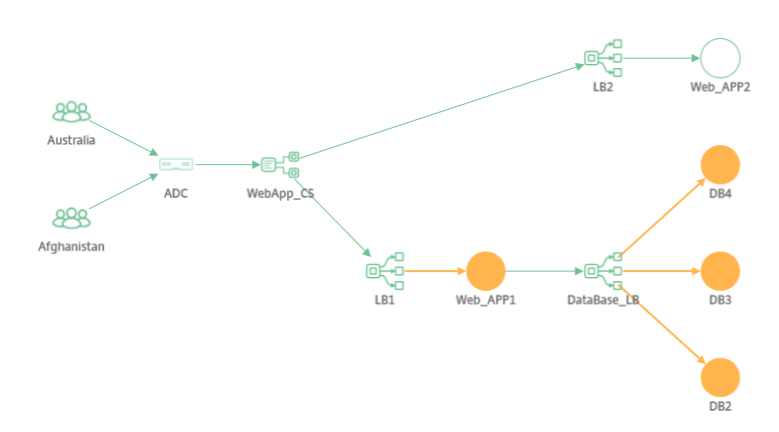
Displays the overview of the application configuration. In this view, you can visualize the communication between client, ADC, and web applications.
Network functions view
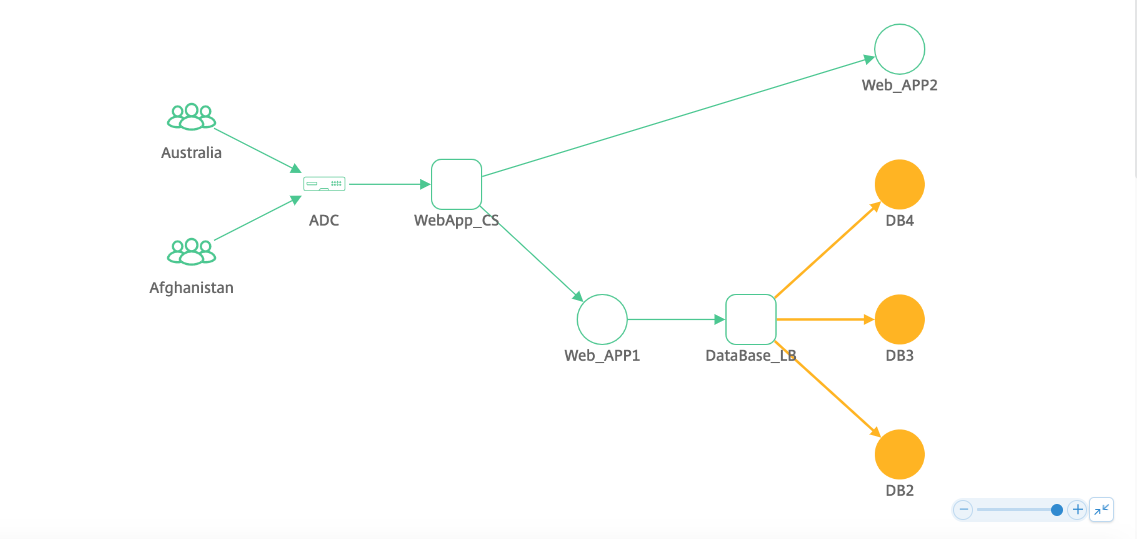
Displays the virtual servers associated with the application. In this view, you can visualize if the ADC is communicating with:
-
Content Switching virtual server to access the application
-
Load Balancing virtual server to access the application
-
Both Content Switching and Load Balancing virtual servers to access the application
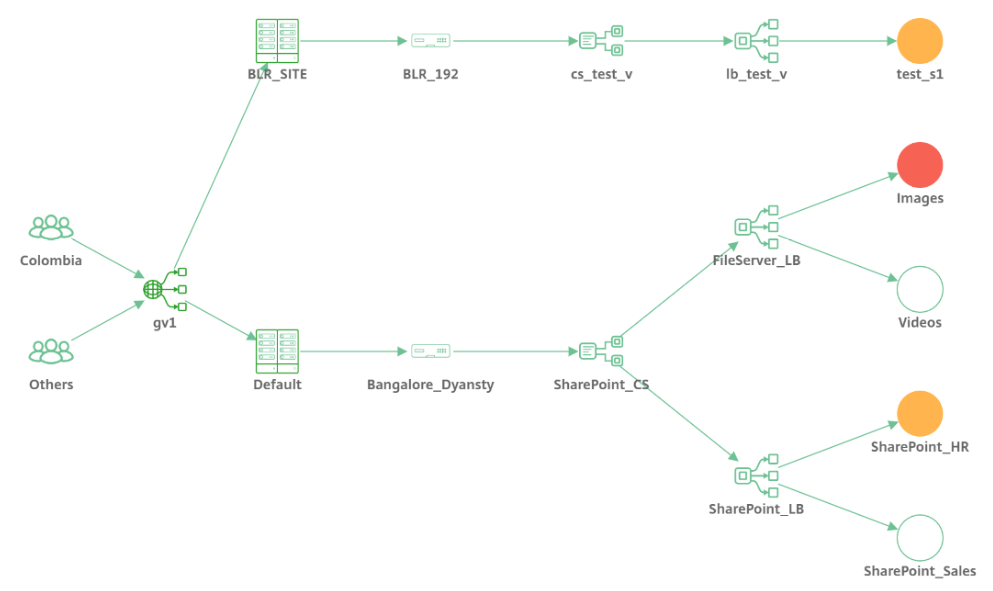
For GSLB application, the details are displayed along with the data center and NetScaler.
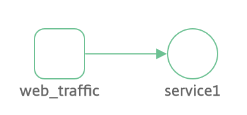
Service graph view for no active transactions
If no active transactions occur between ADC and web application, Service graph displays only the basic configuration of the application (without client and ADC).
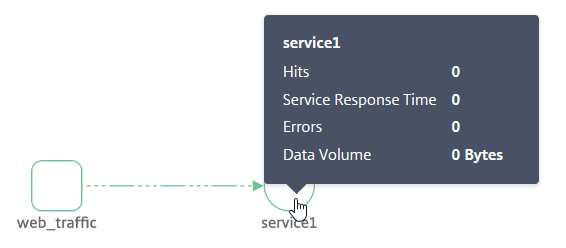
When you hover the mouse pointer on a service or virtual server, the details are displayed as 0 for all metrics because of no transactions.
Analyze metrics
Hover the mouse pointer on each service to view metrics details either in Application View or Network Function View.
Client metrics
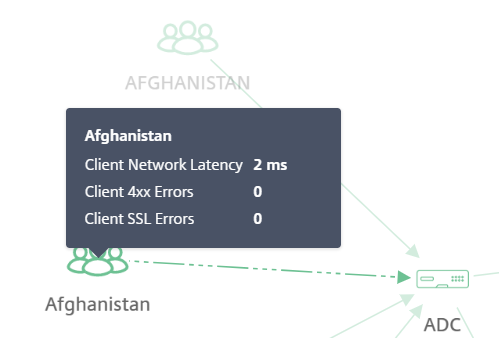
Hover the mouse pointer on the client to view client metrics.
-
Client Network Latency – Indicates the network latency from the client.
-
Client 4xx Errors – Indicates the total number of 4xx errors occurred from the client.
-
Client SSL Errors – Indicates the total number of SSL errors from the client.
Network function metrics
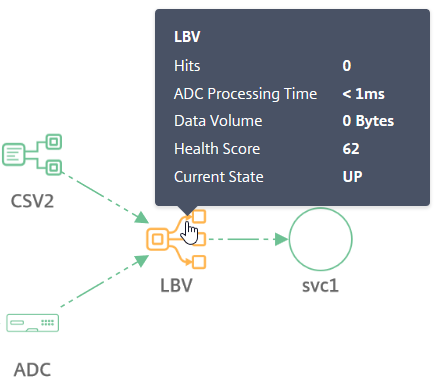
Hover the mouse pointer on a load balancing or content switching service to view the metrics details.
-
Hits – Indicates the total number of hits received by the virtual server
-
ADC processing time – Indicates the average processing time by the ADC instance
-
Data volume – Indicates the total data volume processed by the virtual server
-
Health score – Indicates the app score
-
Current state – Indicates the current status of the virtual server
Service metrics
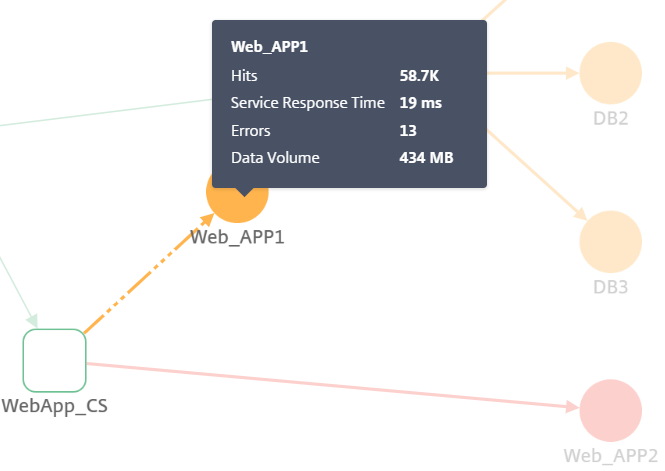
Hover the mouse pointer on a service (web application) to view the metrics
-
Hits – Indicates the total number of hits received by the service
-
Service response time – Indicates the average response time from the service
-
Errors – Indicates the total errors occurred from the service
-
Data Volume – Indicates the total data processed by the service
NetScaler metrics (only for GSLB applications)
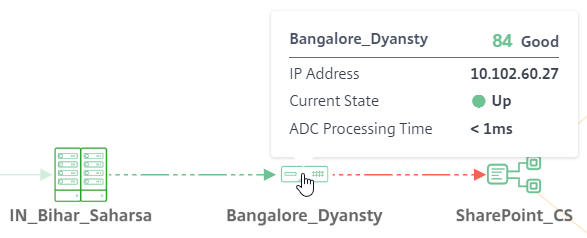
Hover the mouse pointer on the ADC to view the metrics.
-
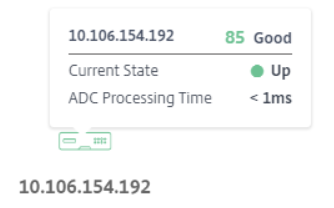
Displays the host name and the current ADC score. The score is calculated based on the different NetScaler potential issues. For more information, see Instance score.
-
IP Address – Denotes the NetScaler IP address
-
Current state – Denotes the NetScaler status such as Up, Down, or Out of service
-
ADC Processing Time – Denotes the average processing time by the ADC instance
Note
If a host name is not assigned to NetScaler:
-NetScaler IP address is displayed instead of host name.
-In the metrics, the NetScaler IP address information is not displayed.